


Abstract
Encephalitis represents a challenging condition to diagnose and treat. To assist physicians in considering autoimmune encephalitis (AE) sooner, we developed and validated a risk score.
The study was conducted as a retrospective cohort of patients with a diagnosis of definite viral encephalitis (VE) and AE from February 2005 to December 2019. Clinically relevant and statistically significant features between cases of AE and VE were explored in a bivariate logistic regression model and results were used to identify variables for inclusion in the risk score. A multivariable logistic model was used to generate risk score values and predict risk for AE. Results were externally validated.
A total of 1310 patients were screened. Of the 279 enrolled, 36 patients met criteria for definite AE and 88 criteria for definite VE. Patients with AE compared with VE were more likely to have a subacute to chronic presentation (odds ratio [OR] = 22.36; 95% confidence interval [CI], 2.05–243.7), Charlson comorbidity index <2 (OR = 6.62; 95% CI, 1.05–41.4), psychiatric and/or memory complaints (OR = 203.0; 95% CI, 7.57–5445), and absence of robust inflammation in the cerebrospinal fluid defined as <50 white blood cells/µL and protein <50 mg/dL (OR = 0.06; 95% CI, .005–0.50). Using these 4 variables, patients were classified into 3 risk categories for AE: low (0–1), intermediate (2–3), and high (4). Results were externally validated and the performance of the score achieved an area under the curve of 0.918 (95% CI, .871–.966).
This risk score allows clinicians to estimate the probability of AE in patients presenting with encephalitis and may assist with earlier diagnosis and treatment.
Encephalitis represents a challenging medical condition to diagnose and treat. Its global incidence is estimated between 3.5 and 10 per 100,000 inhabitants per year, affecting people of all ages [1–4]. The cost of hospitalization in the United States in 2010 for encephalitis was estimated at $2 billion [2]; however, this does not account for the significant neurological morbidity and mortality, with long-term consequences that affect the quality of life in survivors [5–7].
Over the past decade, increased recognition of autoimmune causes and the development of new molecular tools to diagnose infections have led to substantial improvements in the identification of causes of encephalitis [8, 9]. However, despite these improvements and increased awareness of autoimmune etiologies of encephalitis, up to 50% of encephalitis cases remain without an identified etiology [10–12].
Prompt treatment of encephalitis can dramatically impact morbidity and mortality. Timely administration of acyclovir in the setting of herpes simplex encephalitis (HSE), for example, decreases mortality from > 70% to < 20%, with corresponding improvements in morbidity [13, 14]. Although large, randomized, double-blinded studies of immune modulation in autoimmune encephalitis (AE) are lacking, accumulating evidence and recent guidelines point to the beneficial effects of early treatment [15–18]. Indeed, the benefit of immune treatments in AE may be blunted in cases with delays in diagnosis and therapy [19], highlighting the importance of the need for a timely diagnosis.
Delays in diagnosis have also been found to be an important factor in prolonged hospital length of stay of patients with AE, thus increasing health system costs [20]. Such delays may be related to continued lack of awareness of AE syndromes and delays related to the availability of testing. Indeed, cerebrospinal fluid (CSF) studies for the detection of antibodies against neuronal cell-surface or synaptic proteins are not typically readily available yet in most hospitals and samples need to be sent to reference laboratories for testing, with turnaround time up to 7 to 10 days.
To assist physicians in considering the possibility of AE sooner, we developed and validated a risk scoring system that uses clinical and laboratory data present on admission to estimate the risk of AE.
METHODS
Study Population
The development phase of the study was conducted as a retrospective cohort of patients with a diagnosis of encephalitis from February 2005 to December 2019 at 2 tertiary hospital systems in Houston, Texas: the Memorial Hermann Health System and the Harris Health System. Each case was identified by the presence of an International Classification of Diseases (ICD)-9 code of encephalitis upon discharge. Because of notoriously low accuracy of encephalitis-related ICD codes, inclusion of each case was determined using the 2013 International Encephalitis Consortium (IEC) criteria [21] by 2 physicians. Only cases of patients aged 18 years or older that met the criteria for probable or confirmed encephalitis were retained in the study. Cases in which no viral or autoimmune etiology of encephalitis was identified were excluded.
A further designation of confirmed viral encephalitis (VE) was made per 2013 IEC criteria: [21]
Patients presenting with altered mental status (defined as decreased or altered level of consciousness, lethargy, or personality change) lasting ≥24 h with no alternative cause identified.
and
2. At least 3 of the following:
Fever ≥38 °C (100.4 °F) within the 72 h before or after presentation.
Seizures not fully attributable to a preexisting seizure disorder.
New onset of focal neurologic findings.
CSF white blood cell (WBC) count ≥5 cells/mm3.
Abnormality of brain parenchyma on neuroimaging suggestive of encephalitis that is either new from prior studies or appears acute in onset.
Abnormality on electroencephalography that is consistent with encephalitis and not attributable to another cause.
plus
3. Presence of laboratory confirmation of acute infection with a viral microorganism strongly associated with encephalitis documented by polymerase chain reaction (PCR) or serology.
A designation of definite AE was made via Graus et al. criteria [8]; patients had to meet all 3 of the following:
Subacute onset (rapid progression of <3 months) of working memory deficits (short-term memory loss), altered mental status, or psychiatric symptoms
At least 1 of the following:
New focal central nervous system findings
Seizures not explained by a previously known seizure disorder
CSF pleocytosis (WBC count >5 cells/mm3)
Magnetic resonance imaging features suggestive of encephalitis
Exclusion of alternative causes
plus
Presence of laboratory confirmation of antibodies against neuronal cell-surface or synaptic proteins.
Each chart that met these criteria was further assessed for a predetermined set of clinical features related to demographics, comorbidities, clinical presentation, and diagnostics. Variables were chosen based on prior studies identifying their importance in diagnosis or relationship to outcomes of patients presenting with encephalitis [12]. In addition, variables needed to be available upon standard initial evaluation in patients presenting with encephalitis.
To assess an individual's disease burden, the Charlson Comorbidity Index (CCI) was calculated. Immunocompromised status was defined as having received a solid organ transplant, having an active cancer diagnosis, receiving ≥ 20 mg of prednisone or equivalent for > 1 month, or the presence of a congenital immunodeficiency. No distinction was made between those patients with uncontrolled or well-controlled human immunodeficiency virus infection. Movement disorders considered included tremors, parkinsonism, dystonia, chorea, myoclonus, and nonstroke-related ataxia. A subacute to chronic presentation was defined as symptoms for > 6 days before presentation. Absence of robust inflammation in the CSF was defined as < 50 WBC/µL and protein <50 mg/dL because both variables were predictive for AE on bivariate analysis.
Because the study was retrospective in nature, it was exempt from patient consent. This study was approved by the University of Texas Health Committee for the Protection of Human Subjects, the Memorial Hermann Hospital Research Review Committee, and the Harris Health Research Committee.
Statistical Analysis Method
The outcome of the prediction model was the probability of definite AE as defined earlier.
The entire development dataset was used for the construction of the risk model. Each variable had < 5% of missing data. Data were handled as a complete case analysis.
The distribution of demographic and clinical features between cases of autoimmune and VE was compared using Student t test for continuous variables and χ2 tests/Fisher exact tests for categorical variables.
Clinically relevant and statistically significant (P < .05) features were explored further in a bivariate (unadjusted) logistic regression model. The multivariate model used in the study was a binomial regression using a logit-link. All variables with a P value < .05 were entered into a stepwise regression model. The results from the logistic regression were used to determine which variables to include in the final risk score. Independently associated variables with the outcome were used to create a risk score that classified patients as low, intermediate, or high risk of having AE.
To evaluate the model performance, we assessed model discrimination with a concordance statistic (C-statistic), also known as the area under the receiver operating characteristics curve (AUC ROC). Goodness of fit was assessed using the Hosmer-Lemeshow test. Internal validation was performed by calculating the optimism-adjusted C-statistic using 1000 bootstrap samples from the data set. This methodology has been validated and recommended in studies of relatively small sample sizes such as ours [22, 23]. Following internal validation, recalibration was not necessary.
Variance of AUC was computed as defined by DeLong et al. with the DeLong test [24]. Statistical analysis was performed with SPSS version 25 (IBM, Austin, Texas) and freeware R version 4.1.2 with ROCR package.
External Validation
The external validation cohort consisted of patients with encephalitis recruited from 1 tertiary care center (Johns Hopkins Hospital, Baltimore, Maryland), via a retrospective cohort (before March 2019) and a prospectively enrolled registry of patients with suspected encephalitis enrolled (between March 2019 and December 2021). Demographics and clinical data were captured by medical record review. For model validation, we only used patients that presented as confirmed viral or definite AE as defined previously. Probable and possible AE were excluded [8], as were cases of encephalitis with an unidentified etiology.
Model development and validation were performed according to transparent reporting for individual prognosis or diagnosis (TRIPOD) guidance of multivariable prediction models [25].
RESULTS
Demographics and Clinical Presentation
A total of 1310 adult (age ≥18 years) inpatient hospital admissions were identified by the presence of an encephalitis-related ICD-9 code as a discharge diagnosis, of which 279 cases met the 2013 IEC clinical criteria for probable or confirmed encephalitis. Of these, a laboratory-confirmed diagnosis of AE or VE was identified in 36 (12.9%) and 88 (31.5%) cases, respectively (Figure 1).
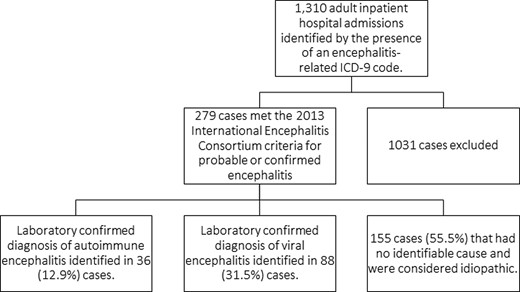
Study population from the development cohort.
Compared with VE, patients with AE were more likely to be younger than 60 years (odds ratio [OR] = 6.92; 95% confidence interval [CI], 1.97–24.25); have a subacute to chronic presentation since onset of symptoms (OR = 7.99; 95% CI, 2.89–22.95); present with seizures (OR = 4.51; 95% CI, 1.90–10.34); report psychiatric and/or memory complaints (OR = 58.33; 95% CI, 7.6–445.9); and have movement disorders (OR = 4.06; 95% CI, 1.67–9.87).
Furthermore, patients with AE were less likely to be febrile (OR = 6.77; 95% CI, 2.81–16.34) or to have robust inflammation in the CSF (OR = 36.3; 95% CI, 12.4–106.6); and more likely to have a CCI < 2 (OR = 5.40; 95% CI, 1.92–15.1).
Comparisons of demographics and presenting clinical features between cases of autoimmune and VE are shown (Table 1).
Baseline Characteristics of the Development Cohort
| Autoimmune | Virala | Odds Ratio | P Value | ||
|---|---|---|---|---|---|
| N = 36 (%) | N = 88 (%) | (95% CI) | |||
| Age < 60 y | 33 (91%) | 54 (61%) | 6.92 (1.97–24.35) | .001 | |
| Sex | |||||
| Female, n/N (%) | 21 (58%) | 37 (42%) | 0.51 (.23–1.13) | .09 | |
| Race | |||||
| White | 7 | 42 | |||
| Black | 16 | 18 | |||
| Hispanic | 9 | 20 | |||
| Asian | 3 | 4 | |||
| Unspecified | 1 | 4 | |||
| Coexisting medical conditions | |||||
| Charlson Comorbidity Index <2 | 31 (86%) | 47 (53%) | 5.40 (1.92–15.1) | .001 | |
| Immunosuppressed | 6 (16%) | 23 (26%) | 0.56 (.20–1.53) | .25 | |
| HIV/AIDS | 3 (8%) | 16 (18%) | 0.38 (.10–1.42) | .14 | |
| Timing to presentation | |||||
| Subacute (6–30 d) to chronic (>30 d) | 31 (86%) | 38 (43%) | 7.99 (2.89–22.95) | .000 | |
| Clinical features | |||||
| Absence of fever | 27 (75%) | 27 (30%) | 6.77 (2.81–16.34) | .000 | |
| Psychiatric and/or memory complaints | 35 (97%) | 33 (37%) | 58.33 (7.6–445.9) | .000 | |
| Seizures | 24 (66%) | 27 (30%) | 4.51 (1.9–10.34) | .000 | |
| Absence of robust inflammation in CSF (WBC <50/µL and Protein <50 mg/dL) | 29 (80%) | 9 (10%) | 36.3 (12.4–106.6) | .000 | |
| Movement disorders | 15 (41%) | 13/87 (15%) | 4.06 (1.67–9.87) | .001 | |
| Focal neurological deficits | 12 (33%) | 37/87 (42%) | 0.67 (.30–1.52) | .34 |
Etiologies of viral encephalitis included: West Nile virus (35), herpes simplex virus (19), varicella zoster virus (18), Epstein-Barr virus (6), cytomegalovirus (4), St. Louis encephalitis virus (4), JC virus (2). Statistically significant P values <.05 are marked in bold.
Model and Risk Score Development
Clinical features with statistically significant differences between autoimmune and VE were assessed in a bivariate logistic model. This model identified 4 clinical features present on admission associated with AE: subacute to chronic presentation (OR = 22.36; 95% CI, 2.05–243.7), CCI < 2 (OR = 6.62; 95% CI, 1.05–41.4), psychiatric and/or memory complaints (OR = 203.0; 95% CI, 7.57–5445), and absence of robust inflammation in the CSF (OR = 0.06; 95% CI, .005–.50) (Table 2).
Prognostic Factors of Autoimmune Encephalitis by Logistic Regression
| Clinical Characteristics | Adjusted OR (95% CI) | P Value |
|---|---|---|
| Age less than 60 y | 4.34 (.56–33.2) | .157 |
| Charlson Comorbidity Index <2 | 6.62 (1.05–41.4) | .043 |
| Subacute (6–30 d) to chronic (>30 d) onset | 22.36 (2.05–243.7) | .011 |
| Absence of fever | 0.23 (.03–1.44) | .119 |
| Seizures | 7.49 (.99–56.5) | .051 |
| Psychiatric and/or memory complaints | 203.0 (7.57–5445) | .002 |
| Movement disorders | 7.22 (.85–61.1) | .069 |
| Absence of robust inflammation in CSF (WBC <50/µL and protein <50 mg/dL) | 0.05 (.005–0.50) | .011 |
Abbreviations: CI, confidence interval; CSF, cerebrospinal fluid; OR, odds ratio; WBC, white blood cell.
After adjustment in a multivariable model, each of these features remained statistically significant and were used in the final risk score development. On internal validation of the 4 variables by bootstrapping, the Hosmer and Lemeshow test was nonsignificant (P = .964), demonstrating that there is no strong evidence supporting the lack of fitness of the logistic model. Using these 4 variables associated with AE, we created a scoring system ranging from 0 to 4, with 1 point assigned to each variable.
Model Performance
We evaluated the model performance of the scoring system used to predict the risk of AE. As shown in Figure 2A, the AUC was 0.870 (95% CI, .815–.925). The best computed threshold defined as the best sum of sensitivity + specificity was a score of 2.5 (sensitivity = 75%; specificity = 84%).
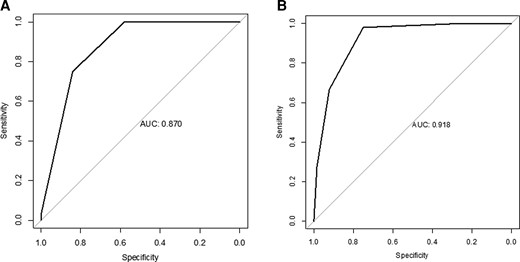
ROC curves of the risk score for autoimmune encephalitis. A, ROC curve of the risk score for autoimmune encephalitis of the development cohort. B, ROC curve of the risk score for autoimmune encephalitis of the validation cohort. Abbreviation: ROC, receiver operating characteristic.
External Validation
The validation cohort comprised 115 patients (from 2005 to 2021), 51 with definite AE and 64 with VE (86% herpes simplex virus-1, 11% varicella zoster virus, 3% other). Mean age was 50.6 years (±19.7), and 52.2% of patients were women. As shown in Figure 2B, the performance of the score achieved an AUC of 0.918 (95% CI, .871–.966). The best computed threshold was a score of 1.5 (sensitivity = 98%; specificity = 75%). Table 3 presents the distribution of patients with AE and VE according to their scores, whereas performance for each score result is presented Table 4.
Distribution of Patients With Autoimmune and Viral Encephalitis According to the Number of Prognostic Factors Associated With Autoimmune Encephalitis Present
| Score Result | Viral Encephalitis | Autoimmune Encephalitis | ||
|---|---|---|---|---|
| Development cohort | ||||
| N = 88 | % | N = 36 | % | |
| 0 | 18 | 20.5 | 0 | 0.0 |
| 1 | 33 | 37.5 | 0 | 0.0 |
| 2 | 23 | 26.1 | 9 | 25.0 |
| 3 | 14 | 15.9 | 26 | 72.2 |
| 4 | 0 | 0.0 | 1 | 2.8 |
| Validation cohort | ||||
| N = 64 | % | N = 51 | % | |
| 0 | 17 | 26.6 | 0 | 0.0 |
| 1 | 31 | 48.4 | 1 | 2.0 |
| 2 | 11 | 17.2 | 16 | 31.2 |
| 3 | 4 | 6.3 | 20 | 39.2 |
| 4 | 1 | 1.6 | 14 | 27.5 |
Score Performance for the Development and the Validation Cohorts
| Sensitivity | Specificity | PPV | NPV | |
|---|---|---|---|---|
| Development cohort | ||||
| 0 | 100% | 0% | 29% | … |
| 1 | 100% | 20% | 34% | 100% |
| 2 | 100% | 58% | 49% | 100% |
| 3 | 75% | 84% | 66% | 89% |
| 4 | 3% | 100% | 100% | 89% |
| Validation cohort | ||||
| 0 | 100% | 0% | 44% | … |
| 1 | 100% | 27% | 52% | 100% |
| 2 | 98% | 75% | 76% | 98% |
| 3 | 67% | 92% | 87% | 78% |
| 4 | 27% | 98% | 93% | 63% |
Abbreviations: NPV, negative predictive value; PPV, positive predictive value.
Classification of AE Risk Category
To assist clinicians in interpreting the risk of AE, patients were subsequently classified into 3 risk categories based on the risk scores: low (0–1 variables); intermediate (2–3 variables); and high risk (4 variables). Figure 3 illustrates the predicted risk of AE based on the risk category using all data from the development and validation cohorts.
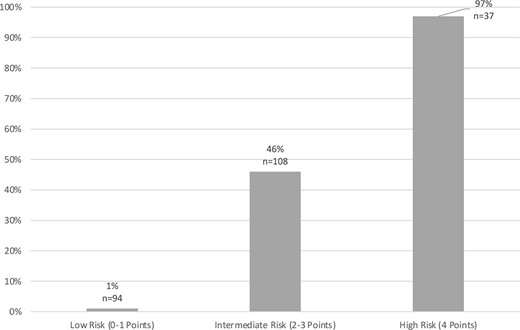
Predicted risk for autoimmune encephalitis. Illustrates the predicted risk of autoimmune encephalitis based on risk category using all data from the development and validation cohorts.
DISCUSSION
Main Results
A key consideration in evaluating patients with encephalitis is whether the process is autoimmune or viral because this distinction has important implications for disease management and prognosis. In our population of adult patients presenting with encephalitis in several hospitals in the United States, we found that a prediction model combining clinical and biological data available at onset allows for an objective early estimation of the likelihood of AE. The relevant factors included longer time to presentation, presence of memory and/or psychiatric symptoms, a low CCI, and absence of robust inflammation in the CSF. The presence of 2 or more of these variables indicates an intermediate or higher risk of AE.
Although age < 60 years was associated with AE on bivariate analysis, it was not significant in the multivariate analysis. We used the CCI as a summary for comorbidities, which includes the age. Age and CCI were correlated which likely explains why age was not significant upon further analysis.
Earlier Diagnosis
The initial management of encephalitis typically includes rapid testing for infectious etiologies, with CSF gram stain and culture, CSF PCR testing for the most common viral pathogens and, if relevant, arboviral serologies [14]. Panel testing for neural autoantibodies is not typically performed as a first-line examination and is not performed in every center. Moreover, distinctive brain magnetic resonance imaging signatures are lacking for most autoantibody-associated encephalitis [26]. Thus, the prediction tool that we have developed can be quite valuable for the early management of encephalitis. It includes clinical variables readily available at onset and early results of routine CSF testing consisting of only the WBC count and CSF protein level.
Although the optimal threshold scores differed somewhat between development and validation groups, the clinical importance of the score lies in stratification into low-, medium-, or high-risk groups for AE so that clinicians can readily use this model. A risk score of 2 or higher at presentation should raise concern for the possibility of AE and may prompt the early sending of CSF antineural antibodies.
Earlier Treatment
Among patients with suspected encephalitis, treatment against HSE and, in some cases, Listeria is started empirically before available microbiological results [14, 21]. Numerous data are available to support the benefits of early treatment of Listeria [27] and HSE [28, 29]. However, no large double-blind study is available on the outcome of AE concerning speed of initiation of immunotherapy. Retrospective data and case reports suggest that earlier treatment is associated with a better outcome [15, 30]. A patient presenting with a high predictive score of AE could potentially receive earlier immunotherapy, which may lead to better long-term outcomes [31]. Of note, however, is that a high probability of AE at onset should not delay the empiric treatment of infectious encephalitis.
Stratification of the Diagnostic Evaluation
Typically, once initial laboratory studies, including CSF viral PCRs and bacterial cultures are negative, the question of additional diagnostics and empiric treatment is raised. Metagenomic next-generation sequencing (NGS) has emerged as a molecular diagnostic tool that can assist in identifying pathogens as a cause of infectious encephalitis. Issues of availability and cost prevent widespread usage of NGS at this time. Notably, false positives can occur [32]. and may confound the diagnosis in cases of AE. Our prediction model could assist in the decision as to whether to prioritize testing of neural antibodies versus metagenomic NGS when initial studies are negative.
Burden of Encephalitis
The delay in diagnosing and treating patients with AE represents a high hospital burden. A recent study compared the hospital length of stay and charges for AE versus HSE. The length of stay in hospital was three times longer for patients with AE and the length of stay in ICU was 2-fold longer [20]. Median hospital charges were correspondingly higher for AE, and the total costs for a 10-year period was nearly twice for patients with AE compared with HSE [20]. The difference in length of stay and charges was driven, in part, by delays in diagnosis and initiation of treatment. Thus, the use of our score to inform a more rapid diagnosis with earlier treatment initiation has the potential to decrease the substantial hospital burden of AE.
Strengths and Limitations
The development of our score follows all the recommended steps in the TRIPOD statement [25]. The external validation of the score confirms the robustness of our findings. Our approach uses combined clinical and biological data available at onset and can help physicians in their early clinical decision-making.
Given the high level of mortality and morbidity of HSE, along with highly effective antiviral treatments with limited side effects, our score is not intended to replace recommendations for early management of encephalitis, but to assist in the choice and stratification of the diagnostic evaluation.
Several limitations should be noted. This retrospective study included populations as early as 2005, when many AE cases, including severe cases that progressed rapidly to death without confirmation of diagnosis, were likely underrecognized. This bias may impact the differences noted between the AE and VE groups, but also justifies validation of this score through a prospective cohort. Second, the particular epidemiology of VE cases encountered in the development cohort, in which West Nile Virus predominated, differed as compared with the validation cohort, in which HSV predominated. Importantly, despite such differences, the score performed quite well in the validation cohort, suggesting the potential for generalizability. Other limitations include a relatively small sample size along with differing proportions of AE cases in the development and validation cohorts. There were some missing data, although the proportion was low. All of the above could have contributed to the differences in the computed thresholds between the cohorts.
Furthermore, patients were only from the United States, and generalizability to other countries would need to be validated. The AE cohorts were compared only with those of VE, and thus did not include all patients initially suspected of having encephalitis. However, this is the most clinically relevant comparison, since the major distinction facing clinicians is between VE and AE. Finally, to develop this score, we chose to clearly define the outcome by not including possible and probable encephalitis. Further studies will be needed to apply and develop such scores to cases of possible and/or probable AE.
CONCLUSION
Our findings suggest that clinical and laboratory data available on standard initial evaluation in patients presenting with encephalitis can be used to estimate the probability of an autoimmune etiology. This prediction model represents a significant step toward earlier diagnosis and treatment of AE.
Notes
Acknowledgments. The authors thank Rod and Dolores Starr from the Grant A Starr foundation for support of their studies (R. H. and A. G.) (Paid to institution). They also thank the Aarons Family Fund for their support (to A. V.) (Paid to institution).
References
Author notes
Alejandro Granillo, Marion Le Maréchal, Arun Venkatesan and Rodrigo Hasbun contributed equally to this work
Potential conflicts of interest. R. H. has received research support and personal fees from Biofire. A. V. has consulted for Janssen Pharmaceuticals (< 5 hours of consulting, payment to author). J. P. reports a role as Member of the Board of Directors of the Neurohospitalist Society; and other financial or nonfinancial interests as Editor-in-Chief of the NEJM Journal Watch Neurology. All other authors report no potential conflicts. All authors have submitted the ICMJE Form for Disclosure of Potential Conflicts of Interest. Conflicts that the editors consider relevant to the content of the manuscript have been disclosed.

