


Abstract
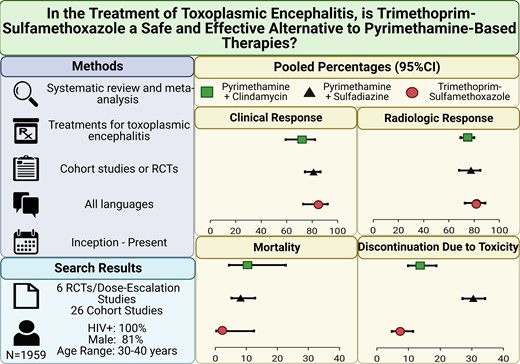
Toxoplasmic encephalitis (TE) is an opportunistic infection of people with human immunodeficiency virus (HIV) or other causes of immunosuppression. Guideline-recommended treatments for TE are pyrimethamine and sulfadiazine (P-S) or pyrimethamine and clindamycin (P-C); however, a substantial price increase has limited access to pyrimethamine. Consequently, some centers have transitioned to trimethoprim-sulfamethoxazole (TMP-SMX), an inexpensive alternative treatment. We aimed to review the evidence on the efficacy and safety of pyrimethamine-containing therapies vs TMP-SMX.
We searched for and included randomized controlled trials (RCTs) and observational studies of TE treatments, regardless of HIV status. Data for each therapy were pooled by meta-analysis to assess the proportions of patients who experienced clinical and radiologic responses to treatment, all-cause mortality, and discontinuation due to toxicity. Sensitivity analyses limited to RCTs directly compared therapies.
We identified 6 RCTs/dose-escalation studies and 26 single-arm/observational studies. Identified studies included only persons with HIV, and most predated modern antiretroviral treatment. Pooled proportions of clinical and radiologic response and mortality were not significantly different between TMP-SMX and pyrimethamine-containing regimens (P > .05). Treatment discontinuation due to toxicity was significantly lower in TMP-SMX (7.3%; 95% confidence interval [CI], 4.7–11.4; I2 = 0.0%) vs P-S (30.5%; 95% CI, 27.1–34.2; I2 = 0.0%; P < .01) or P-C (13.7%; 95% CI, 9.8–18.8; I2 = 32.0%; P = .031). These results were consistent in analyses restricted to RCT data.
TMP-SMX appears to be as effective and safer than pyrimethamine-containing regimens for TE. These findings support modern RCTs comparing TMP-SMX to pyrimethamine-based therapies and a revisiting of the guidelines.
Created with BioRender.com
Toxoplasmic encephalitis (TE) is an opportunistic central nervous system infection caused by Toxoplasma gondii and is one of the most lethal manifestations of T. gondii infection [1]. Concerning human immunodeficiency virus (HIV), antiretroviral therapy (ART) has significantly decreased the incidence and case fatality rate of TE [2]. Among those with low CD4 counts, trimethoprim-sulfamethoxazole (TMP-SMX) prophylaxis for Pneumocystis jirovecii pneumonia (PCP) has also decreased the incidence of TE due to cross-protection [3]. However, TE remains among the most common deadly neurologic complications of advanced HIV, especially in lower-income countries where ART and TMP-SMX prophylaxis are less accessible [1]. TE is also a rare, severe complication of immunosuppression during transplantation [4], occurring in approximately 2%–3% of allogeneic hematopoietic stem cell transplant recipients [5] and, less commonly, in patients receiving chemotherapy [6].
Current American HIV [7] and solid organ transplant (SOT) [4] guidelines recommend combination therapy with pyrimethamine, sulfadiazine, and folinic acid (P-S) as the first-line treatment for TE. Second-line treatment involves combination therapy with pyrimethamine, clindamycin, and folinic acid (P-C) [4, 7]. Although TMP-SMX is the first-choice therapy for TE in many resource-limited settings, guidelines only suggest TMP-SMX as an alternative when pyrimethamine is unavailable [4, 7]. In Canada, however, many major institutions have been using TMP-SMX as the first-line therapy for TE for decades due to challenges accessing pyrimethamine, reduced pill burden, local (unpublished) data, and favorable anecdotal experience.
Whether TE therapies are equivalent became very relevant in 2015 when the price of pyrimethamine increased by 5000% in the United States [8]. This price increase continues to impose significant barriers to access [8]. We, therefore, sought to conduct a systematic review of observational and randomized controlled trial (RCT) evidence to compare the efficacy and safety of treatments for TE.
METHODS
Protocol
The Supplementary Methods contain the protocol, which was revised during the peer review process, but this study was not preregistered.
Search Strategy
We searched MEDLINE, Embase, and the Cochrane Library databases from inception to present (22 March 2022) for cohort studies or RCTs of TE treatments, without language restrictions (Supplementary Table 1). Selected studies’ reference lists were mined for additional articles relevant for inclusion. The World Health Organization International Clinical Trials Registry Platform and clinicaltrials.gov were searched for ongoing studies.
Article Selection
We included RCTs or observational studies that involved adults, regardless of HIV status, and reported on acute TE treatment outcomes (≥1 of partial or complete radiologic response, partial or complete clinical response [hereafter referred to as clinical and radiologic response, as defined by each study], or all-cause mortality). TE was defined according to the study’s definition. Articles were excluded if they were limited to children, reported on <20 patients treated for TE in each treatment arm, or did not present outcomes by treatment received. Gray literature was excluded. Articles were screened for relevance by title and abstract by 2 independent reviewers (C. P. and R. H.). Relevant articles were then read to determine eligibility in duplicate (C. P. and R. H.). Disagreements were resolved by consensus.
Quality Assessment
Study quality was assessed by 2 independent reviewers (C. P. and Y. L.) using the Cochrane risk-of-bias tool for randomized trials (RoB 2) and the Joanna Briggs Institute checklist for cohort studies. Disagreements were resolved by consensus. Publication bias was assessed using Doi plots and the LFK index (Supplementary Figure 1) [9].
Data Extraction
Studies that met the inclusion criteria underwent data extraction using a standardized form and protocol by 2 independent reviewers (C. P. and R. H.). When data at multiple time points were reported, data at the latest time point within the acute treatment period (≤8 weeks) were abstracted. A detailed list of the data extracted is included in the Supplementary Methods.
Meta-Analysis
Only treatment arms with ≥20 patients were eligible for meta-analysis. However, in studies with multiple arms of the same therapy at different dosages, data were pooled if the total number of patients was ≥20. We conducted 2 types of meta-analyses to arrive at pooled estimates of clinical and radiologic response to treatment, mortality, and treatment discontinuation due to toxicity using the metafor [10] and meta [11] packages in R. First, we used a random-effects 1-step generalized linear mixed-effects model for proportions. Pooled proportion estimates were compared between TMP-SMX and pyrimethamine-containing regimens by multivariate meta-regression and were compared between observational and RCT studies by the Q-test [12]. Second, we conducted a restricted maximum likelihood meta-analysis for the RCTs, allowing for direct comparisons.
Sensitivity Analysis
We conducted a sensitivity analysis for studies specifically reporting TE-related mortality. Leave-one-out meta-analyses were performed to investigate the impact of individual studies on overall estimates. Univariate meta-regression was used to determine whether year of publication (a surrogate for ART availability), sex, and age were associated with the outcomes of interest for each therapy, when data were available from ≥10 studies.
RESULTS
Search Results
The search returned 4979 results (Figure 1). After duplicates were removed, 3946 unique results remained for screening by title/abstract, of which 3865 were excluded. Among the 81 articles eligible for full-text screening, 49 were excluded. The remaining 32 articles were included and consisted of 14 retrospective studies [13–26], 9 prospective studies [27–35], 5 RCTs [36–40], 3 single-arm trials [41–43], and 1 dose-finding study [44] (Table 1, Supplementary Table 2).
PRISMA (Preferred Reporting Items for Systematic Reviews and Meta-Analyses) diagram. Abbreviation: RCT, randomized controlled trial.
Study Characteristics
| Author (Year) | Study Type | Location(s) | Treatment Arm(s) | Acute Therapy End Point Timing, Wks |
|---|---|---|---|---|
| RCT/Dose-Escalation Studies | ||||
| Chirgwin [36] (2002) | RCT | United States, France | Atovaquone + Pyrimethamine vs Atovaquone + Sulfadiazine | 6 |
| Dannemann [37] (1992) | RCT | United States, France, Belgium | P-S vs P-C | 6 |
| Jacobson [44] (2001) | Dose-escalation | United States | Pyrimethamine + Azithromycin at high, moderate, and low dose | 6 |
| Katlama [38] (1996) | RCT | Belgium, France, Denmark, Italy, Netherlands, Portugal, Spain, Switzerland | P-S vs P-C | 6 |
| Kongsaengdao [39] (2008) | RCT | Thailand | P (low dose)-S vs P (high dose)-S vs TMP-SMX | 6 |
| Torre [40] (1998) | RCT | Italy | P-S vs TMP-SMX | 30 d |
| Cohort: TMP-SMX | ||||
| Arens [14] (2007) | Retrospective | South Africa | TMP-SMX | Not reported |
| Beraud [27] (2009) | Prospective | Martinique | TMP-SMX | 2 |
| Canessa [29] (1992) | Prospective | Italy | TMP-SMX | 2-4 |
| Francis [30] (2004) | Prospective | South Africa | TMP-SMX | 2-4 |
| Pellegrino [42] (2019) | Single-arm trial | Brazil | TMP-SMX | 2 |
| Smadja [34] (1998) | Prospective | Martinique | TMP-SMX | 15 d |
| Torre [25] (1998) | Retrospective | Italy | TMP-SMX | 4 |
| Cohort: P-S | ||||
| Antinori [13] (1992) | Retrospective | Italy | P-S | 6-8 |
| Bouree [28] (1997) | Prospective | Martinique | P-S | 4 |
| Carrazana [15] (1989) | Retrospective | United States | P-S | 2 |
| Cohn [16] (1989) | Retrospective | United States | P-S | 2-4 |
| Ferrer [17] (1996) | Retrospective | Spain | P-S | 4-6 |
| Gervasoni [18] (1995) | Retrospective | Italy | P-S | 6, but 15 d for clinical and radiologic response |
| Gonzalez-Clemente [31] (1990) | Prospective | Spain | P-S | 3-6 |
| Grunitzky [20] (1995) | Retrospective | Togo | P-S | 6 |
| Kodym [32] (2015) | Prospective | Czech Republic | P-S | 6 |
| Leport [21] (1988) | Retrospective | France | P-S | 8 |
| Pedrol [33] (1990) | Prospective | Spain | P-S | 2-35 d |
| Porter [23] (1992) | Retrospective | United States | P-S | 6 |
| Van Delden [26] (1996) | Retrospective | Switzerland | P-S | 30 d |
| Vidal [35] (2005) | Prospective | Brazil | P-S | 6 for clinical response and all-cause mortality and 2 for radiological response |
| Cohort: P-C | ||||
| Luft [41] (1993) | Single-arm trial | France, Switzerland, United States | P-C | 6 |
| Ruf [24] (1991) | Retrospective | Germany | P-C vs P-C + Spiramycin | 3 |
| Cohort: Other Regimens | ||||
| Goswami [19] (2014) | Retrospective | India | TMP-SMX + Clindamycin | 2 for clinical/radiological response and 4-6 for death |
| Liu [22] (2018) | Retrospective | China | TMP-SMX + Azithromycin | 6 |
| Torres [43] (1997) | Single-arm trial | United States, Canada | Atovaquone | 6 |
Abbreviations: P-C, pyrimethamine and clindamycin; P-S, pyrimethamine and sulfadiazine; RCT, randomized controlled trial; TMP-SMX, trimethoprim-sulfamethoxazole.
Quality Assessment
RoB 2 assessments revealed a low risk of bias in 3, some concerns in 1, and a high risk of bias in 2 (Supplementary Figure 2). Among observational studies (Supplementary Table 3), the predominant quality concerns were unclear diagnostic criteria for TE and insufficient information on the definition of clinical and radiological response. Publication bias was suggested for all drugs in each outcome (Supplementary Figure 1).
Population Characteristics
A total of 1959 patients treated for TE were identified by this systematic review: 535 from RCTs and 1424 from cohort studies. Study size ranged from 20 to 299 participants (Table 2). None included patients with immunosuppressive conditions other than HIV, and most were conducted before the widespread availability of ART, including all of the comparative RCTs eligible for meta-analysis [37, 38, 40]. The studies were largely conducted on young (mean age range: 30–40 years) males (81.3%).
Study Outcome Data
| Author (Year) | Study Arm(s) (Dose) | N | Duration of Acute Treatment, Wks | Male, N (%) | Mean Age (Standard Deviation), Y | Corticosteroids, N (%) | Clinical Response, N (%) | Radiographic Response, N (%) | Discontinued Due to Toxicity, N (%) | All-Cause Mortality, N (%) | Adverse Events, N (%) |
|---|---|---|---|---|---|---|---|---|---|---|---|
| Randomized controlled trial | |||||||||||
| Chirgwin [36] (2002) | Atovaquone (3 g/d) +Pyrimethamine (200 mg loading dose, followed by 75 mg/d if >60 kg and 50 mg/d if <60 kg) + Folinic Acid (10 mg/d) | 28 | 6 | 22 (78.6) | Median: 35 | NR | 22 (78.6) | 21 (75.0) | NR | NR | NRa |
| Atovaquone (3 g/d) + Sulfadiazine (6 g/d) | 12 | 6 | 10 (83.3) | Median: 37 | NR | 9 (75.0) | 9 (75.0) | NR | NR | NRa | |
| Dannemann [37] (1992) | Pyrimethamine (200 mg loading dose, followed by 75 mg/d) + Sulfadiazine (100 mg/kg/d, up to 8 kg/d) + Folinic Acid (10 mg/d) | 33 | 6 | 29 (87.9) | 36 (9) | NR | 23 (69.7) | 20 (60.6) | 11 (30.6) | 2 (6.1) | NRb |
| Clindamycin (4.8 g/d for 3 weeks, 1.2 g/d or 1.35 g/d up to 6 wks) + Pyrimethamine (200 mg loading dose, followed by 75 mg/d) + Folinic Acid (10 mg/d) | 26 | 6 | 21 (80.8) | 36 (8) | NR | 17 (65.4) | 19 (73.1) | 6 (23.1) | 5 (19.2) | NRb | |
| Jacobson [44] (2001) | Azithromycin (900 mg/d) + Pyrimethamine (200 mg loading dose, then 50 mg/d for 3 wks, followed by 25 mg/d for 3 wks if a partial or complete radiological or clinical response was achieved) + Folinic Acid (5 mg/d) | 9c | 6 | NR | NR | NR | 6 (66.7) | 6 (66.7) | NR | 0 (0.0) | NRa |
| Azithromycin (1.2 g/d) + Pyrimethamine (200 mg loading dose, then 50 mg/d for 3 wks, followed by 25 mg/d for 3 wks if a partial or complete radiological or clinical response was achieved) + Folinic Acid (5 mg/d) | 17c | 6 | NR | NR | NR | 12 (70.6) | 12 (70.6) | NR | 1 (5.9) | NRa | |
| Azithromycin (1.5 g/d) + Pyrimethamine (200 mg loading dose, then 50 mg/d) + Folinic Acid (5 mg/d) | 4c | 6 | NR | NR | NR | 2 (50.0) | 2 (50.0) | NR | 0 (0.0) | NRa | |
| Katlama [38] (1996) | Pyrimethamine (50 mg/d) + Sulfadiazine (4 g/d) + Folinic Acid (at least 50 mg/wk) | 147 | 6 | 129 (87.8) | 33 (8) | NR | 112 (76.2) | 117 (79.6) | 44 (29.9) | 22 (15.0) | Rash or fever: 58 (39.5) Neutropenia: 42 (28.6) Hepatotoxicity: 20 (13.6) Anemia: 18 (12.2) Thrombocytopenia: 11 (7.5) Diarrhea: 8 (5.4) Crystalluria: 5 (3.4) Nephrotoxicity: 2 (1.4) Nausea/Vomiting: 2 (1.4) |
| Clindamycin (2.4 g/d) + Pyrimethamine (50 mg/d) + Folinic Acid (at least 50 mg/wk) | 152 | 6 | 133 (87.5) | 34 (9) | NR | 103 (67.8) | 110 (72.4) | 17 (11.2) | 29 (19.1) | Rash or fever: 44 (28.9) Neutropenia: 38 (25.0) Diarrhea: 29 (19.1) Anemia: 11 (7.2) Hepatotoxicity: 9 (5.9) Nausea/Vomiting: 7 (4.6) Thrombocytopenia: 3 (2.0) Nephrotoxicity: 1 (0.7) Crystalluria: 0 (0.0) | |
| Kongsaengdao [39] (2008) | Pyrimethamine (50 mg/d) + Sulfadiazine (4 g/d) + Folinic Acid (25 mg/d) | 10 | 6 | 7 (70.0) | 39.6 (9.4) | 6 (60.0) | NR | NR | 3 (30.0) | 0 (0.0) | Severe rash: 2 (20.0) Steven-Johnson syndrome: 1 (10.0) Pancytopenia: 0 (0.0) Thrombocytopenia: 0 (0.0) |
| Pyrimethamine (100 mg/d) + Sulfadiazine (4 g/d) + Folinic Acid (25 mg/d) | 10 | 6 | 8 (80.0) | 38.2 (9.3) | 6 (60.0) | NR | NR | 2 (20.0) | 1 (10.0) | Severe rash: 2 (20.0) Pancytopenia: 1 (10.0) Thrombocytopenia: 1 (10.0) Steven-Johnson syndrome: 0 (0.0) | |
| Trimethoprim (10 mg/kg/d) + Sulfamethoxazole (50 mg/kg/d) | 10 | 6 | 4 (40.0) | 34.2 (10.7) | 6 (60.0) | NR | NR | 0 (0.0) | 3 (30.0) | Severe rash: 0 (0.0) Steven-Johnson syndrome: 0 (0.0) Pancytopenia: 0 (0.0) Thrombocytopenia: 0 (0.0) | |
| Torre [40] (1998) | Pyrimethamine (50 mg/d) + Sulfadiazine (60 mg/kg/d) + Folinic Acid (10 mg/d) | 37 | 30 d | 29 (78.4) | 32.4 (4.5) | 33 (89.2) | 30 (81.1) | 23 (62.2) | NR | 0 (0.0) | NRa |
| Trimethoprim (10 mg/kg/d) + Sulfamethoxazole (50 mg/kg/d) | 40 | 30 d | 28 (70.0) | 34.0 (6.4) | 35 (87.5) | 31 (77.5) | 27 (67.5) | NR | 0 (0.0) | NRa | |
| Cohort: trimethoprim-sulfamethoxazole | |||||||||||
| Arens [14] (2007) | Trimethoprim + Sulfamethoxazole (doses not reported) | 25 | NR | 9 (36.0) | Median, 31 (IQR, 27–34) | 18 (72.0) | 11 (44.0) | NR | NR | 4 (16.0) | Nephrotoxicity: 0 (0.0) Hepatotoxicity: 0 (0.0) |
| Beraud [27] (2009) | Trimethoprim (10–15 mg/kg/d for 3–5 d until clinical improvement, then stepped down to 7.5 mg/kg/d) + Sulfamethoxazole (50–75 mg/kg/d for 3–5 d until clinical improvement, then stepped down to 37.5 mg/kg/d) | 83 | 4–6 | 56 (67.5) | 39.8 (11.0) | 14 (16.9) | 77 (92.8) | 71 (85.5) | 6 (7.2) | 2 (2.4) | Rash: 7 (8.4) Neutropenia: 6 (7.2) Pancreatitis: 2 (2.4) Hepatotoxicity: 1 (1.2) Nephrotoxicity: 1 (1.2) Thrombocytopenia: 1 (1.2) |
| Canessa [29] (1992) | Trimethoprim (6.6 mg/kg/d) + Sulfamethoxazole (33.3 mg/kg/d) + Folinic Acid (15 mg/d) | 12 | 2–4 | 9 (75.0) | Median, 30 (IQR, 26–37.5) | NR | 9 (75.0) | 9 (75.0) | 1 (8.3) | Unclear | Rash: 2 (16.7) Leukopenia: 2 (16.7) |
| Trimethoprim (20 mg/kg/d) + Sulfamethoxazole (100 mg/kg/d) + Folinic Acid (15 mg/d) | 12 | 2–4 | 10 (83.3) | Median, 28.5 (IQR, 26.5–37) | NR | 9 (75.0) | 9 (75.0) | 0 (0.0) | 0 (0.0) | Rash: 1 (8.3) Leukopenia: 0 (0.0) | |
| Francis [30] (2004) | Trimethoprim (640 mg/d) + Sulfamethoxazole (3.2 g/d) | 20 | 4 | 10 (50.0) | 32 (NR) | NR | 20 (100.0) | 20 (100.0) | NR | 0 (0.0) | NR |
| Pellegrino [42] (2019) | Trimethoprim (10 mg/kg/d) + Sulfamethoxazole (50 mg/kg/d) | 46 | 6 | 23 (50.0) | 35 (NR) | 36 (78.3) | 39d (84.8) | 39d (84.8) | 2 (4.3) | 0 (0.0) | Rash: 3 (6.5) Dizziness and tachycardia: 1 (2.2) Electrolyte abnormalities and nephrotoxicity: 1 (2.2) |
| Smadja [34] (1998) | Trimethoprim (640 mg/d for 2 d, then 480 mg/d for 15 d, then in cases of efficacy, 320 mg/d until cure) + Sulfamethoxazole (3.2 g/d for 2 d, then 2.4 g/d for 15 d, then in cases of efficacy, 1.6 g/d until cure) | 21 | 21–67 d | NR | NR | NR | 19d (90.5) | 19d (90.5) | 2 (9.5) | NR | NRd |
| Torre [25] (1998) | Trimethoprim (10 mg/kg/d) + Sulfamethoxazole (50 mg/kg/d) + Folinic Acid (15 mg/d) | 71 | 4 | 58 (81.7) | 30.5 (4.9) | 61 (85.9) | 62 (87.3) | 50 (70.4) | 7 (9.9) | 8 (11.3) | Rash: 22 (31.0) |
| Cohort: pyrimethamine and sulfadiazine | |||||||||||
| Antinori [13] (1992) | Pyrimethamine (50–75 mg/d) + Sulfadiazine (4–6 g/d) | 29 | 6–8 | 21 (72.4) | 33.8 (6.1) | NR | 22 (75.9) | 18 (62.1) | 10 (34.5) | NR | Rash: 24 (82.8) Anemia: 12 (41.4) Neutropenia: 10 (34.5) Renal failure: 2 (6.9) |
| Bouree [28] (1997) | Pyrimethamine (100 mg/d) + Sulfadiazine (6 g/d) + Folinic Acid (50 mg/d) | 60 | NR | 46 (76.7) | 40.3 (range, 23–69) | NR | NR | NR | NR | 13 (21.7) | NRa |
| Carrazana [15] (1989) | Pyrimethamine (100 mg loading dose for 2–3 d, followed by 50 mg/d) + Sulfadiazine (4 g/d) + Folinic Acid (5–15 mg/d) | 24 | NR | NR | NR | 14 (58.3) | 16 (66.7) | 16 (66.7) | 6 (25.0) | 3 (12.5) | NRe |
| Cohn [16] (1989) | Pyrimethamine (25 mg/d) + Sulfadiazine (4–6 g/d) | 36 | NR | NR | NR | NR | 26 (72.2) | 26 (72.2) | NR | NR | NRa |
| Ferrer [17] (1996) | Pyrimethamine (50–75 mg/d) + Sulfadiazine (4 g/d) + Folinic Acid (15 mg/d) | 61 | 4–6 | NR | NR | 55 (90.2) | NR | NR | 14 (23.0) | 5 (8.2) | NR |
| Gervasoni [18] (1995) | Pyrimethamine (100 mg/d loading dose for 3 d, followed by 50–75 mg/d) + Sulfadiazine (4–6 g/d) | 133 | ≥6 | NR | NR | NR | 123 (92.5) | 123 (92.5) | 41 (30.8) | 2 (1.5) | NR |
| Gonzalez-Clemente [31] (1990) | Pyrimethamine (50–100 mg loading dose, followed by 25–50 mg/d) + Sulfadiazine (75 mg/kg/d) + Folinic Acid (10–20 mg/d) | 53 | 3–6 | NR | NR | NR | NR | NR | 14 (26.4) | 8 (15.1) | NRc |
| Grunitzky [20] (1995) | Pyrimethamine (75–100 mg/d) + Sulfadiazine (6–8 g/d) | 23 | 6 | 19 (82.6) | 36 (range, 16–52 | NR | 23 (100) | NR | NR | 0 (0.0) | NR |
| Kodym [32] (2015) | Pyrimethamine (200 mg loading dose, followed by 75–100 mg/d) + Sulfadiazine (1.5 g/d) + Folinic Acid (dose not specified) | 21 | >6 | 19 (90.0) | 40.2 (range, 24.7–61.2) | NR | NR | NR | NR | 7 (33.3) | NR |
| Leport [21] (1988) | Pyrimethamine (100–200 mg/d loading dose for 1–2 d, then 50–100 mg/d) + Sulfadiazine (2–6 g/d) + Folinic Acid (5–50 mg/d, adjusted based on complete blood count) | 35 | Mean 8 Range 2–39 | 34 (97.1) | 37.0 (9.9) | NR | 31 (88.6) | 31 (88.6) | NR | 4 (11.4) | NRa |
| Pedrol [33] (1990) | Pyrimethamine (50–75 mg loading dose followed by 25 mg/d) + Sulfadiazine (75 mg/kg/d) + Folinic Acid (10–20 mg/d) | 40 | 3 | NR | NR | NR | NR | NR | 12 (30.0) | 6 (15.0) | NR |
| Porter [23] (1992) | Pyrimethamine (25–100 mg/d) + Sulfadiazine (2–6 g/d) | 115f | >6 | 110 (95.7) | 38 (9.8) | NR | 96 (83.5) | 81 (70.4) | 43 (37.4) | 6 (5.2) | Rash: 42 (36.5) Leukopenia: 17 (14.8) Nausea/Vomiting: 14 (12.2) Fever: 5 (4.3) Thrombocytopenia: 4 (3.5) Diarrhea: 2 (1.7) |
| Van Delden [26] (1996) | Pyrimethamine (dose not reported) + Sulfadiazine (dose not reported) + Folinic Acid (in 118/130 patients, dose not reported) | 130 | NR | NR | NR | NR | 83c (63.8) | NR | NR | 6 (4.6) | NR |
| Vidal [35] (2005) | Pyrimethamine + Sulfadiazine (doses not reported) | 55 | NR | 33 (60.0) | 36 (NR) | NR | 48 (87.3) | 51 (92.7) | NR | 7 (12.7) | NR |
| Cohort: pyrimethamine and clindamycin | |||||||||||
| Luft [41] (1993) | Clindamycin (2.4 g/d) + Pyrimethamine (200 mg loading dose, then 75 mg/d) + Folinic acid (10 mg/d) | 49 | 6 | 43 (87.8) | Median, 35 | 14 (28.6) | 35 (71.4) | 37 (75.5) | 8 (16.3) | 1 (2.0) | NRd |
| Ruf [24] (1991) | Clindamycin (2.4 g/d) + Pyrimethamine (1.5 mg/kg/d) + Spiramycin (9 × 10⁶ IU/d) + Folinic Acid (45 mg/d) | 25 | 3 | NR | NR | NR | 23 (92.0) | 23 (92.0) | NR | 2 (8.0) | NRg |
| Clindamycin (2.4 g/d) + Pyrimethamine (50 mg/d if patient <65 kg and 75 mg/d if >65 kg) + Folinic Acid (45 mg/d) | 26 | 3 | NR | NR | NR | 24 (92.3) | 24 (92.3) | NR | 2 (7.7) | NRg | |
| Cohort: other regimens | |||||||||||
| Goswami [19] (2014) | Trimethoprim (20 mg/kg/d) + Sulfamethoxazole (100 mg/kg/d) + Clindamycin (1.8 g/d) | 25 | 4–6 | 19 (76.0) | 33.4 (7.4) | NR | 22 (88.0) | 22 (88.0) | 0 (0.0) | 3 (12.0) | Neutropenia: 3 (12.0) Rash: 2 (8.0) Diarrhea: 1 (4.0) Febrile neutropenia: 0 (0.0) Steven-Johnson syndrome: 0 (0.0) Severe Thrombocytopenia and bleeding: 0 (0.0) |
| Liu [22] (2018) | Trimethoprim (16.7 mg/kg/d) + Sulfamethoxazole (83.3 mg/kg/d) + Azithromycin (500 mg/d) | 57 | 6 | 47 (82.5) | 41.4 (11.8) | NR | 48 (84.2) | NR | 0 (0.0) | 9 (15.8) | Gastrointestinal reaction: 6 (10.5) |
| Torre [43] (1997) | Atovaquone (3 g/d) | 87 | 6 | NR | NR | 46 (52.9) | 45 (51.7) | 32 (36.8) | NR | 3 (3.5) | NRa |
Abbreviations: IQR, interquartile range; NR, not reported or unclear.
Adverse events were only reported for maintenance therapy.
Adverse events were only reported based on the treatment received at the time, not the assigned treatment.
Only adverse events deemed attributable to the treatment were reported.
Only adverse events that led to treatment discontinuation were reported.
Reported adverse events include patients who were toxoplasmic encephalitis–negative by stereotactic biopsy.
One patient was not initially treated with pyrimethamine and sulfadiazine.
Not reported for each arm separately.
Treatments Investigated
Of the cohort treatment arms eligible for meta-analysis, there were 14 studies of P-S [13, 15–18, 20, 21, 23, 26, 28, 31–33, 35], 2 of P-C [24, 41], 7 of TMP-SMX [14, 25, 27, 29, 30, 34, 42], and 1 each of TMP-SMX and clindamycin [19], TMP-SMX and azithromycin [22], P-C and spiramycin [24], and atovaquone monotherapy [43] (Table 2).
Of the 5 RCTs, 1 study compared atovaquone and pyrimethamine to atovaquone and sulfadiazine [36], 2 studies compared P-S to P-C [37, 38], and 2 studies compared P-S to TMP-SMX [39, 40]. The single dose-escalation study compared different strengths of azithromycin combinations with pyrimethamine [44]. For reference, we have summarized the American SOT [4] and HIV [7] guidelines on the treatment of TE (Supplementary Table 4).
Clinical Response
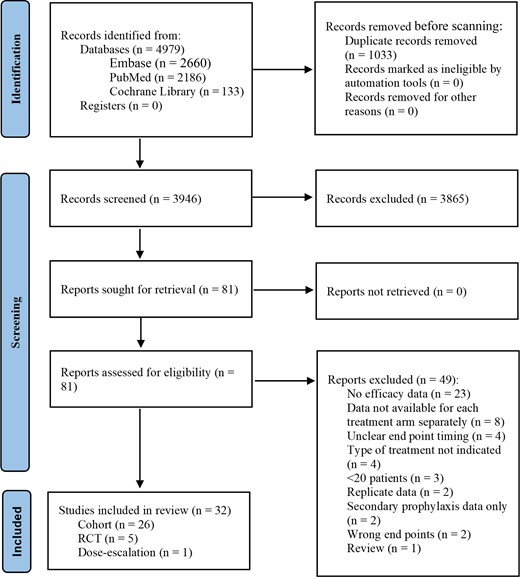
The pooled proportion of clinical response to treatment (Figure 2) was 84.9% (95% confidence interval [CI], 72.9–92.1; I2 = 75.6%) for TMP-SMX, 81.2% (95% CI, 74.4–86.6; I2 = 72.2%; P = .66 vs TMP-SMX) for P-S, and 72.1% (95% CI, 59.3–82.1; I2 = 46.5%; P = .27 vs TMP-SMX) for P-C. There were no statistically significant differences between observational and RCT estimates. The relative risks (RRs) of clinical response in comparative RCTs (Supplementary Figure 3A) were 1.12 (95% CI, .98–1.27; I2 = 0.0%) for P-S vs P-C and 1.05 (95% CI, .83–1.31; I2 = NA) for P-S vs TMP-SMX.
Pooled percentage of patients who experienced partial or complete clinical improvement stratified by study type treated with TMP-SMX (A), P-S (B), P-C (C), and alternative treatments (D). Abbreviations: CI, confidence interval; P-C, pyrimethamine and clindamycin; P-S, pyrimethamine and sulfadiazine; RCT, randomized controlled trial; TMP-SMX, trimethoprim-sulfamethoxazole.
Radiologic Response
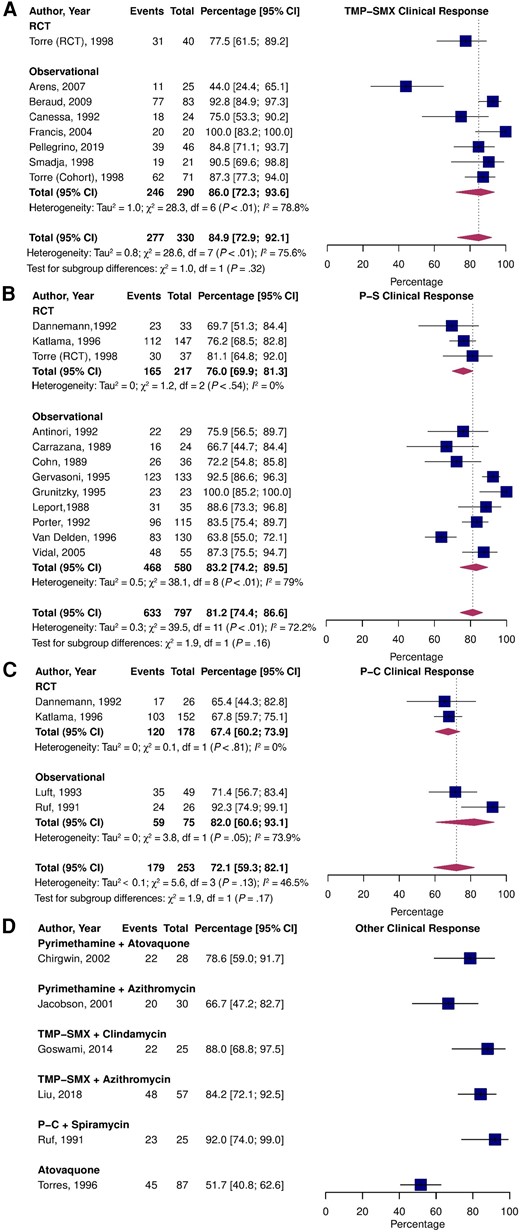
The pooled proportion estimates of radiologic response to treatment were 82.1% (95% CI, 72.8–88.7; I2 = 43.3%) for TMP-SMX, 77.6% (95% CI, 68.2–84.8; I2 = 78.7%; P = .56 vs TMP-SMX) for P-S, and 75.1% (95% CI, 69.4–80.0%; I2 = 26.7%; P = .70 vs TMP-SMX) for P-C (Figure 3). There were no significant differences between observational and RCT estimates for P-S and P-C; however, radiologic response was higher in observational studies vs RCT data for TMP-SMX (P = .04). The RRs for improved radiologic response in direct RCT comparisons were 1.01 (95% CI, .78–1.30; I2 = 52.1%) for P-S vs P-C and 0.92 (95% CI, .66–1.28; I2 = NA) for P-S vs TMP-SMX (Supplementary Figure 3B).
Pooled percentage of patients who experienced partial or complete radiologic improvement stratified by study type treated with TMP-SMX (A), P-S (B), P-C (C), and alternative treatments (D). Abbreviations: CI, confidence interval; P-C, pyrimethamine and clindamycin; P-S, pyrimethamine and sulfadiazine; RCT, randomized controlled trial; TMP-SMX, trimethoprim-sulfamethoxazole.
Mortality
The pooled prevalence of all-cause mortality (Figure 4) was 2.3% (95% CI, .4–12.5; I2 = 9.3%) for TMP-SMX, 8.3% (95% CI, 5.3–12.8; I2 = 60.5%; P = .24 vs TMP-SMX) for P-S, and 10.5% (95% CI, 4.5–22.7; I2 = 58.1%; P = .20 vs TMP-SMX) for P-C. Pooled all-cause mortality was not significantly different between RCTs and observational studies for TMP-SMX and P-S but was higher in the RCTs for P-C (P < .01). In a direct comparison of RCT data, the RR for all-cause mortality was 0.68 (95% CI, .35–1.31; I2 = 16.1%) for P-S vs P-C (Supplementary Figure 3C). No deaths occurred in the P-S vs TMP-SMX trial; therefore, a RR could not be computed.
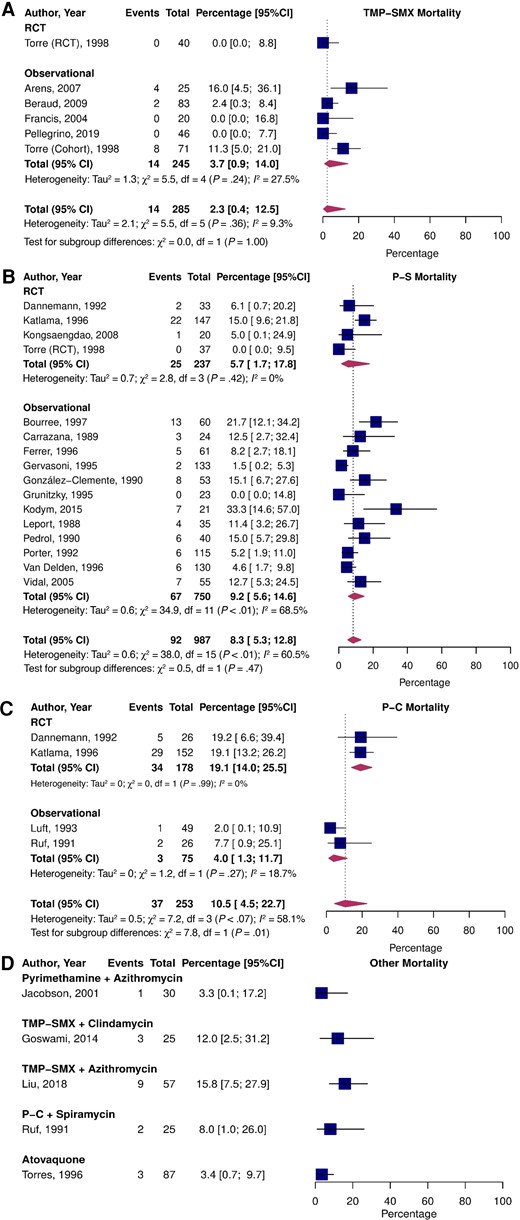
Pooled percentage of patients who experienced all-cause death stratified by study type treated with TMP-SMX (A), P-S (B), P-C (C), and alternative treatments (D). Abbreviations: CI, confidence interval; P-C, pyrimethamine and clindamycin; P-S, pyrimethamine and sulfadiazine; RCT, randomized controlled trial; TMP-SMX, trimethoprim-sulfamethoxazole.
Discontinuation and Safety
The pooled estimate of treatment discontinuation due to toxicity was significantly lower for participants who received TMP-SMX (7.3%; 95% CI, 4.7–11.4; I2 = 0.0%) than P-S (30.5%; 95% CI, 27.1–34.2; I2 = 0.0%; P < .01 vs TMP-SMX) or P-C (13.7%; 95% CI, 9.8–18.8; I2 = 32.0%; P = .031 vs TMP-SMX; Figure 5). There were no significant differences in discontinuation due to toxicity between RCTs and observational studies. The comparative RCT data revealed a higher risk of treatment discontinuation due to toxicity in P-S than P-C (RR = 2.17; 95% CI, 1.22–3.85; I2 = 32.4%; Supplementary Figure 3D). Treatment discontinuation within the acute treatment phase was not reported in the P-S vs TMP-SMX RCT [40].
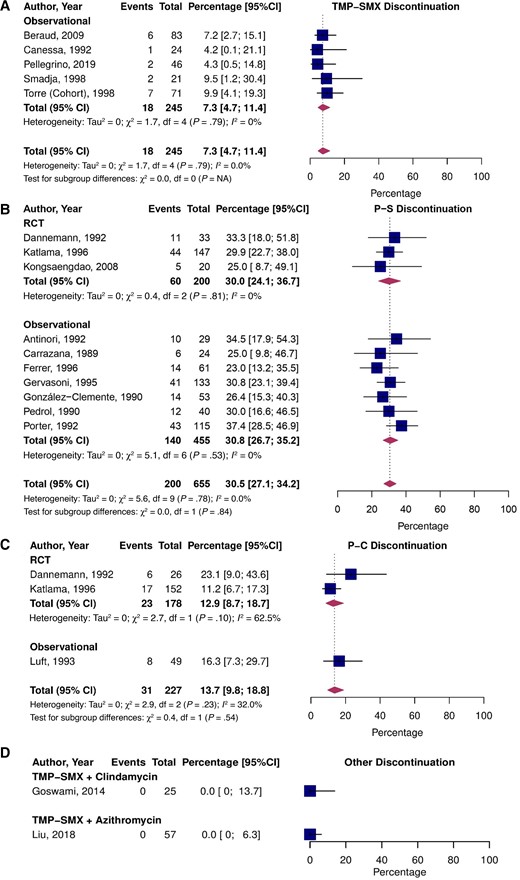
Pooled percentage of patients who experienced treatment discontinuation due to toxicity stratified by study type treated with TMP-SMX (A), P-S (B), P-C (C), and alternative treatments (D). Abbreviations: CI, confidence interval; NA, not applicable; P-C, pyrimethamine and clindamycin; P-S, pyrimethamine and sulfadiazine; RCT, randomized controlled trial; TMP-SMX, trimethoprim-sulfamethoxazole.
Adverse events within the acute treatment period were reported in 11 studies (Table 2). Rashes were the most common adverse event across all treatment groups and were reported in 0%–31% of patients on TMP-SMX, 20%–83% on P-S, and 29% on P-C. Hematologic toxicity was reported in 0%–17% of patients on TMP-SMX, 0%–41% on P-S, and 25% on P-C. Hepatotoxicity occurred in 0%–1% of patients on TMP-SMX, 13.6% on P-S, and 5.9% on P-C. Nephrotoxicity developed in 0%–2% of patients on TMP-SMX, 1%–7% on P-S, and 1% on P-C.
Sensitivity Analyses
Pooled estimates of studies specifically reporting TE-related mortality were 3.1% (95% CI, 1.5–6.0; I2 = 0.0%; fixed-effects) for TMP-SMX, 4.3% (95% CI, 2.6–7.1; I2 = 0.0%; P = .61 vs TMP-SMX) for P-S, and 7.1% (95% CI, 1.3–30.1; I2 = 78.6%; P = .26 vs TMP-SMX) for P-C (Supplementary Figure 4).
Leave-one-out analyses revealed that most studies had similar effects on overall estimates of each outcome (Supplementary Figures 5–8). However, Luft et al [41] substantially reduced the all-cause mortality estimate of P-C.
Meta-regression analyses found that the year of publication, sex, and age were not significantly associated with mortality on P-S (Supplementary Figure 9), nor was the year of publication significantly associated with clinical response to P-S (Supplementary Figure 10).
Treatment Duration and Dose
Duration of acute therapy in the included articles ranged from 2 to 8 weeks, and no studies compared outcomes between different durations (Table 2). Similarly, doses were variable between studies. Pyrimethamine doses ranged from 25-100 mg/day, often beginning with a 100–200 mg/day loading dose. Doses of sulfadiazine ranged from 1.5-8 g/day. Clindamycin was given in doses of 1.8–4.8 g/day, and TMP-SMX was dosed at 40–120 mg/kg/day (1:5 ratio of TMP:SMX). Three of the articles had multiple treatment arms with different doses; however, all were insufficiently powered for comparisons [29, 39, 44].
Adjunctive Therapies
The role of adjunct corticosteroids in the treatment of TE is unclear [7]. Ten of the studies identified by our systematic review reported adjunct corticosteroid use in 16.9%–90.2% of patients (Table 2). Of these studies, 3 performed subgroup analyses comparing outcomes and safety as a function of adjunct corticosteroid treatment, and no significant differences were detected [14, 25, 41]. Concomitant folinic acid treatment is recommended with pyrimethamine-containing therapies to reduce hematologic toxicity, and most studies reported its use (5–50 mg/day) [7].
Ongoing Studies
We identified 3 ongoing studies (Supplementary Table 5). First is an RCT on optimizing ART reinitiation following treatment for TE and comparing TMP-SMX and azithromycin vs TMP-SMX, sulfadiazine, and clindamycin (ChiCTR1900021195). Second is a single-arm study of P-S in the treatment of toxoplasmosis, including TE, in patients without HIV (JPRN-UMIN000029112/JPRN-jRCTs071180095). Third is an RCT investigating adjunctive dexamethasone with P-C or TMP-SMX and clindamycin in patients with HIV (NCT04341155).
DISCUSSION
We conducted an extensive review of observational and RCT evidence on treatments for TE and found that TMP-SMX had similar efficacy for clinical response, radiologic response, and mortality, with a reduced risk of discontinuation due to toxicity compared with pyrimethamine-containing regimens.
HIV guidelines recommend P-S as first-line therapy for TE [7]. Supporting evidence that is cited is based on 2 RCTs [37, 38] and 2 noncomparative observational studies [21, 41]. In the first RCT, Katlama et al [38] found that in acute therapy (at 6 weeks), clinical response was not significantly different between P-S and P-C. Although the crossover rate was similar between the 2 arms, patients assigned to P-S and P-C were more likely to crossover due to treatment toxicity and treatment failure, respectively. In patients who continued therapy as secondary prophylaxis, P-S was superior to P-C in preventing TE relapses, but overall survival did not differ. While P-S had superior efficacy as secondary prophylaxis against TE, this RCT was conducted before the widespread availability of ART, which reduces both the duration of maintenance therapy and incidence of TE [2, 7]. Consequently, the superior efficacy of P-S as a maintenance therapy is likely no longer relevant, particularly since TMP-SMX can also be given as secondary prophylaxis [3]. In the second RCT by Dannemann et al [37], survival at 6 weeks was not significantly different between P-S and P-C. In our meta-analysis, we found no significant differences in clinical and radiologic response or mortality between P-S or P-C, but there was a higher risk of treatment discontinuation due to toxicity with P-S. This is consistent with prior meta-analyses of these trials [45, 46].
TMP-SMX is recommended in the American HIV guidelines as an alternative therapy for TE when pyrimethamine is inaccessible [7]. In support of this recommendation, the guidelines reference 1 RCT [40] and 1 noncomparative cohort study [27]. The RCT [40] included 77 patients and compared a 4-week regimen of P-S to TMP-SMX. This study found no significant differences in the clinical or radiologic response to treatment or mortality between the 2 groups, but adverse events were more frequent in the P-S group [40]. Similarly, our findings demonstrate a higher risk of treatment discontinuation due to toxicity in P-S vs TMP-SMX, but a similar efficacy.
The guideline-recommended duration for acute therapy of 6 weeks or longer depending on disease response and severity [7] is based on 4 observational studies [41, 47–49]. Three of them had fewer than 10 patients in each arm [47–49]. The final study treated 49 patients with P-C for 6 weeks, and all patients who experienced a clinical response (71.4%) did so by day 30 of treatment [41]. Our systematic review found heterogeneity in the duration of treatment regimens and a lack of comparative studies. We also identified wide variability in dosing, which may explain why the guidelines opted not to cite evidence for the dosing of TE therapies [7]. Therefore, we recommend that future studies address this paucity of data.
Overall, evidence for the treatment of TE is solely based on studies of young men with HIV and predates ART, with most studies performed 25–30 years ago. However, a recent American epidemiological study from 2011–2017 reported that of 1537 hospital visits for TE, 35% were female, 25% did not have HIV, and the mean age was 44.8 years [50]. Therefore, there is value in a modern RCT for answering numerous questions related to the treatment of this neglected disease.
Our study is not the only systematic review on this topic; however, it adds significantly to prior studies [45, 46] and has numerous strengths. We used a more exhaustive search strategy that was not limited to persons with HIV and also included single-arm studies. Furthermore, we reviewed the evidence on the dose, duration, and role of adjunctive therapies in treating TE. However, our systematic review and meta-analysis are subject to several limitations. Due to the limited number of RCTs conducted on TE treatments, we chose a priori to include observational studies in our meta-analysis, which are more vulnerable to bias. However, given the paucity of RCT data, we feel this provided a more comprehensive analysis, and analyses limited to the RCTs were largely consistent with the overall estimates. Additional limitations include the inherent limitations of the included original studies such as variability in diagnostic criteria and variable definitions of response to treatment between studies. Our meta-analysis pooled data across different doses, treatment durations, and proportions of adjunct corticosteroid usage, which may also contribute to heterogeneity. Finally, heterogeneity in the reporting of adverse events precluded meta-analysis of this data. Nonetheless, we believe our analysis provides a summary of the best available evidence for each treatment, pending new data.
Although P-S and P-C are the guideline-recommended therapies for TE, the recent 5000% increase in price of pyrimethamine has made access to treatment difficult in many settings. As such, many centers have transitioned to TMP-SMX as the initial therapy for TE [8]. In addition to less toxicity and similar efficacy, TMP-SMX offers several other advantages over pyrimethamine-based therapies. First, TMP-SMX can be administered orally or parenterally, whereas pyrimethamine is only available orally [7]. Second, TMP-SMX can be administered twice daily, as opposed to sulfadiazine and clindamycin, which are given 4 times daily [7]. Third, TMP-SMX has a lesser pill burden than pyrimethamine-containing therapies (which are also given with folinic acid), which may improve compliance. Fourth, P-C does not cross-protect against PCP, whereas TMP-SMX and P-S [7] do. Fifth, TMP-SMX is much less expensive and more widely available. Finally, TMP-SMX is also widely used by clinicians for other infectious diseases, and there is likely great comfort with the drug, including a better understanding of the adverse effect profile relative to pyrimethamine-containing regimens. Unfortunately, the RCT data for TMP-SMX in TE are limited to 2 RCTs [39, 40] and 107 patients’ worth of data. Between that and the absence of evidence outside of HIV, we believe that modern-day RCTs would certainly be justified. However, given its favorable efficacy, cost (and therefore accessibility), safety, and excellent oral bioavailability, TMP-SMX appears to be a potentially superior alternative to pyrimethamine-containing therapies, and we believe that guidelines could be revisited.
CONCLUSIONS
The evidence basis on which pyrimethamine-containing regimens are preferred to TMP-SMX in the treatment of TE is limited. Our systematic review found that TMP-SMX is likely as efficacious with less toxicity and cost. A pragmatic, international, randomized platform trial including patients with and without HIV and evaluating optimal dosage, duration of therapy, timing of antiviral therapy in HIV, and the use of adjunctive therapy is warranted.
Supplementary Data
Supplementary materials are available at Clinical Infectious Diseases online. Consisting of data provided by the authors to benefit the reader, the posted materials are not copyedited and are the sole responsibility of the authors, so questions or comments should be addressed to the corresponding author.
Notes
Author Contributions. Conceptualization: C. P., I. I. B., E. G. M., and T. C. L. Methodology: C. P. and T. C. L. Validation: C. P., R. H., Y. L., and T. C. L. Formal analysis: C. P. and T. C. L. Investigation: C. P., R. H., Y. L., and T. C. L. Resources: C. P. and T. C. L. Data curation: C. P., R. H., and Y. L. Writing the original draft: C. P., I. I. B., E. G. M., and T. C. L. Writing, reviewing, and editing: all authors. Visualization: C. P. and T. C. L. Supervision: T. C. L. and E. G. M. Project administration: C. P., T. C. L., and E. G. M. Funding: C. P., T. C. L., and E. G. M.
Acknowledgments. The authors thank Alex Amar, research librarian, for his assistance in designing the search strategy, and Emily Ngsee, graphic designer, for her assistance with the visual abstract.
Financial support. This work was supported by the Clarke McLeod Scholarship (C. P.). T. C. L. and E. G. M. received research salary support from the Fonds de Recherche du Québec–Santé.
References
Author notes
E. G. M. and T. C. L. contributed equally to this work.
Potential conflicts of interest. I. I. B. consults with BlueDot and the NHL Players’ Association (consulting fees) and reports grants from the Canadian Institutes for Health Research (peer reviewed grant for human immunodeficiency virus prevention and schistosomiasis control). All other authors report no potential conflicts.
All authors have submitted the ICMJE Form for Disclosure of Potential Conflicts of Interest. Conflicts that the editors consider relevant to the content of the manuscript have been disclosed.

