


Abstract
Black and Hispanic/Latino men who have sex with men (MSM) are disproportionately affected by human immunodeficiency virus (HIV). In the Targeted Highly Effective Interventions to Reverse the HIV Epidemic (THRIVE) demonstration project, 7 community collaboratives were developed to provide comprehensive HIV prevention services for these populations.
We analyzed National HIV Surveillance System data to determine the number of HIV diagnoses for each year from 2014 to 2019 among Black, Hispanic/Latino, and White MSM in 7 THRIVE-eligible Metropolitan Statistical Areas (MSAs) that were awarded funding and 12 THRIVE-eligible MSAs that were not awarded funding. We used generalized linear Poisson regression models to estimate adjusted estimated annual percentage changes (EAPCs) with 95% confidence intervals for HIV diagnosis rates controlling for HIV prevalence, viral suppression, HIV testing rates, preexposure prophylaxis (PrEP) prescription rates, poverty, education, and insurance status.
We found larger estimated decreases in HIV diagnosis rates in THRIVE jurisdictions compared with non-THRIVE jurisdictions. The adjusted EAPC among Black MSM was −8.2 (−11.7 to −4.6) in THRIVE MSAs compared with −4.2 (−7.8 to −0.4) in non-THRIVE MSAs. The adjusted EAPC among Hispanic/Latino MSM was −8.6 (−12.2 to −4.8) in THRIVE MSAs compared with −2.6 (−5.1 to −0.1)in non-THRIVE MSAs. The adjusted EAPC among White MSM was −7.6 (−12.0 to −3.1) in THRIVE MSAs compared with 5.9 (1.8-10.1) in non-THRIVE MSAs.
The THRIVE community collaborative model was associated with a decrease in HIV diagnoses among Black and Hispanic/Latino MSM. To achieve the goals of the US Ending the HIV Epidemic initiative, effective interventions aimed to increase PrEP use need to be focused on Black and Hispanic/Latino MSM.
Racial and ethnic disparities in human immunodeficiency virus (HIV) diagnoses persist in the United States and Puerto Rico with higher rates of diagnoses among Black/African American (Black) or Hispanic/Latino gay, bisexual, and other men who have sex with men (MSM) [1]. In addition, among MSM, the most HIV diagnoses in the United States in 2019 were in MSM aged <35 years [1]. These disparities can be attributed to a high prevalence of HIV in the sexual networks of Black and Hispanic/Latino MSM and to social determinants of health that are associated with decreased access to and use of healthcare services [2, 3]. Lack of health insurance, lack of awareness of HIV risk, low health literacy, medical mistrust, and stigma are barriers to use of HIV prevention services by persons in these communities [4, 5]. Although these barriers have been challenging to overcome, HIV preexposure prophylaxis (PrEP) is a safe and effective intervention to prevent HIV infection. PrEP is more than 99% effective in preventing sexual acquisition of HIV and its implementation is a critical part of the “prevent” pillar of the Ending the HIV Epidemic in the United States initiative [6–9].
Black and Hispanic MSM have used PrEP at lower rates than White MSM, contributing to disparities in PrEP use and HIV diagnoses. Studies have shown that Black and Hispanic/Latino MSM were less likely to be aware of PrEP, to have been screened for PrEP indications by a healthcare provider, or to have been prescribed PrEP compared with White MSM [10, 11]. Another study compared the locations of US PrEP providers to the locations of persons with new HIV diagnoses and found that Black persons had less access to PrEP [11]. An assessment of PrEP use in a large healthcare system found that White men were more likely to be prescribed PrEP than Black or Hispanic/Latino men [12, 13].
Targeted Highly Effective Interventions to Reverse the HIV Epidemic (THRIVE) was a 5-year demonstration project conducted from 2015 to 2019 that funded US health departments to develop and lead community collaboratives to deliver comprehensive HIV prevention services for Black and Hispanic/Latino MSM, including access to and uptake of PrEP [14]. Collaborative partners included community-based organizations, healthcare providers, and behavioral health and essential support service providers. THRIVE eligibility was based on high rates of HIV diagnoses among Black and/or Hispanic/Latino MSM in 2014, defined as a Metropolitan Statistical Area (MSA) or Metropolitan District with either >2000 Black or Hispanic/Latino MSM with diagnosed HIV or >1000 Black or Hispanic/Latino MSM with diagnosed HIV and located in a state in the quartile with highest mortality [15]. Among the 28 THRIVE-eligible jurisdictions, 7 were funded. Overall, THRIVE collaboratives provided HIV prevention services for 8883 Black MSM and 3509 Hispanic/Latino MSM.
THRIVE resources were used to implement sensitive laboratory and point-of-care antigen/antibody HIV testing, PrEP services, and PrEP navigation to link clients to clinical PrEP providers. Activities and interventions were focused on making PrEP more accessible to Black and Hispanic/Latino MSM and supporting them to use PrEP. Many THRIVE interventions were implemented at the MSA level to support increased PrEP uptake. These included social and other media campaigns to educate men about HIV risk and PrEP availability, safety, and efficacy. In addition, community-wide training and academic detailing of healthcare providers was conducted to increase the number of PrEP providers in the jurisdiction. These training and academic detailing activities were extended to providers who were not members of the THRIVE collaboratives in the funded jurisdictions.
The effectiveness of public health funding in achieving intended outcomes. To assess the impact of THRIVE on HIV prevention among Black and Hispanic/Latino MSM, we compared HIV diagnosis rates reported to the National HIV Surveillance System (NHSS) in jurisdictions awarded THRIVE funding with HIV diagnosis rates in some jurisdictions that were eligible to apply for THRIVE but were not awarded funding.
METHODS
We analyzed NHSS data to determine the number of HIV diagnoses from 2014 to 2019 among Black, Hispanic/Latino, and White MSM aged ≥13 years in MSA jurisdictions that were eligible to apply for THRIVE [16]. Among 28 eligible MSAs, we compared HIV diagnosis rates in 7 jurisdictions that were selected for funding and 12 jurisdictions with similar HIV morbidity and mortality that were eligible to apply for THRIVE but were not funded (Appendix). We excluded 9 MSAs that were eligible to apply for THRIVE and were not funded but received funding by another demonstration project besides THRIVE. To determine HIV diagnosis rates for each year by MSA, we used the number of MSM with diagnosed HIV infection as the numerator and the number of men in the US Census Bureau American Community Survey (ACS) as the denominator [17]. The number of men was used as a proxy for MSM in the denominator because population-level estimates of the number of MSM were not available for MSAs. We assumed that the proportion of MSM among men was similar in all eligible jurisdictions. We calculated estimated annual percentage changes (EAPCs) with 95% confidence intervals (CIs) for HIV diagnosis rates from 2014 to 2019 for THRIVE and non-THRIVE MSAs. All unadjusted analyses were stratified by race and ethnicity and by age group (13–24, 25–34, 35–44, 45–54, and ≥55 years).
To assess whether HIV diagnoses changed over the study period in THRIVE MSAs compared with non-THRIVE MSAs, we analyzed NHSS data to determine the number of MSM with diagnosed HIV per 100 000 men in the ACS data stratified by race and ethnicity [18]. To assess whether HIV viral suppression changed from 2014 to 2019 and to control for the effect of viral suppression on HIV diagnoses, we analyzed NHSS among jurisdictions that had complete laboratory data reporting to estimate the percentage of MSM who were virally suppressed by race and ethnicity. HIV viral suppression was defined as having an HIV viral load of <200 copies of HIV per milliliter of blood at the most recent viral load test. To assess whether HIV testing rates changed over the study period and for inclusion as a possible confounder in the multivariable analysis, we analyzed data in the MarketScan Commercial Claims and Encounters Data and the Centers for Medicare and Medicaid Services database to estimate the percentage of men tested for HIV among men enrolled in commercial health plans or in Medicaid, respectively [19]. HIV tests were identified in these databases using Current Procedural Terminology codes [20]. To assess whether PrEP prescription rates changed over the study period and for inclusion as a possible confounder in the multivariable analysis, we analyzed data in the Real-World Data—Longitudinal Prescriptions Database to estimate the rate of PrEP prescriptions per 100 000 men in the ACS [21]. To assess whether social determinants of health changed over the study period and for inclusion as a possible confounder in the multivariable analysis, we analyzed ACS data to estimate the percentages of men living below the federal poverty level, men who had less than a high school education, and men who were uninsured [17].
To compare HIV diagnosis rates over time between THRIVE and non-THRIVE jurisdictions from 2014 to 2019, we used multivariable mixed-effects Poisson regression models to estimate adjusted EAPCs with 95% CIs stratified by race and ethnicity, controlling for HIV prevalence, HIV testing rates, PrEP prescription rates, percentage of persons living below the federal poverty level, percentage of persons with less than a high school education, and percentage of uninsured persons in each jurisdiction. Models included fixed effects for year, THRIVE funding (yes/no), their interaction, and a random intercept to account for the correlation within jurisdictions.
Because of variability in data completeness for HIV viral suppression for all THRIVE-eligible jurisdictions in NHSS, we conducted a separate subanalysis using a subset of MSA jurisdictions with available viral suppression data for 1 or more years of our study [1]. In this subset analysis, we used multivariable mixed-effects Poisson regression models to estimate adjusted EAPCs with 95% CIs for HIV diagnosis rates in THRIVE and non-THRIVE jurisdictions controlling for the proportion of MSM with a suppressed HIV viral load.
RESULTS
From 2014 to 2019, 153 899 HIV infections were diagnosed among MSM in the United States and Puerto Rico with 19 590 (12.7%) of these diagnoses in the 7 THRIVE jurisdictions and 29 849 (19.4%) in the 12 non-THRIVE jurisdictions. HIV diagnosis rates among Black, Hispanic/Latino, and White MSM decreased in both THRIVE and non-THRIVE jurisdictions over the study period (Table 1). HIV prevalence among MSM and the percentage of MSM with HIV who were virally suppressed increased over this time. For all racial and ethnic groups in THRIVE and non-THRIVE jurisdictions, there were increases in rates of HIV testing of men with commercial health insurance and Medicaid and in rates of PrEP prescription, whereas there were decreases in the percentages of men living below the poverty level, men with less than a high school education, and uninsured men.
Characteristics of Men in THRIVE and non-THRIVE Metropolitan Statistical Areas by Race, Ethnicity, and Year, 2014–2019
| Year | ||||||
|---|---|---|---|---|---|---|
| 2014 | 2015 | 2016 | 2017 | 2018 | 2019 | |
| HIV diagnoses in MSM per 100 000 personsa | ||||||
| THRIVE | ||||||
| ȃBlack/African American | 73.7 | 68.5 | 64.9 | 62.6 | 59.4 | 52.9 |
| ȃHispanic/Latinob | 54.4 | 56.6 | 52.0 | 50.0 | 45.6 | 44.3 |
| ȃWhite | 15.5 | 12.4 | 12.1 | 10.2 | 8.8 | 7.4 |
| Non-THRIVE | ||||||
| ȃBlack/African American | 84.5 | 86.6 | 82.9 | 82.4 | 77.5 | 76.6 |
| ȃHispanic/Latinob | 49.8 | 52.1 | 53.7 | 50.1 | 50.3 | 47.1 |
| ȃWhite | 16.7 | 15.2 | 14.6 | 14.3 | 14.2 | 12.5 |
| HIV prevalence in MSM per 100 000 personsa | ||||||
| THRIVE | ||||||
| ȃBlack/African American | 1222.5 | 1289.7 | 1324.4 | 1370.2 | 1418.7 | 1468.4 |
| ȃHispanic/Latinob | 1079.5 | 1112.6 | 1159.8 | 1177.6 | 1223.6 | 1257.6 |
| ȃWhite | 427.5 | 439.3 | 445.2 | 450.7 | 455.7 | 463.1 |
| Non-THRIVE | ||||||
| ȃBlack/African American | 1173.0 | 1238.1 | 1271.4 | 1339.7 | 1388.3 | 1426.6 |
| ȃHispanic/Latinob | 611.9 | 642.0 | 670.3 | 695.8 | 723.7 | 753.5 |
| ȃWhite | 412.3 | 421.3 | 424.2 | 434.4 | 438.1 | 442.5 |
| HIV viral suppression in MSM, % (SD)c | ||||||
| THRIVE | ||||||
| ȃBlack/African American | 52.6 (4.5) | 55.4 (6.6) | 54.7 (8.8) | 59.2 (5.8) | 62.8 (3.7) | 64.4 (2.9) |
| ȃHispanic/Latinob | 55.5 (10.3) | 57.9 (6.8) | 54.0 (9.8) | 58.1 (7.8) | 63.0 (4.4) | 62.5 (4.4) |
| ȃWhite | 61.8 (11.1) | 61.9 (14.1) | 61.4 (12.5) | 65.3 (10.1) | 69.0 (9.4) | 69.6 (7.9) |
| Non-THRIVE | ||||||
| ȃBlack/African American | 53.4 (6.4) | 57.0 (5.8) | 56.0 (6.1) | 57.3 (7.2) | 57.7 (6.3) | 59.0 (6.5) |
| ȃHispanic/Latinob | 56.5 (9.2) | 59.1 (6.7) | 61.3 (9.8) | 63.8 (10.4) | 64.3 (9.2) | 64.2 (10.0) |
| ȃWhite | 65.7 (11.5) | 69.0 (8.1) | 70.1 (6.9) | 70.8 (10.5) | 70.5 (10.7) | 71.3 (9.8) |
| HIV testing rate in men, % (SD) | ||||||
| Commercial insuranced | ||||||
| ȃTHRIVE | 3.7 (1.8) | 3.8 (1.7) | 4.0 (1.7) | 4.4 (1.7) | 5.0 (2.0) | 5.5 (2.2) |
| ȃNon-THRIVE | 2.8 (0.8) | 3.1 (1.1) | 2.8 (0.6) | 3.3 (1.0) | 3.7 (1.1) | 4.0 (1.4) |
| Medicaide | ||||||
| ȃTHRIVE | 5.0 (3.0) | 5.3 (3.2) | 6.0 (3.7) | 6.6 (3.8) | 7.0 (4.0) | 7.2 (3.9) |
| ȃNon-THRIVE | 1.6 (0.8) | 1.8 (0.8) | 2.7 (1.6) | 3.4 (1.8) | 3.6 (1.7) | 3.7 (2.0) |
| PrEP prescriptions in men per 100 000 mena | ||||||
| ȃTHRIVE | 0.03 (0.03) | 0.09 (0.07) | 0.19 (0.13) | 0.30 (0.19) | 0.40 (0.24) | 0.45 (0.27) |
| ȃNon-THRIVE | 0.02 (0.01) | 0.05 (0.04) | 0.11 (0.07) | 0.16 (0.09) | 0.23 (0.13) | 0.30 (0.17) |
| Men living below federal poverty level,f % (SD) | ||||||
| ȃTHRIVE | 11.4 (3.7) | 11.4 (3.6) | 11.2 (3.5) | 11.0 (3.5) | 10.7 (3.3) | 10.4 (3.3) |
| ȃNon-THRIVE | 14.0 (7.1) | 13.9 (7.2) | 13.5 (7.1) | 13.1 (7.2) | 12.6 (7.2) | 12.0 (7.2) |
| Men with less than high school education, % (SD) | ||||||
| ȃTHRIVE | 14.0 (2.8) | 13.5 (2.8) | 13.2 (2.7) | 12.8 (2.7) | 12.4 (2.5) | 12.0 (2.5) |
| ȃNon-THRIVE | 15.7 (4.9) | 15.3 (4.7) | 15.0 (4.6) | 14.7 (4.5) | 14.3 (4.3) | 14.0 (4.2) |
| Uninsured men, % (SD) | ||||||
| ȃTHRIVE | 14.3 (3.0) | 13.2 (2.9) | 12.1 (2.6) | 11.0 (2.4) | 9.9 (2.1) | 9.0 (1.9) |
| ȃNon-THRIVE | 19.7 (6.4) | 18.2 (5.8) | 16.7 (5.3) | 15.3 (4.8) | 14.0 (4.3) | 13.5 (4.1) |
Abbreviations: HIV, human immunodeficiency virus; PrEP. preexposure prophylaxis; SD, standard deviation; THRIVE, Targeted Highly Effective Interventions to Reverse the HIV Epidemic.
Men were used as a proxy for men who have sex with men (MSM) to calculate rates because population-level estimates of the number of MSM were not available for Metropolitan Statistical Areas.
Hispanic/Latino persons can be of any race.
HIV viral suppression data were available only for a subset of MSAs for 2014–2019.
Percentage of men tested for HIV among men enrolled in a commercial health plan.
Percentage of men tested for HIV among men enrolled in Medicaid.
The amount of annualized income earned by a household, below which they would be eligible to receive certain welfare benefits.
We found significant estimated decreasing trends in HIV diagnosis rates among Black, Hispanic/Latino, and White MSM in THRIVE jurisdictions overall and for most age categories (Table 2). Non-THRIVE jurisdictions also had significant estimated decreases in HIV diagnosis rates overall and for some age groups; however, generally, the decreases were not as large as in THRIVE jurisdictions. The largest decreases in HIV diagnosis rates among Black MSM in THRIVE jurisdictions were among those aged ≥55 years (EAPC −6.6 [95% CI, −11.9 to −1.0]) and among those aged 25 to 34 years of age (EAPC −6.0 [95% CI, −7.8 to −4.1]). The largest decreases in HIV diagnosis rates among Hispanic/Latino MSM in THRIVE jurisdictions were among those aged 45 to 54 years (EAPC −10.1 [95% CI, −14.5 to −5.5]) and those aged 35 to 44 years (EAPC −7.2 [95% CI, −10.4 to −3.8]). The largest decreases in HIV diagnosis rates among White MSM in THRIVE jurisdictions were among those aged 35 to 44 years (EAPC −15.1 [95% CI, −18.9 to −11.1]).
Unadjusted Estimated Annual Percentage Change (EAPC) in Human Immunodeficiency Virus Diagnosis Rates Among Men who Gave Sex With Men in THRIVE and non-THRIVE Metropolitan Statistical Areas by Race, Ethnicity, and Age, 2014–2019
| Black | Hispanic/Latinoa | White | ||
|---|---|---|---|---|
| Age Group (y) | EAPC (95% CI)b | |||
| Total (≥13) | THRIVE | −5.9 (−7.1 to −4.6) | −4.7 (−6.2 to −3.2) | −12.9 (−15.4 to −10.3) |
| Non-THRIVE | −2.3 (−3.6 to −1.0) | −1.7 (−2.7 to −0.7) | −4.6 (−7.0 to −2.1) | |
| US and Puerto Rico | −2.4 (−3.1 to −1.7) | −2.0 (−2.8 to −1.3) | −4.9 (−5.7 to −4.1) | |
| 13–24 | THRIVE | −5.9 (−7.9 to −3.9) | −3.9 (−7.0 to −0.7) | −13.0 (−18.0 to −7.7) |
| Non-THRIVE | −2.5 (−4.3 to −0.7) | −4.7 (−6.9 to −2.5) | −2.6 (−6.7 to 1.7) | |
| US and Puerto Rico | −3.4 (−4.5 to −2.3) | −3.2 (−4.6 to −1.7) | −2.4 (−4.4 to −0.3) | |
| 25–34 | THRIVE | −6.0 (−7.8 to −4.1) | −0.9 (−3.3 to 1.5) | −11.4 (−14.4 to −8.3) |
| Non-THRIVE | −0.9 (−2.5 to 0.8) | 1.3 (−0.4 to 3.0) | −3.5 (−6.2 to −0.6) | |
| US and Puerto Rico | −1.0 (−2.1 to 0.1) | 0.9 (−0.3 to 2.1) | −2.9 (−4.3 to −1.5) | |
| 35–44 | THRIVE | −3.0 (−6.1 to 0.2) | −7.2 (−10.4 to −3.8) | −15.1 (−18.9 to −11.1) |
| Non-THRIVE | −0.1 (−3.1 to 3.0) | −0.2 (−2.5 to 2.1) | −5.5 (−8.8 to −2.1) | |
| US and Puerto Rico | 0.0 (−1.9 to 2.0) | −2.4 (−4.0 to −0.8) | −5.9 (−7.6 to −4.1) | |
| 45–54 | THRIVE | −5.2 (−9.2 to −1.0) | −10.1 (−14.5 to −5.5) | −14.6 (−18.6 to −10.4) |
| Non-THRIVE | −6.8 (−10.5 to −2.9) | −3.4 (−6.2 to −0.5) | −7.0 (−10.1 to −3.7) | |
| US and Puerto Rico | −4.2 (−6.6 to −1.8) | −4.3 (−6.4 to −2.2) | −8.7 (−10.3 to −7.0) | |
| ≥55 | THRIVE | −6.6 (−11.9 to −1.0) | −3.2 (−10.4 to 4.5) | −6.3 (−11.8 to −0.5) |
| Non-THRIVE | −5.9 (−11.4 to −0.1) | 2.7 (−2.1 to 7.7) | 0.6 (−3.7 to 5.1) | |
| US and Puerto Rico | −3.3 (−6.6 to .0) | −0.6 (−4.1 to 3.1) | −1.9 (−4.0 to 0.4) |
Abbreviation: THRIVE, Targeted Highly Effective Interventions to Reverse the HIV Epidemic.
Hispanic/Latino persons can be of any race.
EAPCs were estimated using mixed-effects Poisson regression models that included a random intercept and fixed effects for year, THRIVE funding (yes/no), and the interaction between THRIVE funding and year.
In both unadjusted and adjusted regression models, we found larger decreases in HIV diagnoses in THRIVE jurisdictions compared with non-THRIVE jurisdictions for Black, Hispanic, and White MSM (Figure 1). Table 3 shows unadjusted EAPCs and adjusted EAPCS that included potential confounders in the model. We estimated an adjusted EAPC of −8.2 (95% CI, −11.7 to −4.6) for Black MSM in THRIVE jurisdictions compared with −4.2 (−7.8 to −0.4) in non-THRIVE jurisdictions. We estimated an adjusted EAPC of −8.6 (−12.2 to −4.8) for Hispanic/Latino MSM in THRIVE jurisdictions compared with −2.6 (−5.1 to −0.1) in non-THRIVE jurisdictions. We estimated an adjusted EAPC of −7.6 (−12.0 to −3.1) for White MSM in THRIVE jurisdictions compared with 5.9 (1.8-10.1) in non-THRIVE jurisdictions.
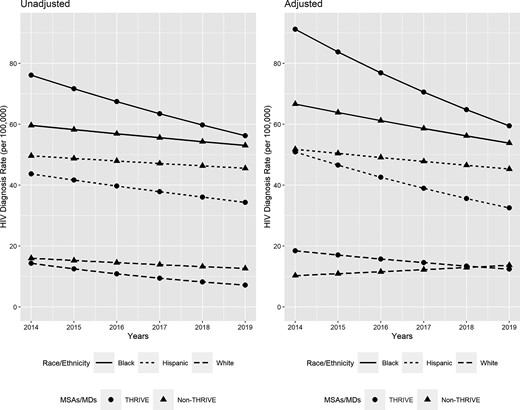
Unadjusted and adjusted* HIV diagnosis rates among men who have sex with men in THRIVE and non-THRIVE Metropolitan Statistical Areas by race and ethnicity, 2014–2019. *Adjusted HIV diagnosis rates calculated controlling for HIV prevalence, HIV testing rates, PrEP prescription rates, percentages of persons living below the federal poverty level, percentages of persons with less than a high school education, and percentage of uninsured persons in each jurisdiction. Abbreviations: HIV, human immunodeficiency virus; MD, metropolitan division; MSA, Metropolitan Statistical Area; PrEP, preexposure prophylaxis; THRIVE, Targeted Highly Effective Interventions to Reverse the HIV Epidemic.
Unadjusted and Adjusted Estimated Annual Percentage Change (EAPC) in HIV Diagnosis Rates and Estimated Rate Ratios Among Men Who Have Sex With Men in THRIVE and non-THRIVE Metropolitan Statistical Areas by Race and Ethnicity, Adjusted for Select Covariates, 2014–2019
| Black MSM | Hispanic/Latino MSMa | White MSM | ||||
|---|---|---|---|---|---|---|
| EAPC (95% CI)b | EAPC (95% CI)b | EAPC (95% CI)b | ||||
| Unadjusted | Adjusted | Unadjusted | Adjusted | Unadjusted | Adjusted | |
| THRIVE | −5.9 (−7.1 to −4.6) | −8.2 (−11.7 to −4.6) | −4.7 (−6.2 to −3.2) | −8.6 (−12.2 to −4.8) | −12.9 (−15.4 to −10.3) | −7.6 (−12.0 to −3.1) |
| Non-THRIVE | −2.3 (−3.6 to −1.0) | −4.2 (−7.8 to −0.4) | −1.7 (−2.7 to −0.7) | −2.6 (−5.1 to −0.1) | −4.6 (−7.0 to −2.1) | 5.9 (1.8 to 10.1) |
| Rate Ratioc (95% CI) | Rate Ratioc (95% CI) | Rate Ratioc (95% CI) | ||||
| HIV Prevalence per 100 000 persons (per increase of 100) | 1.04 (1.02-1.06) | 1.02 (1.00-1.05) | 1.09 (1.05-1.13) | 1.09 (1.04-1.14) | 1.12 (1.08-1.17) | 1.07 (1.04-1.11) |
| Commercial insurance HIV testing rate (per increase of 5%) | 0.84 (0.70-1.02) | 0.73 (0.59-0.90) | 0.85 (0.75-0.97) | 0.85 (0.74-0.97) | 0.70 (0.54-0.90) | 0.94 (0.74-1.20) |
| Medicaid HIV testing rate (per increase of 5%) | 1.00 (0.90-1.11) | 1.04 (0.97-1.13) | 0.99 (0.91-1.07) | 1.00 (0.91-1.09) | 1.05 (0.87-1.26) | 1.33 (1.11-1.60) |
| PrEP prescription rate (per increase of 1%) | 1.15 (0.95-1.40) | 1.65 (1.29-2.12) | 0.96 (0.80-1.14) | 1.13 (0.81-1.57) | 0.45 (0.34-0.60) | 0.99 (0.69-1.43) |
| Percent Below Poverty Level (per increase of 5%) | 0.73 (0.65-0.81) | 0.81 (0.70-0.95) | 0.86 (0.79-0.94) | 0.99 (0.93-1.06) | 1.04 (0.80-1.36) | 1.33 (1.11-1.59) |
| Percent with less than high school education (per increase of 5%) | 0.94 (0.79-1.11) | 0.88 (0.75-1.05) | 1.02 (0.94-1.10) | 1.00 (0.94-1.07) | 0.83 (0.53-1.28) | 0.68 (0.53-0.87) |
| Percent uninsured (per increase of 5%) | 0.96 (0.88, 1.04) | 1.19 (1.09-1.31) | 0.92 (0.88-0.96) | 1.02 (0.97-1.07) | 1.03 (0.79-1.33) | 1.97 (1.59-2.45) |
Abbreviations: CI, confidence interval; EAPC, estimated annual percentage change; HIV, human immunodeficiency virus; MSA, Metropolitan Statistical Area; MSM, men who have sex with men; THRIVE, Targeted Highly Effective Interventions to Reverse the HIV Epidemic.
Hispanic/Latino persons can be of any race.
Unadjusted results estimated using a multivariable mixed-effects Poisson regression model including the variable of interest, a fixed effect for year, and a random intercept. Adjusted results estimated using a multivariable mixed-effects Poisson regression model including all variables in the table, a fixed effect for year, and a random intercept.
Rate ratios estimated for continuous variables comparing the HIV diagnosis rate in an MSA to an MSA with the indicated percentage point increase in the variable.
In the subanalysis that adjusted for the percentage of HIV viral suppression among persons with HIV in THRIVE and non-THRIVE MSAs, we found that every 5% increase in viral suppression was associated with a 3% to 7% decrease in the HIV diagnosis rate in all race and ethnicity groups and all MSAs (Table 4). After controlling for viral suppression in the models, we found larger decreasing EAPCs for HIV diagnoses among Black MSM in THRIVE MSAs (−4.0 [−6.4 to −1.4]) compared with non-THRIVE MSAs (−1.6 [−3.3 to 0.2]); among Hispanic/Latino MSM in THRIVE MSAs (−5.3 [−9.6 to −0.8]) compared with non-THRIVE MSAs (−1.3 [−3.2 to 0.5]); and among White MSM in THRIVE MSAs (−9.0 [−12.6 to −5.3]) compared with non-THRIVE MSAs (−5.2 [−7.6 to −2.7]).
Unadjusted and Adjusted Estimated Annual Percentage Change (EAPC) in HIV Diagnosis Rates and Estimated Rate Ratios Among Men Who Have Sex With Men in THRIVE and non-THRIVE Metropolitan Statistical Areas by Race, Ethnicity, and Viral Suppression, 2014–2019
| Unadjusteda | Adjustedb | ||
|---|---|---|---|
| Black MSM | EAPC (95% CI) | ||
| THRIVE | −5.9 (−7.1 to −4.6) | −4.0 (−6.4 to −1.4) | |
| Non-THRIVE | −2.3 (−3.6 to −1.0) | −1.6 (−3.3 to 0.2) | |
| Rate ratio (95% CI) per increase of 5%c | |||
| Viral suppression (%) | 0.93 (0.90-0.96) | 0.94 (0.91-0.97) | |
| Hispanic/Latino MSMd | EAPC (95% CI)** | ||
| THRIVE | −4.7 (−6.2 to −3.2) | −5.3 (−9.6 to −0.8) | |
| Non-THRIVE | −1.7 (−2.7 to −0.7) | −1.3 (−3.2 to 0.5) | |
| Rate ratio (95% CI) per increase of 5%c | |||
| Viral suppression (%) | 0.95 (0.90-1.00) | 0.97 (0.92-1.02) | |
| White MSM | EAPC (95% CI)** | ||
| THRIVE | −12.9 (−15.4 to −10.3) | −9.0 (−12.6 to −5.3) | |
| Non-THRIVE | −4.6 (−7.0 to −2.1) | −5.2 (−7.6 to −2.7) | |
| Rate ratio (95% CI) per increase of 5%c | |||
| Viral suppression (%) | 0.95 (0.91-1.00) | 0.97 (0.92-1.02) | |
Abbreviations: CI, confidence interval; EAPC, estimated annual percentage change; MSA, Metropolitan Statistical Area; MSM, men who have sex with men; THRIVE, Targeted Highly Effective Interventions to Reverse the HIV Epidemic.
Unadjusted results estimated using a multivariable mixed-effects Poisson regression model including the variable of interest, a fixed effect for year, and a random intercept.
Adjusted results estimated using a multivariable mixed-effects Poisson regression model including all variables in the table, a fixed effect for year, and a random intercept.
Rate ratios estimated for viral suppression comparing the HIV diagnosis rate in an MSA to an MSA with a 5 percentage point increase in viral suppression.
Hispanic/Latino persons can be of any race.
DISCUSSION
We found that jurisdictions that received THRIVE funding had larger estimated decreases in rates of HIV diagnoses for Black and Hispanic/Latino MSM from 2014 to 2019 than jurisdictions that were eligible for THRIVE but not funded. These findings were also observed after adjusting for possible confounding by HIV prevalence, HIV testing rates, PrEP prescription rates, and sociodemographic characteristics among men in these communities. Our findings strongly suggest that THRIVE activities and interventions to increase access to and utilization of HIV prevention services by Black and Hispanic/Latino MSM, especially PrEP, were associated with decreased HIV transmission in these populations.
Our finding that PrEP implementation in THRIVE jurisdictions was associated with an accelerated decreasing trend in HIV diagnosis rates is consistent with findings in a study of New South Wales, Australia, that found a 25.1% decrease in HIV diagnosis rates among MSM after PrEP rollout [22]. Another report estimated the impact of PrEP on preventing HIV acquisition at the state level in the United States and found that the state specific EAPC for a given year decreased by 1.3% for an increase in PrEP coverage of 1 per 100 persons with indications [23]. The PrEP impact estimated in this study was of a smaller magnitude than in our study, likely because we studied PrEP implementation at the MSA level rather than the state level.
THRIVE collaborative partners met regularly, assessed gaps in their collective HIV service portfolios, identified new community partners to provide any missing services, and developed networks for communication and service referrals. Collaborative partners created multiple entry points for PrEP services that provided many opportunities for men to be educated and counseled about PrEP and to receive services necessary for its initiation such as HIV testing with sensitive antigen/antibody tests and other recommended laboratory tests [24]. Each collaborative developed its own unique model for PrEP navigation. Clients were also assessed for behavioral health service and other essential support service needs and offered navigation to use any needed services. To overcome financial barriers, collaboratives guided PrEP providers and clients to use medication assistance programs for PrEP and some collaboratives provided free or low-cost PrEP to clients [25, 26].
Stigma and medical mistrust are barriers to PrEP use by Black and Hispanic/Latino MSM and educating clinical and community-based organization staff can result in better health outcomes for patients and clients [27, 28]. To overcome these challenging barriers in THRIVE, training was available to all staff in collaborative organizations to support their provision of culturally competent and linguistically appropriate services. The training conducted by each THRIVE collaborative was tailored to the unique environment in each community. For example, 1 collaborative required staff to participate in racism and homophobia trainings to increase understanding of structural racism and homophobia in their community.
Our analyses had some limitations. Because population estimates of gay, bisexual, and other MSM were not available for MSAs, we used the male population as a denominator in our estimates. In addition, we estimated HIV testing rates, PrEP prescription rates, and sociodemographic characteristics for men because these data were not available for MSM. If the proportion of men who were MSM differed significantly among the MSAs or over the study period, then it is possible that we might have underestimated or overestimated some of these rates and percentages. However, the proportions of Black, Hispanic/Latino, or White MSM were similar in THRIVE-eligible MSAs compared with proportions observed in a previous study [29]. Because we conducted an ecologic study, causation cannot be inferred from the observed associations between THRIVE funding and decreased HIV diagnosis rates. However, we observed greater decreases in HIV diagnosis rates in THRIVE jurisdictions compared with eligible but unfunded jurisdictions after controlling for possible confounding by inclusion of several jurisdictional-level covariates in our model. The decreases in diagnoses in THRIVE MSAs can likely be attributed to the financial resources to support PrEP implementation because THRIVE funding was likely the largest variance between the sites; however, there may be other factors that we cannot account for in our analysis. Finally, HIV viral suppression data in NHSS were not complete for all study jurisdictions over time, so we could not include viral suppression in our multivariable model. However, in a subanalysis that adjusted for viral suppression, we observed a larger decreased adjusted EAPC for HIV diagnoses in THRIVE MSAs compared with non-THRIVE MSAs.
In conclusion, THRIVE funding was associated with decreasing rates of HIV diagnoses for Black and Hispanic/Latino MSM. The programmatic activities in the THRIVE demonstration project strengthened HIV prevention services by making PrEP accessible to Black and Hispanic/Latino MSM and supporting their utilization of PrEP services through navigation and other interventions. To achieve the goals of the Ending the HIV Epidemic initiative, effective interventions need to be focused on key populations with the highest rates of HIV incidence. The HIV epidemic cannot be ended without prioritizing Black and Hispanic/Latino MSM for interventions and activities to implement HIV testing and PrEP.
Notes
Financial support. This work was supported by the US Department of Health and Human Services.
Disclaimer. The findings and conclusions in this report are those of the authors and do not necessarily represent the official position of the Centers for Disease Control and Prevention. KLD reports this work was conducted by him as a government researcher at CDC while serving as a co-project officer for the THRIVE project as part of regular work duties as a medical epidemiologist. He did not receive funds from other entities other than the federal government. The Centers for Disease Control and Prevention funded the project.
Potential conflicts of interest. The authors: No reported conflicts of interest. All authors have submitted the ICMJE Form for Disclosure of Potential Conflicts of Interest.
Appendix. US Metropolitan Statistical Areas Eligible for THRIVE by Funding Status
| THRIVE-eligible and funded | THRIVE-eligible and unfundeda |
|---|---|
| Birmingham–Hoover, Alabama | Phoenix–Mesa–Scottsdale, Arizona |
| Washington Division, District of Columbia | Newark Division, New Jersey |
| New Orleans–Metairie, Louisiana | Miami Division, Florida |
| Baltimore–Towson, Maryland | Orlando–Orlando, Florida |
| Philadelphia Division | Fort Lauderdale Division–Fort Lauderdale, Florida |
| Virginia Beach–Norfolk–Newport News, Virginia | Atlanta–Sandy Springs–Marietta, Georgia |
| New York-White Plains-Wayne Division | Jackson, Mississippi |
| St. Louis, Missouri–Illinois | |
| San Juan–Caguas–Guaynabo, Puerto Rico | |
| Columbia, South Carolina | |
| Dallas Division, Texas | |
| San Antonio, Texas |
Abbreviation: THRIVE, Targeted Highly Effective Interventions to Reverse the HIV Epidemic.
There were 9 jurisdictions that were eligible but funded with by another demonstration project (PrIDE) and were thus not included in this analysis.
| THRIVE-eligible and funded | THRIVE-eligible and unfundeda |
|---|---|
| Birmingham–Hoover, Alabama | Phoenix–Mesa–Scottsdale, Arizona |
| Washington Division, District of Columbia | Newark Division, New Jersey |
| New Orleans–Metairie, Louisiana | Miami Division, Florida |
| Baltimore–Towson, Maryland | Orlando–Orlando, Florida |
| Philadelphia Division | Fort Lauderdale Division–Fort Lauderdale, Florida |
| Virginia Beach–Norfolk–Newport News, Virginia | Atlanta–Sandy Springs–Marietta, Georgia |
| New York-White Plains-Wayne Division | Jackson, Mississippi |
| St. Louis, Missouri–Illinois | |
| San Juan–Caguas–Guaynabo, Puerto Rico | |
| Columbia, South Carolina | |
| Dallas Division, Texas | |
| San Antonio, Texas |
Abbreviation: THRIVE, Targeted Highly Effective Interventions to Reverse the HIV Epidemic.
There were 9 jurisdictions that were eligible but funded with by another demonstration project (PrIDE) and were thus not included in this analysis.

