


Abstract
Human immunodeficiency virus (HIV) pre-exposure prophylaxis (PrEP) is underutilized in the southern United States. Rapid identification of individuals vulnerable to diagnosis of HIV using electronic health record (EHR)-based tools may augment PrEP uptake in the region.
Using machine learning, we developed EHR-based models to predict incident HIV diagnosis as a surrogate for PrEP candidacy. We included patients from a southern medical system with encounters between October 2014 and August 2016, training the model to predict incident HIV diagnosis between September 2016 and August 2018. We obtained 74 EHR variables as potential predictors. We compared Extreme Gradient Boosting (XGBoost) versus least absolute shrinkage selection operator (LASSO) logistic regression models, and assessed performance, overall and among women, using area under the receiver operating characteristic curve (AUROC) and area under precision recall curve (AUPRC).
Of 998 787 eligible patients, 162 had an incident HIV diagnosis, of whom 49 were women. The XGBoost model outperformed the LASSO model for the total cohort, achieving an AUROC of 0.89 and AUPRC of 0.01. The female-only cohort XGBoost model resulted in an AUROC of 0.78 and AUPRC of 0.00025. The most predictive variables for the overall cohort were race, sex, and male partner. The strongest positive predictors for the female-only cohort were history of pelvic inflammatory disease, drug use, and tobacco use.
Our machine-learning models were able to effectively predict incident HIV diagnoses including among women. This study establishes feasibility of using these models to identify persons most suitable for PrEP in the South.
Human immunodeficiency virus (HIV) pre-exposure prophylaxis (PrEP) is highly effective at preventing HIV infections [1–4] yet is poorly utilized across the United States, where only approximately 1 in 4 eligible candidates are receiving PrEP [5]. Uptake is lowest in the South; despite accounting for 52% of new HIV infections annually, the region represented only 39% of PrEP users in 2021 and has the lowest rates of PrEP use by region [6]. In 2019, North Carolina had one of the highest rates of incident HIV with 1365 new infections [6], but only an estimated 17.5% of eligible adults were prescribed PrEP in the same year [7].
Among many factors associated with poor PrEP uptake in the South, an important barrier is the identification of individuals most in need of PrEP. Updated Centers for Disease Control and Prevention (CDC) PrEP guidelines recommend discussing PrEP with all sexually active patients, which is an important first step in destigmatizing PrEP use. However, providers indicate challenges in identifying patients more likely to receive a diagnosis of HIV [8–10] with whom they could take a more intentional approach to offering PrEP. Additionally, providers may mistakenly believe they have few patients likely to benefit from PrEP [11, 12]. HIV risk prediction tools are available to facilitate identification of patients likely to benefit from PrEP, but these tools rely on behavioral data that are not consistently documented during medical encounters and do not capture risk driven by structural factors [13–15]. Although data from medical encounters are limited by provider practices and systemic biases that may influence healthcare engagement, automated electronic health record (EHR)-based models may mitigate some barriers to identification of patients likely to benefit from PrEP. Furthermore, by removing the onus of risk factor identification and synthesis from the provider, EHR-based models have the potential to reduce prescriber biases in providing PrEP [16–18].
In recent years, predictive models using EHR data have been developed to detect persons who are likely to benefit from PrEP. Marcus et al and Krakower et al used logistic regression to develop models to predict incident HIV in 2 large healthcare systems in California and Massachusetts; such models outperformed earlier, simpler models [19, 20]. Although these newer models have improved predictive performance, the authors note limitations in predicting incident HIV in women, in part because of low HIV rates among women in the populations used for model derivation. It is critically important to improve systems for enhancing PrEP uptake in cisgender women, as recent estimates show that only 7% of eligible women are prescribed PrEP [21]. Additionally, recent models were developed outside of the South and may lack generalizability to this region with a significant unmet need for prevention services. We present a predictive model for identifying persons likely to benefit from PrEP, developed from population-level data within a southern healthcare system that has higher HIV incidence among women relative to other regions.
METHODS
Study Setting
Model development and validation were conducted using archived clinical data at Duke University Health System (DUHS), an academic healthcare network in North Carolina. DUHS is the largest health system in the Raleigh-Durham metropolitan area (population: 2.1 million) [22]. Data from the EHR were extracted using the Duke Institute for Health Innovation pipeline and subsequently verified via completeness, conformance, and plausibility quality checks [23, 24]. This study was approved by the Duke University Institutional Review Board.
Data Set Development
We extracted EHR data from a cohort of DUHS patients who had at least 1 clinical encounter in any setting within DUHS during the “data gathering window” of October 2014 through August 2016 and another visit during the “prediction window” of September 2016 through August 2018. We also created a separate female-only data set using sex assigned at birth as recorded in the EHR. Persons using PrEP were included in the data set.
The outcome of interest was an incident positive HIV diagnosis, defined as an initial positive HIV antigen/antibody test or HIV RNA test during the prediction window. Individuals without an HIV test or with only negative HIV tests during the prediction window were classified as not having HIV. We excluded patients with prior HIV diagnosis, including those with incident diagnosis during the 2014–2016 data gathering window. After the initial data extraction, 2 physicians independently adjudicated all incident HIV diagnoses through manual chart review. Individuals who were deemed to have false-positive HIV testing (eg, indeterminate Ag/Ab result with negative reflex testing) or those who had documentation of HIV diagnosis prior to 2016 by chart adjudication were classified as not having incident HIV during the prediction window. Discrepancies between reviewing physicians were discussed and resolved by study team consensus.
Candidate predictors were adapted from the 81 candidate covariates included in the Marcus model [19]; however, some of these covariates were not included due to missingness in the Duke clinical data archive. We additionally included diagnostic codes and laboratory results for conditions associated with HIV in women (eg, pelvic inflammatory disease, trichomoniasis, sexual abuse, and domestic abuse) to potentially improve predictive performance for women [25–27]. Variables were chosen that were readily accessible within the DUHS EHR and likely standard within other EHR systems. Prevalence of HIV by zip code was provided by the North Carolina Department of Health and Human Services [28]. Neighborhood deprivation index was based on publicly available data [29, 30]. In sum, a total of 74 model features (all discrete) were built using EHR data elements (Supplementary Table 1).
Missing values for diagnoses and medications were assumed absent and assigned a value of “0,” which is the equivalent of a “negative” result for the model. Missing values for laboratory test results, demographic and social variables were assigned a default value of “NA” (not available) rather than “0” because numerical grading would be inappropriate. The “NA” notation served as an indicator for missingness and thus allowed the algorithm to gain signal from missingness itself.
Model Development
The model was developed on a random sample of 70% of encounters included in the cohort. The remaining 30% was withheld for model validation. As above, all model features were based on data from the data gathering window, and the model generated predictions for incident HIV diagnosis during the prediction window. Modelling was performed using both least absolute shrinkage and selection operator (LASSO) logistic regression and gradient boosting (XGBoost Model) [31]. Gradient boosting is a well-established machine learning technique that combines many models based on a series of decision trees together to create a final model, in what is known as ensemble learning [32]. XGBoost modeling has been shown to gain signal from missingness (or nonmissingness) without resorting to imputation techniques [33]. Gradient-boosting models for the HIV PrEP dataset were developed using the Python programming language (Python Software Foundation).
Model Evaluation
Features from the data gathering window were used to predict incident HIV during the prediction window in the withheld 30% sample. Model performance was assessed in the entire 30% hold-out set. We evaluated outcome metrics by calculating the AUROC and the area under the precision recall curve (AUPRC) for a total patient and a female-only cohort and included stratification of model performance by race. AUROC demonstrates the tradeoff between true positive and false positive rate at each probability, thus representing the probability that a randomly drawn HIV case was ranked as higher risk than a randomly drawn control case. AUPRC compares recall and positive predictive value (precision) and therefore correlates with increased sensitivity and decreased false negatives. AUPRC for a completely random test is equivalent to the incidence of the outcome [34].
Individual variables were visually interpreted using Shapley Additive exPlanations (SHAP) [35]. The SHAP interpretations approximate the original complex model with a simpler linear explanation model using classic equations derived from cooperative game theory. Thus, a weighted average of all possible marginal differences of the model output can be derived by adding the presence of the examined feature to subsets of features and the effect of each feature for each prediction can be calculated.
RESULTS
Of the 1 000 819 unique DUHS patients during the study period, 1826 were excluded because of an HIV diagnosis or positive HIV test prior to 2014, with an additional 206 patients excluded due to incident HIV diagnosis during the data gathering window (Supplementary Figure 1). The final cohort included 998 787 unique patients. Characteristics are shown in Table 1.
Model Development Data Set Characteristics (2014–2016)
| Total Patients | Patients With Incident HIV Diagnosis | |||
|---|---|---|---|---|
| Time Frame | 2014–2016 | 2016–2018 | ||
| No. of patients | 998 787 | 162 | ||
| Sex | ||||
| ȃFemale | 557 233 | 55.79% | 37 | 23% |
| ȃMale | 440 090 | 44.06% | 125 | 77% |
| Average age in years (SD) | ||||
| 48 (23) | 40.5 (14) | |||
| Race | ||||
| Data available | 938 240 | 93.94% | 151 | 93.2% |
| ȃWhite | 589 649 | 62.85% | 50 | 31% |
| ȃBlack | 250 100 | 26.66% | 94 | 58% |
| ȃAsian | 30 734 | 3.28% | 0 | 0% |
| ȃAmerican Indian or Alaskan Native | 5160 | 0.55% | 0 | 0% |
| ȃHispanic | 250 | 0.03% | 0 | 0% |
| ȃNative Hawaiian or other Pacific Islander | 1219 | 0.13% | 0 | 0% |
| ȃ2 or more races | 39 868 | 4.25% | 2 | 0.013% |
| ȃOther | 21 260 | 2.27% | 5 | 0.033% |
| Ethnicity | ||||
| Data available | 918 780 | 91.99% | 146 | 90% |
| ȃHispanic/Latino | 50 991 | 5.11% | 8 | 5% |
| ȃNot Hispanic/Latino | 867 789 | 86.88% | 146 | 90% |
| Neighborhood area deprivation index quintile | ||||
| Data available | 884 393 | 88.55% | 139 | 86% |
| ȃ0%–20% | 70 533 | 7.06% | 8 | 5% |
| ȃ20%–40% | 197 462 | 19.77% | 26 | 16% |
| ȃ40%–60% | 304 180 | 30.45% | 45 | 28% |
| ȃ60%–80% | 132 665 | 13.28% | 13 | 8% |
| ȃ80%–100% | 179 553 | 17.98% | 47 | 29% |
| Residency in county ranked by HIV prevalence | ||||
| Data available | 884 393 | 88.55% | 150 | 93% |
| ȃ0%–60% | 129 984 | 13.01% | 14 | 9% |
| ȃ60%–80% | 258 873 | 25.92% | 15 | 9% |
| ȃ80%–100% | 517 917 | 51.85% | 121 | 75% |
| Area deprivation index by percentile | ||||
| Data available | 884 393 | 88.55% | 150 | 93% |
| ȃ0%–20% | 70 533 | 8% | 14 | 9% |
| ȃ20%–40% | 197 462 | 22% | 15 | 10% |
| ȃ40%–60% | 304 180 | 34% | 121 | 81% |
| ȃ60%–80% | 132 665 | 15% | 0 | 0% |
| ȃ80%–100% | 179 553 | 20% | 0 | 0% |
Abbreviations: HIV, human immunodeficiency virus; SD, standard deviation.
From the initial data extraction, 162 patients had a first-time positive HIV antigen/antibody test or HIV RNA test during the 2016–2018 prediction window, after exclusion of 700 patients for previous diagnosis and 46 for false positive testing. The model development (“training”) dataset included 117 individuals with incident HIV diagnosis, of whom 37 were female, whereas the model evaluation (“testing”) data set included 45 incident HIV diagnoses, of whom 12 were female. LASSO logistic regression demonstrated an AUROC of 0.84 while XGBoost demonstrated an AUROC of 0.89. For a completely random test, baseline AUPRC is expected to be 0.00016 (incidence of HIV in this population). AUPRC was 0.024 for the LASSO logistic regression model and 0.013 for the XGBoost Model (Figure 1).
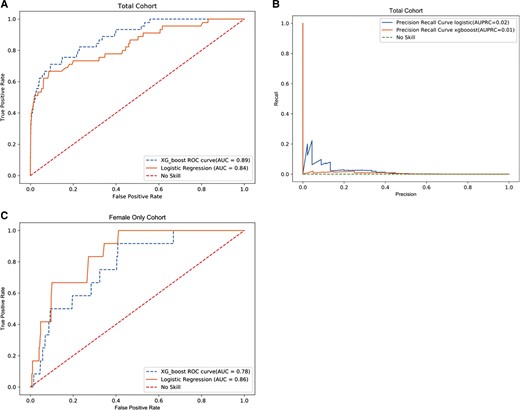
Model characteristics total cohort. No skill indicates how an untrained model making random choices would appear. A, AUROC—total cohort. B, AUPRC—total cohort. C, AUROC—female only cohort. Abbreviations: AUC, area under the curve; AUPRC, area under precision recall characteristic curve; AUROC, area under the receiver operating characteristic curve; ROC, receiver operating characteristic.
Model performance metrics for the XGBoost model developed on the total cohort were calculated for a range of risk threshold values (Table 2). Risk threshold is the probability of future HIV diagnosis for an individual above which the model flags as a positive result. As an example, a risk threshold of 0.5% flagged 794 patients in the validation data set who were likely to develop incident HIV and identified 14 of the 45 incident HIV cases (31.1% sensitivity). At the 0.5% threshold, the model had a positive predictive value (PPV) of 0.0176, negative predictive value (NPV) of 0.999, and number needed to evaluate (NNE) of 57. That is, if the model were used to prompt PrEP prescribing among patients above the 0.5% threshold, 57 patients would need to be prescribed PrEP to prevent a single case of incident HIV.
Risk Thresholds of XGBoost Model
| Risk Threshold | Positive Predictive Value | Sensitivity | Specificity | Negative Predictive Value | True Negatives | False Positives | False Negatives | True Positives | Number Needed to Evaluate |
|---|---|---|---|---|---|---|---|---|---|
| Total patient cohort | |||||||||
| ȃ10% | 0.0000 | 0.0000 | 1.0000 | 0.9998 | 299 583 | 9 | 45 | 0 | NA |
| ȃ5% | 0.0339 | 0.0444 | 0.9998 | 0.9999 | 299 535 | 57 | 43 | 2 | 30 |
| ȃ1% | 0.0277 | 0.2667 | 0.9986 | 0.9999 | 299 171 | 421 | 33 | 12 | 36 |
| ȃ0.5% | 0.0176 | 0.3111 | 0.9974 | 0.9999 | 298 812 | 780 | 31 | 14 | 57 |
| ȃ0.1% | 0.0038 | 0.4889 | 0.9807 | 0.9999 | 293 797 | 5795 | 23 | 22 | 264 |
| ȃ0.05% | 0.0022 | 0.6222 | 0.9575 | 0.9999 | 286 853 | 12 739 | 17 | 28 | 456 |
| ȃ0.01% | 0.0005 | 0.8000 | 0.7726 | 1.0000 | 231 466 | 68 126 | 9 | 36 | 1893 |
| ȃ0.005% | 0.0003 | 0.9333 | 0.5395 | 1.0000 | 161 623 | 137 969 | 3 | 42 | 3286 |
| Female cohort | |||||||||
| ȃ0.05% | NA | 0.0000 | 1.0000 | 0.9999 | 167 518 | 0 | 12 | 0 | NA |
| ȃ0.01% | 0.0003 | 0.5000 | 0.8828 | 1.0000 | 147 570 | 19 588 | 6 | 6 | 3266 |
| ȃ0.005% | 0.0001 | 0.7500 | 0.6058 | 1.0000 | 101 264 | 65 894 | 3 | 9 | 7323 |
| ȃ0.004% | 0.0001 | 0.9167 | 0.4530 | 1.0000 | 75 728 | 91 430 | 1 | 11 | 8313 |
Abbreviation: NA, not available.
For the female-only cohort, LASSO logistic regression demonstrated an AUROC of 0.86 and XGBoost demonstrated an AUROC of 0.78. For a completely random model, AUPRC is expected to be 0.00007 (incidence of HIV among women in this population). AUPRC for our model was 0.00048 for the logistic regression model and 0.00025 for the XGBoost Model, respectively. For the LASSO logistic regression model, at a threshold of 0.01%, flagging 19 594 women as likely to benefit from PrEP, 6 incident HIV diagnoses (50%) were identified out of 12 total. Similarly, model performance metrics for the XGBoost model developed on the female-only cohort were calculated for a range of risk threshold values. At a threshold of 0.01% the model had a PPV of 0.0003, NPV of 1.00, and an NNE of 3266. Among women, if the model were used independently to identify PrEP candidates, 3266 women would need to be prescribed PrEP to prevent a single case of incident HIV.
When stratified by race, Black individuals in the total cohort had a LASSO logistic regression AUROC of 0.78 and AUPRC of 0.031, whereas White individuals had values of 0.91 and 0.015, respectively. Using the XGBoost Model, the AUROC and AUPRC were 0.82 and 0.016 for Black individuals and 0.89 and 0.011 for White individuals. When separated into a female-only cohort, a LASSO logistic regression demonstrated an AUROC of 0.79 and AUPRC of 0.00057 for Black women and 0.91 and 0.001 for White women, respectively. The XGBoost model for the female-only cohort resulted in an AUROC and AUPRC of 0.74 and 0.00038 for Black women and 0.84 and 0.0002 for White women respectively (Supplementary Table 2).
We determined the variables most predictive of HIV acquisition based on coefficients for the LASSO logistic regression model and the individual SHAP values for the XGBoost model. For the logistic regression model (Supplementary Figure 2), the most positive predictors for the total cohort were sex, male sexual partner, history of domestic or sexual abuse, and history of drug use. The most negative predictors were female partner, number of positive tests for urine toxicology, and older age. The most positive predictors for the female-only cohort were history of pelvic inflammatory disease, history of drug use, and history of tobacco use, and the most negative predictors were number of positive urine toxicology tests, older age, and number of positive hepatitis C tests.
Using the XGBoost model for the total cohort, race, sex, and having a male sexual partner were the most important variables (ie, removing these variables resulted in the largest decrease in model performance). For the total cohort, sex, having a male sexual partner and history of drug use were the most impactful variables (ie, coefficient magnitude was highest). For the female-only cohort, the most important variables were race, tobacco use and zip code. These variables were also the most impactful (Figure 2).
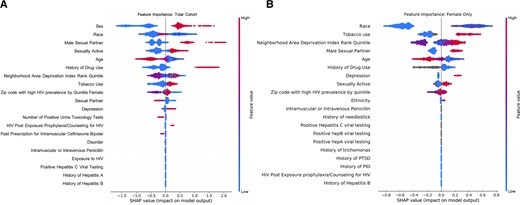
Shapley additive exPlanations from XGBoost Model. The SHAP interpretations approximate the original complex model with a simpler linear explanation model using classic equations derived from cooperative game theory. Variables in gray represent missing values which are still utilized in model development. A, Total cohort. B, Female-only cohort. Abbreviations: HIV, human immunodeficiency virus; PID, pelvic inflammatory disease; PTSD, post-traumatic stress disorder.
DISCUSSION
Our machine-learning model was able to effectively identify individuals with incident HIV diagnoses in a large southern academic health system. Our models had similar AUROCs as previously reported models, and we expanded on them by reporting values for female-only populations and by race. We used similar variables to the Marcus model [19, 20] and developed both a LASSO logistic regression algorithm and a gradient boosting model (XGBoost), which is extensively utilized in clinical decision support software and can outperform logistic regression [36, 37]. Indeed, we found improved model performance for gradient boosting compared with LASSO logistic regression for the total cohort, as expected given its additional computational robustness. Conversely, the LASSO model outperformed the XGBoost model for the female-only cohort. When identifying rare outcomes, as seen when identifying incident HIV in women, there is concern for overfitting when more complex models are used to assess the data [38, 39]; thus, use of simpler models may have better predictive value. The differences in our model results were small, however, suggesting that ease of curation and use might be the most important factors to consider for population impact.
The XGBoost model also notably performed well in Black patients, a population with disproportionate burden of infection whose vulnerability to HIV has previously been underestimated by HIV risk prediction tools [40–43]. Still, model performance for Black patients was slightly lower than that of White patients. This may be partially due to bias such as systematic differences in care delivery patterns or data availability [44]. As gradient boosted models learn more complicated decision rules than LASSO, model performance may be impacted by elements of the majority group that are more informative for the overall learning task. Further efforts are needed to ensure predictive models are efficacious for all patient groups to further address the disparities that already exist in PrEP prescribing, especially among Black women and Black and Latino MSM [45]. The improvement in the predictive ability of some of our models highlights the importance of iterative model building and shows promise for our ability to create more accurate and useful risk prediction models in the future.
Our analysis provided insight on differences between general population and female-only models. The most predictive variables for HIV risk were similar between these cohorts, although the female-only cohort depended more heavily on tobacco use and zip code of residence for the XGBoost Model and history of pelvic inflammatory disease in the LASSO model. Using our augmented feature set, we improved predictive accuracy among women. Women have had disproportionately low uptake of PrEP [21], and further efforts are needed to prompt discussions with women most likely to benefit. We believe that with further study—particularly in larger cohorts and with novel EHR data, such as social determinants of health—we can further improve predictive models for women.
One potential concern about using computer modeling to assess HIV risk is perception of models by patients and providers, including possible sensitivities about the use of EHR-based sexual health data [46]. Potential patients have mixed opinions, acknowledging that receipt of a “high” risk score may be useful and prompt risk-reduction strategies, but also citing possible feelings of fear, anxiety, and mistrust [47]. In focus group discussions, primary care providers felt that a predictive model could facilitate discussions between patients and providers; however, there were also concerns about confidentiality [48]. Offering providers a “fact sheet” about prediction models has the potential to aid in acceptability and clinical utility [49] (Supplementary Table 3). Furthermore, pre-implementation work is critical to ensure that algorithm use is acceptable and useful to providers and patients [50]. If such models are to be successful, they must be implemented in a culturally sensitive manner and with stakeholder engagement.
A strength of our model is the refined sample of incident HIV diagnoses used as outcomes, carefully adjudicated by chart review by 2 experienced physicians to obtain the most optimal surrogate for PrEP candidacy. However, it is possible that patients were missed. Similarly, rates of incident HIV were low both among our total cohort and in women, limiting the number of patients available for model training. Our study timeframe may limit model performance for individuals seen for shorter durations within our health system. Additionally, sex was based on sex at birth as we did not have information on gender. It is also unclear why the number of positive tests for urine toxicology and positive hepatitis C tests were negative predictors for HIV risk; the association is likely confounded and merits further study, but we hypothesize that these may be markers for contact with the healthcare system or, in the case of positive toxicology, indicate use of chronic prescribed narcotics rather than illicit drugs. Finally, we did not externally validate our models, instead focusing on validation locally to facilitate future use within local population health programs.
Our EHR-based risk prediction model successfully identified people with incident HIV diagnoses within a large southern healthcare system and has improved accuracy in predicting HIV vulnerability among women compared to prior models. Future studies will aim to expand this work to larger populations in the South and further improve model performance, particularly among women. Additionally, further pre-implementation studies are needed to identify strategies to integrate such EHR-based models into clinical workflows. With a better understanding of how to optimally implement these models in real-world settings, these interventions are likely to be scalable, particularly in high-incidence jurisdictions as delineated by the federal Ending the HIV Epidemic initiative [51].
Supplementary Data
Supplementary materials are available at Clinical Infectious Diseases online. Consisting of data provided by the authors to benefit the reader, the posted materials are not copyedited and are the sole responsibility of the authors, so questions or comments should be addressed to the corresponding author.
Notes
Acknowledgments. The authors thank Jason Maxwell J, Erika Samoff, and Nicole Adams with the North Carolina Division of Health and Human Services for providing data on persons diagnosed with and living at the end of 2019 by county and zip code.
Disclaimer. The content is solely the responsibility of the authors and does not necessarily represent the official views of the National Institutes of Health.
Financial support. This work was supported by the Duke University Center for AIDS Research (CFAR), a National Institutes of Health (NIH) funded program (grant number 5P30 AI064518) to M. E. C., M. S., and N. L. O.; National Institute of Allergy and Infectious Diseases at the National Institutes of Health [T32AI007392] to C. M. B.; the National Institute of Mental Health (grant number R34 MH122291) to J. L. M. and D. K.; and the National Institute of Allergy and Infectious Diseases at the NIH (grant number K23AI137121) to M. E. C.
Potential conflicts of interest. M. E. C. has received research support (grants to institution) from Gilead Sciences and ViiV Healthcare, has served on advisory boards for Roche Diagnostics Corporation and ViiV Healthcare, and has received personal fees for educational events from Vindico Medical Education, Practice Point Communications, Prime Education. D. K. has received research support by grants from Merck to the Fenway Institute and Gilead (paid to institution) and has received personal fees for development of medical education content from Virology Education and royalties or licenses from UpToDate Inc; Honoraria for educational presentation from Virology Education, New England AIDS Education and Training Center, and Cambridge Health Alliance; consulting fees from Loma Linda University and University of Alabama, Birmingham (UAB) (consulting fee for research project); and Data and Safety Monitoring Board (DSMB) for federally funded HIV prevention study (PI: P. Chai) and DSMB for federally funded syphilis treatment study (PI: E. Hook) (in-kind). N. L. O. reports consulting and honoraria for lecture for Gilead Sciences (paid to author). M. P. S., M. G., and S. B. are inventors of intellectual property licensed by Duke University to Clinetic, Inc, and Cohere-Med, Inc. M. P. S., M. G., and S. B. hold equity in Clinetic, Inc. J. L. M. reports previously consulted for Kaiser Permanente Northern California on a research grant from Gilead Sciences unrelated to the submitted work (paid to author) and payment for expert testimony from US Department of Justice (paid to author). L. P. reports grants or contracts from RSNA Medical Student Grant. All other authors report no potential conflicts. All authors have submitted the ICMJE Form for Disclosure of Potential Conflicts of Interest. Conflicts that the editors consider relevant to the content of the manuscript have been disclosed.
References
Author notes
C. M. B. and L. P. contributed equally to this work.

