


Abstract
Hepatitis C virus (HCV) infection has been reported among gay, bisexual, and other men who have sex with men (GBM) globally including GBM with human immunodeficiency virus (HIV) and HIV-negative GBM, particularly those using HIV preexposure prophylaxis (PrEP). In Australia, HCV direct-acting antiviral treatment (DAA) was government-funded from 2016. Large implementation studies of PrEP also began in 2016. We examined HCV incidence among GBM to assess whether HCV incidence has changed since 2015.
Data were drawn from the Australian Collaboration for Coordinated Enhanced Sentinel Surveillance. We included GBM who tested HCV antibody negative at their first test and had ≥1 subsequent test. Generalized linear modeling (Poisson distribution) was used to examine HCV incidence from 2009 to 2019 stratified by HIV status, and among HIV-negative GBM prescribed PrEP from 2016 to 2019.
Among 6744 GBM with HIV, HCV incidence was 1.03 per 100 person-years (PY). Incidence declined by 78% in 2019 compared to 2015 (incidence rate ratio [IRR], 0.22 [95% confidence interval {CI}: .09–.55]). Among 20 590 HIV-negative GBM, HCV incidence was 0.20/100 PY, with no significant change over time. Among 11 661 HIV-negative GBM prescribed PrEP, HCV incidence was 0.29/100 PY. Compared to 2016, incidence among GBM prescribed PrEP declined by 80% in 2019 (IRR, 0.20 [95% CI: .06–.64]).
HCV incidence among GBM living with HIV declined following DAA availability. There was no observed change in HCV incidence among HIV-negative GBM overall. Among GBM prescribed PrEP, incidence declined since the early years of PrEP implementation in Australia. Australia is on track to eliminate HCV among GBM before global 2030 targets.
Hepatitis C virus (HCV) infection has been reported among gay, bisexual, and other men who have sex with men (GBM) globally, and GBM with human immunodeficiency virus (HIV) are disproportionally affected [1]. Prior to the introduction of direct-acting antivirals (DAAs), treatment for HCV was suboptimal with treatment lasting for a year and many side-effects reported, with only 50%–60% of people being cured [2]. With the advent of DAA treatment, >90% of people who undergo treatment are cured, with HIV status not affecting treatment efficacy [3, 4]. This has led to optimism that hepatitis C can be eliminated, and the World Health Organization has set a number of goals, including an 80% reduction in incidence by 2030 relative to a 2015 baseline [5]. It has also been suggested that elimination could be achieved more quickly in key subgroups (known as micro-elimination), including GBM with HIV [6, 7]. Mathematical modeling of HCV incidence in Australia suggests that significant reductions in HCV incidence are feasible among GBM [8]. This is supported by empirical data from primary care clinics in Melbourne, Australia, involved in a real-world study of HCV treatment among people living with HIV, most of whom were GBM [9].
There are few studies with national-level data available to assess changes in HCV incidence among GBM with HIV following the introduction of DAA treatments. A study from the Netherlands in 2018 reported a 51% decrease in incidence in the first year among GBM with HIV following the introduction of HCV DAAs in 2015 [10]. A follow-up study confirmed these initial findings but showed minimal declines in incidence after 2016 [11]. Among GBM with HIV enrolled in the Swiss HIV Cohort, following the removal of HCV treatment restrictions, incidence declined from 0.53/100 PY in 2014 to 0.12/100 PY in 2019 in this group [12]. An analysis of data from 5 clinics in England reported a similar decline in HCV incidence between 2015 and 2018 among GBM with HIV following wider access to DAA treatment [13]. Conversely, among GBM with HIV enrolled in a French cohort study, the incidence of HCV was reported to have increased from 0.32/100 PY in 2012 to 0.84/100 PY in 2018 [14]. While HCV infection is more common among GBM with HIV [1], there have also been reports of HCV infection among HIV-negative GBM acquired via sexual contact, in particular those using HIV preexposure prophylaxis (PrEP) [9, 15, 16]. A systematic review reported a pooled incidence of 1.48/100 PY among HIV-negative GBM using PrEP [1]. To our knowledge, there have been no published studies examining the incidence of HCV among HIV-negative GBM before and after the introduction of HCV DAAs and HIV PrEP.
DAA treatment was subsidized by the Australian government through the Pharmaceutical Benefits Scheme (PBS) (maximum patient cost US$30 per month) from 1 March 2016 with no restrictions to treatment based on liver disease stage or substance use, and reinfection could also be treated through the PBS. Furthermore, treatments were able to be prescribed by nonspecialist primary care providers and were available in general practices and sexual health clinics. HIV PrEP was scaled up in Australia in early to mid-2016 through large implementation trials enrolling 3700 and 3800 predominately GBM [17, 18], and on 1 April 2018, PrEP became widely available through the PBS and could be prescribed by any general practitioner. To understand the impact of DAA treatment on hepatitis C incidence among GBM with HIV, and the impact of PrEP on HCV incidence among HIV-negative GBM, we examined HCV incidence among GBM with HIV from 2009 to 2019, HIV-negative GBM from 2009 to 2019, and GBM prescribed HIV PrEP from 2016 to 2019.
METHODS
Data Source
Data were drawn from the Australian Collaboration for Coordinated Enhanced Sentinel Surveillance of Sexually Transmissible Infections and Blood-borne Viruses (ACCESS), described in detail previously [19, 20]. In brief, ACCESS collates blood-borne virus and sexually transmitted infection (STI) testing data and demographic data from clinics and laboratories, linking data within individuals over time, including between services participating in ACCESS. Ethical approval for ACCESS was received from the Alfred Hospital, University of Tasmania, and Menzies School of Health Research. Ethical reviews were also undertaken by community organizations representing key populations including gay and bisexual men and people living with HIV. The requirement for individual-level consent was waived by all ethics committees.
For these analyses, we utilized data from ACCESS clinics in 7 of 8 Australian states and territories; no HCV testing data among GBM were available from clinics based in the Northern Territory. Data were from males who were defined as being GBM based on being recorded as gay or bisexual in patient management systems and/or reporting 1 or more male partners in the previous 12 months in behavioral surveys at sexual health clinics. A previously validated method based on males having a rectal STI swab for chlamydia or gonorrhea recorded in ACCESS was also used to identify GBM [21]. GBM were defined as being HIV positive if they had a record of an HIV-positive test or a record of an HIV viral load test at a date prior to the HCV test event. GBM were classified as HIV negative at an HCV test event if they had a negative HIV test result recorded at the time of the HCV test or at any time after or within the 12 months prior to the HCV test. GBM whose HIV status was unable to be determined on this basis were excluded (Figure 1).
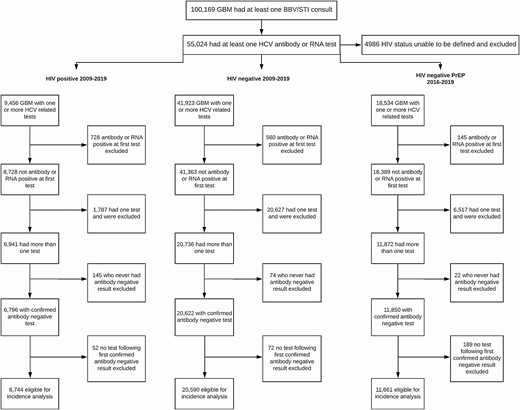
Gay, bisexual, and other men who have sex with men (GBM) included in hepatitis C virus incidence analyses. GBM can be included in >1 analysis depending on their testing history. Abbreviations: BBV, blood-borne virus; GBM, gay, bisexual, and other men who have sex with men; HCV, hepatitis C virus; HIV, human immunodeficiency virus; STI, sexually transmitted infection.
Incidence of HCV Infection Analysis
The outcome for all incidence analyses was a primary (first) incident HCV infection. A primary HCV incident infection was defined as a positive HCV antibody or RNA test following a negative antibody test. GBM were included in the incidence analyses if they tested HCV antibody negative at their first HCV antibody test and had at least 1 subsequent HCV test (antibody or RNA). Depending on HIV status history, GBM could potentially be included in both the HIV-negative and HIV-positive HCV incidence analyses (Supplementary Figure 1A). Those who had a missing or indeterminate HCV antibody test result at their first test were included provided they had a subsequent antibody negative test and an additional test result. GBM entered the incidence analyses on the date of their first confirmed HCV antibody–negative test and were censored at their last HCV test if they remained HCV negative. Specific to the analyses among HIV-negative GBM, those who subsequently had an HIV-positive test result were censored at their previous HCV test event. GBM who were defined as an HCV incident case were censored at a randomly imputed date between their last negative HCV test and diagnosis test date (Supplementary Figure 1B). Due to the date of infection being unknown, the time between tests being variable and overlapping calendar years, the date of infection was randomly imputed 1000 times as has been done previously [22]. The results reported—that is, incidence rates or incidence rate ratios (IRRs)—are the mean of these 1000 imputations, with Rubin’s rules used to calculate confidence intervals (CIs) [23].
Statistical Analyses
Generalized linear modeling (Poisson distribution) was used to examine overall HCV incidence and HCV incidence by calendar year, stratified by HIV status. We then repeated the same analysis with 2015 as a reference category as this was the last year preceding widespread HCV DAA treatment availability and large-scale PrEP implementation in Australia. Finally, we incorporated a piecewise function to examine trends in incidence by continuous calendar year for the periods 2009–2015 and 2016–2019 and to examine any change in the trend between the 2 periods.
HIV Preexposure Prophylaxis
To understand the impact of PrEP on HCV incidence among HIV-negative GBM in more detail, we performed an analysis focused specifically on GBM prescribed PrEP from 2016 to 2019. We included GBM from the year they first had evidence of prescription and in subsequent years, regardless of whether they had evidence of PrEP prescription in the subsequent years (Supplementary Figure 2A). This was done as, from mid-2016 until April 2018, PrEP could primarily only be accessed through implementation studies that included many clinics included in the ACCESS network. However, from April 2018, PrEP was available through any general practitioner, and these prescription data may not have been captured if the clinic was not part of the surveillance system. We also conducted a sensitivity analysis where HCV tests were only included in that year if there was also evidence of PrEP prescription within the surveillance system data in the same year (Supplementary Figure 2B).
For the PrEP-specific analyses, the analyses were the same as the main analyses except the time period was limited to 2016 to 2019, and 2016 was used as a reference category instead of 2015. The trend in incidence rate was assessed from 2016 to 2019 with calendar year included as a continuous variable.
All statistical analyses were performed using Stata S/E 16.1 software (College Station, Texas).
RESULTS
Of 100 169 GBM attending an included clinic, 55 024 had at least 1 HCV antibody or RNA test recorded between 2009 and 2019. HIV status could not be defined for 4986 GBM (9%) and they were excluded from the analysis. An additional 27 757 were excluded from incidence analyses based on either being HCV antibody and/or RNA positive at their first test or only having 1 HCV test, leaving a total of 27 267 GBM attending 42 clinics eligible for incidence analyses (Figure 1). Most GBM (75.5%) were from general practices that specialize in the healthcare of gay and bisexual men as well as gender-diverse people. Another 19.5% were from sexual health clinics. The remaining 5% were from a hospital-based clinic, community health clinic, or general practice.
HCV Incidence Among GBM With HIV
Of 9456 GBM with HIV with at least 1 HCV test, a total of 6744 GBM with HIV were eligible for the incidence analysis (Figure 1). The median time between HCV tests was 10.7 months (interquartile range [IQR], 6.3–16.3 months) with a median of 5 tests (IQR, 3–8) per person. The median time between the previous negative test and diagnosis of an incident case was 8.6 months (IQR, 4.9–17.2 months). There were 33 150 person-years (PY) of follow-up with 290 incident HCV infections identified, resulting in an overall incidence rate of 1.03/100 PY (95% CI: .67–1.60). Incidence was highest in 2010 at 2.12/100 PY and lowest in 2019 at 0.22/100 PY (Figure 2).
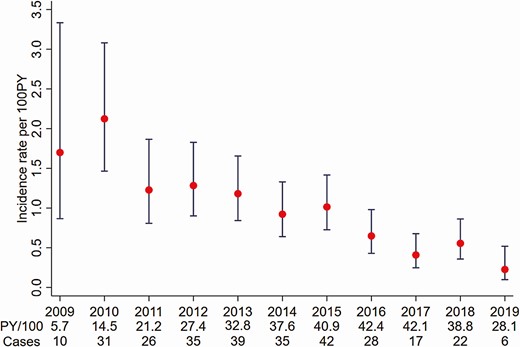
Hepatitis C virus incidence among gay, bisexual, and other men who have sex with men living with human immunodeficiency virus in Australia attending clinics included in the Australian Collaboration for Coordinated Enhanced Sentinel Surveillance of Sexually Transmissible Infections and Blood-borne Viruses (ACCESS), 2009–2019. Abbreviation: PY, person-years.
Compared to 2015, incidence declined by approximately 60% in 2017 (IRR, 0.40 [95% CI: .22–.74]), 45% in 2018 (IRR, 0.55 [95% CI: .32–.95]), and 78% in 2019 (IRR, 0.22 [95% CI: .09–.5]) (Table 1). Results from the piecewise linear trend analysis indicate that there was no significant continuous year-on-year change in incidence from 2009 to 2015 (IRR, 0.89 [95% CI: .60–1.30]) nor from 2016 to 2019 (IRR, 0.80 [95% CI: .41–1.55]). Similarly, there was no significant change in the overall HCV incidence trend between 2009–2015 and 2016–2019 (IRR, 0.90 [95% CI: .46–1.78]).
Hepatitis C Incidence Among Gay, Bisexual, and Other Men Who Have Sex With Men Living With Human Immunodeficiency Virus in Australia, 2009–2019
| Year | Casesa | PY/100a | Incidence Rate (95% CI) | IRRb (95% CI) |
|---|---|---|---|---|
| 2009 | 9.8 | 5.73 | 1.70 (.87–3.33) | 1.68 (.79–3.55) |
| 2010 | 30.8 | 14.49 | 2.12 (1.46–3.08) | 2.09 (1.27–3.45) |
| 2011 | 26.1 | 21.17 | 1.23 (.81–1.87) | 1.21 (.71–2.07) |
| 2012 | 35.3 | 27.44 | 1.28 (.90–1.83) | 1.27 (.78–2.05) |
| 2013 | 38.8 | 32.78 | 1.18 (.84–1.66) | 1.16 (.72–1.88) |
| 2014 | 34.7 | 37.56 | 0.92 (.64–1.33) | 0.91 (.54–1.52) |
| 2015 | 41.5 | 40.88 | 1.01 (.73–1.42) | 1 |
| 2016 | 27.6 | 42.38 | 0.65 (.43–.98) | 0.64 (.37–1.12) |
| 2017 | 17.3 | 42.13 | 0.41 (.25–.68) | 0.40 (.22–.74) |
| 2018 | 21.6 | 38.80 | 0.56 (.36–.86) | 0.55 (.32–.95) |
| 2019 | 6.4 | 28.14 | 0.23 (.10–.52) | 0.22 (.09–.55) |
Abbreviations: CI, confidence interval; IRR, incidence rate ratio; PY, person-years.
aEstimated mean from imputed datasets.
bIRR relative to 2015.
Hepatitis C Incidence Among HIV-Negative GBM
Among 41 923 HIV-negative GBM with at least 1 HCV test, 20 590 HIV-negative GBM were eligible for the incidence analysis (Figure 1). There was a median of 3 (IQR, 2–5) tests per person and the median time between tests was 9.5 months (IQR, 4.2–17.7 months); the median time between a previous negative test and diagnosis of an incident HCV infection was 7.3 months (IQR, 3.3–21.9 months). Over 60 512 PY of follow-up there were 122 incident infections, for an overall incidence of 0.20/100 PY (95% CI: .09–.57). Incidence fluctuated between 0.49/100 PY in 2009 and 0.07/100 PY in 2019 (Figure 3).
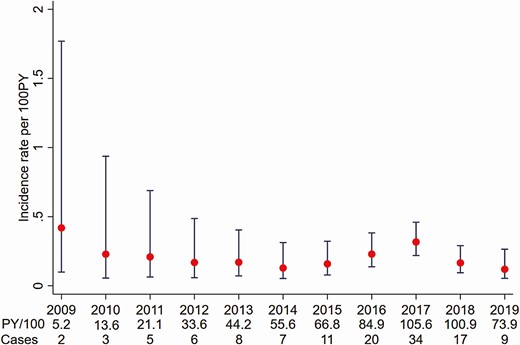
Hepatitis C virus incidence among human immunodeficiency virus–negative gay, bisexual, and other men who have sex with men in Australia attending clinics included in the Australian Collaboration for Coordinated Enhanced Sentinel Surveillance of Sexually Transmissible Infections and Blood-borne Viruses (ACCESS), 2009–2019. Abbreviation: PY, person-years.
Compared to 2015, there was no change in incidence in 2016 (IRR 1.44 [95% CI: .63–3.29]), 2017 (IRR, 1.92 [95% CI: .91–4.00]), or 2018 (IRR, 0.91 [95% CI: .39–2.10]) (Table 2). In the piecewise linear regression analyses, there was no continuous change in the incidence trend from 2009 to 2015 (IRR, 0.84 [95% CI: .47–1.48]) nor from 2016 to 2019 (IRR, 0.70 [95% CI: .36–1.37]). Compared to the trend from 2009 to 2015, there was no change in the trend from 2016 to 2019 (IRR, 0.84 [95% CI: .40–1.76]).
Hepatitis C Incidence Among Human Immunodeficiency Virus–Negative Gay, Bisexual, and Other Men Who Have Sex With Men in Australia, 2009–2019
| Year | Casesa | PY/100a | Incidence Rate (95% CI) | IRRb (95% CI) |
|---|---|---|---|---|
| 2009 | 2.6 | 5.24 | 0.49 (.13–1.82) | 2.92 (.68–12.56) |
| 2010 | 4.8 | 13.58 | 0.34 (.11–1.01) | 2.00 (.56–7.11) |
| 2011 | 5.5 | 21.13 | 0.25 (.09–.73) | 1.47 (.42–5.18) |
| 2012 | 8.1 | 33.54 | 0.24 (.11–.52) | 1.41 (.51–3.93) |
| 2013 | 6.7 | 44.17 | 0.15 (.06–.35) | 0.88 (.30–2.60) |
| 2014 | 7.3 | 55.62 | 0.13 (.06–.29) | 0.76 (.26–2.26) |
| 2015 | 11.4 | 66.73 | 0.17 (.09–.32) | 1 |
| 2016 | 20.7 | 84.80 | 0.24 (.15–.39) | 1.44 (.63–3.29) |
| 2017 | 34.2 | 105.56 | 0.32 (.23–.46) | 1.92 (.91–4.00) |
| 2018 | 15.5 | 100.93 | 0.15 (.09–.26) | 0.91 (.39–2.10) |
| 2019 | 5.2 | 73.82 | 0.07 (.03–.18) | 0.41 (.13–1.27) |
Abbreviations: CI, confidence interval; IRR, incidence rate ratio; PY, person-years.
aEstimated mean from imputed datasets.
bIRR relative to 2015.
Hepatitis C Incidence Among HIV-Negative GBM Using HIV PrEP
From 2016 to 2019, a total of 23 373 GBM were defined as being prescribed PrEP and 18 534 (79.3%) had at least 1 HCV-related test; 11 661 GBM were eligible for the incidence analysis (Figure 1). There were 56 incident cases over 20 886 PY for an overall incidence of 0.29/100 PY (95% CI: .17–.50). As shown in Figure 4, following rates of 0.41/100 PY and 0.44/100 PY in 2016 and 2017, incidence declined to a low of 0.08/100 PY in 2019.
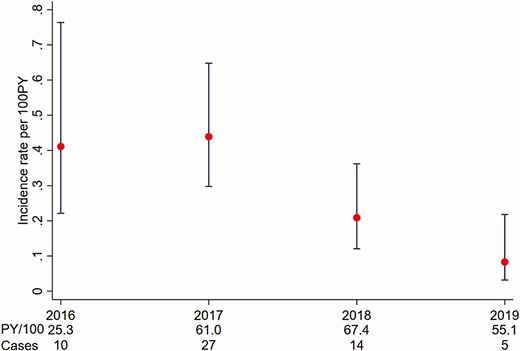
Hepatitis C virus incidence among human immunodeficiency virus–negative gay, bisexual, and other men who have sex with men prescribed preexposure prophylaxis in Australia attending clinics included in the Australian Collaboration for Coordinated Enhanced Sentinel Surveillance of Sexually Transmissible Infections and Blood-borne Viruses (ACCESS), 2009–2019. Abbreviation: PY, person-years.
Relative to 2016, incidence declined by approximately 80% in 2019 (IRR, 0.20 [95% CI: .06–.64]) (Table 3). There was no continuous trend in incidence among GBM prescribed PrEP from 2016 to 2019 (IRR, 0.60 [95% CI: .29–1.24]). The sensitivity analysis included GBM only with evidence of PrEP prescription in the same year as HCV testing and there was little difference in results to the primary analysis among GBM using PrEP (Supplementary Table 1).
Hepatitis C Incidence Among Gay, Bisexual, and Other Men Who Have Sex With Men Using Human Immunodeficiency Virus Preexposure Prophylaxis in Australia, 2016–2019
| Year | Casesa | PY/100a | Incidence Ratea (95% CI) | IRRb (95% CI) |
|---|---|---|---|---|
| 2016 | 10.4 | 25.33 | 0.41 (.22–.76) | 1 |
| 2017 | 26.8 | 60.97 | 0.44 (.30–.65) | 1.07 (.51–2.24) |
| 2018 | 14.1 | 67.49 | 0.21 (.12–.36) | 0.51 (.22–1.16) |
| 2019 | 4.6 | 55.06 | 0.08 (.03–.22) | 0.20 (.06–.64) |
Abbreviations: CI, confidence interval; IRR, incidence rate ratio; PY, person-years.
aEstimated mean from imputed datasets.
bIRR relative to 2016.
DISCUSSION
In our national analysis of HCV incidence from 2009 to 2019 among GBM attending 42 clinics across Australia, we found that HCV incidence among 6744 GBM with HIV declined by 78% in 2019 compared to 2015. There was no significant change in HCV incidence among 20 590 HIV-negative GBM over this time. From 2016 onward, among 11 661 GBM prescribed PrEP, following a peak in the early years of implementation, incidence declined by 80% in 2019 compared to 2016.
Our results among GBM with HIV are consistent with reports from England, the Netherlands, and Switzerland that observed declines in HCV incidence following DAA treatment availability [10, 12, 13]. These data suggest that Australia is on track to achieving HCV micro-elimination, based on an 80% reduction in incidence, among GBM before 2030. While this is encouraging, there continued to be new HCV infections in 2019. Furthermore, like England and the Netherlands, incidence appears to be stabilizing albeit at a low level [11, 13]. This suggests an ongoing need to engage GBM with HIV in routine HCV testing. In addition, immediate treatment of newly diagnosed infections is likely required to achieve further reductions and sustain elimination, as waiting for spontaneous clearance will likely result in further transmission, including potentially reinfection [24].
To date there are limited data comparing HCV incidence among HIV-negative GBM, including both GBM prescribed and not prescribed PrEP, before and after the introduction of HCV DAA treatment and/or HIV PrEP. While not significant, we found that incidence re-peaked among all HIV-negative GBM in 2017 following a period of stable incidence from 2010–2011 to 2016. This may be the result of increased sexual mixing among GBM using PrEP and GBM with HIV. However, a renewed focus on HCV testing among GBM using PrEP is also likely to play a role given that it was part of the protocol for PrEP implementation studies [17, 18]. Specific to GBM prescribed PrEP, from 2016 to 2019 overall incidence was 0.29/100 PY with incidence peaking in 2017 at 0.44/100 PY. Encouragingly this declined to 0.08 cases/100 PY by 2019, which aligns with what was reported among HIV-negative GBM in Australia before HIV PrEP and HCV DAA treatment were available [25]. Our findings align with those from a recent Australian study limited to 4 sites; among 2058 GBM, HCV incidence was 0.38/100 PY [9]. These findings suggest that universal, unrestricted HCV treatment among GBM with HIV may also have a treatment-as-prevention benefit for GBM more broadly. Our findings, however, contrast with those in Europe. HCV incidence among 350 GBM using PrEP in the Netherlands has been reported to be 1.27/100 PY [15], and analysis of HCV incidence from the Pre-exposure Option for Reducing HIV in the UK (PROUD) study in England reported an overall incidence of 1.9/100 PY among 490 GBM [22]. It is likely that HCV among GBM using PrEP is concentrated among a subgroup of GBM who engage in a range of sexual behaviors, including drug use before and/or during sex [9, 15], and these earlier, smaller studies are more representative of these groups than our larger population-level study.
This disparity in findings between Australian and European settings needs to also be interpreted accounting for the broader context of both HCV DAA treatment and PrEP availability. As noted previously, HCV treatment was funded in Australia from March 2016 with no treatment restrictions, including for reinfection. Large-scale PrEP implementation studies enrolling approximately 3700 [18] and 3800 [17] mainly GBM also commenced in mid-2016. The PROUD study from England enrolled people from late 2012 to early 2014; the study from the Netherlands enrolled people from mid-2015 to mid-2016. HCV DAA treatment was not broadly available at the time of the English study and treatment for HCV reinfection was not government-funded in England until late 2019 [13]. HCV DAA treatment was funded nationally in the Netherlands from 2015 and while high treatment uptake was reported among GBM with HIV, this predominately occurred in the first quarter of 2016 [26]. This potentially provided a time period where there may have been increased sexual mixing among GBM using PrEP and GBM with HIV who were yet to be treated for HCV. This is shown in phylogenetic analyses with high overlap of HCV among both GBM with HIV and HIV-negative GBM using PrEP [15].
Our analyses have some limitations that need to be considered. First, although these analyses indicate that among people who are retesting the time between tests is often within 12 months, not all GBM with HIV tested annually as recommended, which may limit the generalizability of our findings to the broader population of GBM with HIV. Second, a considerable number of HIV-negative GBM only had 1 test recorded including 35% of GBM prescribed PrEP; therefore, our findings may not be representative of all GBM using PrEP. Third, although we have data for many people who were prescribed PrEP, we cannot make confident assumptions that all HIV-negative GBM without these data were not using PrEP, thus limiting our ability to directly compare HCV incidence among HIV-negative GBM using and not using PrEP. Finally, while this is the largest and most representative study of HCV incidence among GBM in Australia undertaken to date, most data are from New South Wales and Victoria. In addition, most sites are in urban areas, with the remainder being in large regional areas. Although this is largely representative of the geographic distribution of GBM in Australia [27], further work may be justified to explore geographic differences in HCV awareness, testing, and incidence among GBM.
CONCLUSIONS
HCV incidence among GBM living with HIV has declined significantly in Australia following the introduction of DAA treatment. Despite concerns in other countries, incidence among HIV-negative GBM has declined since renewed peaks following large real-world PrEP implementation studies. These data are indicative of Australia being on track to achieve HCV elimination among GBM before 2030.
Supplementary Data
Supplementary materials are available at Clinical Infectious Diseases online. Consisting of data provided by the authors to benefit the reader, the posted materials are not copyedited and are the sole responsibility of the authors, so questions or comments should be addressed to the corresponding author.
Notes
Author contributions. Conceptualization: B. L. H., R. S.-D., M. S., M. E. H., J. S. D. Methodology: B. L. H., R. S.-D., D. K. v. S., M. T., A. L. W. Data analysis: B. L. H. Data interpretation: B. L. H., R. S.-D., M. E. H., J. S. D. Data collection: C. K. F., N. R., M. B. Data curation: M. T., J. A., C. E.- H. Funding acquisition: B. D., R. G., M. S., M. E. H. Writing of the original draft: B. L. H. Review and editing of the manuscript: All authors.
Acknowledgments. The authors acknowledge the contribution of the ACCESS research team and advisory committee members who are not co-authors of this article including: Lisa Bastian, Western Australia Health; Deborah Bateson, Family Planning New South Wales (NSW); Scott Bowden, Doherty Institute; Mark Boyd, University of Adelaide; Denton Callander, Kirby Institute, University of New South Wales (UNSW) Sydney; Allison Carter, Kirby Institute, UNSW Sydney; Aaron Cogle, National Association of People With HIV Australia; Jane Costello, Positive Life NSW; Wayne Dimech, National Reference Laboratory; Jennifer Dittmer, Burnet Institute; Jeanne Ellard, Australian Federation of AIDS Organisations; Lucinda Franklin, Victorian Department of Health; Jules Kim, Scarlet Alliance; Scott McGill, Australasian Society for HIV Medicine; David Nolan, Royal Perth Hospital; Prital Patel, Kirby Institute, UNSW Sydney; Stella Pendle, Australian Clinical Laboratories; Victoria Polkinghorne, Burnet Institute; Long Nguyen, Burnet Institute; Thi Nguyen, Burnet Institute; Catherine O’Connor, Kirby Institute, UNSW Sydney; Philip Reed, Kirkton Road Centre; Nathan Ryder, NSW Sexual Health Service Directors; Christine Selvey, NSW Ministry of Health; Toby Vickers, Kirby Institute, UNSW Sydney; Melanie Walker, Australian Injecting and Illicit Drug Users League; Lucy Watchirs-Smith, Kirby Institute, UNSW Sydney; Michael West, Victorian Department of Health. The authors also acknowledge all clinics participating in ACCESS, including those that contributed data to this analysis (Northside, Prahran Market Clinic, The Centre Clinic, Bendigo Community Health, EACH Social and Community Health, Frankston Health Care, Dandenong Super Clinic, Pronto, Flemington Medical Clinic, Barwon Drug and Alcohol Service, Docker St Medical Clinic, Co-health, Clarinda Medical Clinic, Genesis Medical Clinic, Melbourne Sexual Health Centre, Lygon Court Medical Clinic, Access Health, Alfred Hospital, East Sydney Doctors, Macleay Primary Health Care, Fountain General Practice, Bungendore Medical Centre, Taylor Square Private Clinic, Burwood Road General Practice, Waterloo Medical Clinic, Holdsworth House Medical Practice, Royal Prince Alfred Sexual Health Centre, Western Sydney Sexual Health Centre, Hunter New England Sexual Health Centre, Northern NSW Sexual Health Centre, Murrumbidgee Sexual Health Centre, Nepean Sexual Health Centre, Western Health District Sexual Health Centre, O’Brien St General Practice, Rapido Testing Service, Adelaide Sexual Health Centre, M clinic, GP on Beaufort, Clinic 30, Stonewall Medical Centre, and Tasmanian Sexual Health Centres). ACCESS is a partnership between the Burnet Institute, Kirby Institute, and National Reference Laboratory.
Disclaimer. The funders had no role in these analyses, and the views expressed are those of the authors.
Financial support. ACCESS is funded by the Department of Health, Australian Government. B. L. H., R. S.-D., M. T., C. E.-H., B. D., M. E. H., and J. S. D. receive support from the Australian National Health and Medical Research Council. The Burnet Institute acknowledges support from the Victorian Government Operational Infrastructure Fund.
Potential conflicts of interest. M. T. has received speaker’s honoraria and support to attend the 2019 Hitos en Investigación Básica y Clínica en VIH/SIDA conference from Gilead Sciences. G. M. has received grants from Gilead Sciences and AbbVie Inc paid to her institution and payment from Janssen for chairing a meeting. M. S. served as an advisory board member for and received honoraria from Gilead Sciences, and has received investigator-initiated funding from Gilead Sciences, AbbVie, and Bristol-Myers Squibb (BMS). M. E. H. has received investigator-initiated funding from Gilead Sciences, Merck, AbbVie, and BMS. J. S. D. has received investigator-initiated funding from AbbVie, BMS, Gilead Sciences, and Merck; consultancies from Gilead Sciences and AbbVie; and support for attending meetings and/or travel from Gilead Sciences. D. K. v. S. reports payment to her institution (Public Health Service of Amsterdam) for Liver debate, sponsored by Gilead, AbbVie, and Norgine. M. B. reports grants paid to his institution for clinical research from Gilead Sciences, ViiV Healthcare, MSD, AbbVie, Eli Lilly, Novartis, and Pfizer; has received consulting fees for attendance at medical advisory boards from Gilead Sciences, ViiV Healthcare, and AbbVie; has received payment or honoraria from presentations/lectures from Gilead Sciences and AbbVie; and has received payments to attend scientific meetings or advisory boards from Gilead Sciences, ViiV Healthcare, and GSK. All other authors report no potential conflicts of interest.
All authors have submitted the ICMJE Form for Disclosure of Potential Conflicts of Interest. Conflicts that the editors consider relevant to the content of the manuscript have been disclosed.
References
Author notes
M. E. H. and J. S. D. contributed equally to this work as co–senior authors.

