


Abstract
The effectiveness of enhanced terminal room cleaning with ultraviolet C (UV-C) disinfection in reducing gram-negative rod (GNR) infections has not been well evaluated. We assessed the association of implementation of UV-C disinfection systems with incidence rates of hospital-onset (HO) GNR bloodstream infection (BSI).
We obtained information regarding UV-C use and the timing of implementation through a survey of all Veterans Health Administration (VHA) hospitals providing inpatient acute care. Episodes of HO-GNR BSI were identified between January 2010 and December 2018. Bed days of care (BDOC) was used as the denominator. Over-dispersed Poisson regression models were fitted with hospital-specific random intercept, UV-C disinfection use for each month, baseline trend, and seasonality as explanatory variables. Hospitals without UV-C use were also included to the analysis as a nonequivalent concurrent control group.
Among 128 VHA hospitals, 120 provided complete survey responses with 40 reporting implementations of UV-C systems. We identified 13 383 episodes of HO-GNR BSI and 24 141 378 BDOC. UV-C use was associated with a lower incidence rate of HO-GNR BSI (incidence rate ratio: 0.813; 95% confidence interval: .656–.969; P = .009). There was wide variability in the effect size of UV-C disinfection use among hospitals.
In this large quasi-experimental analysis within the VHA System, enhanced terminal room cleaning with UV-C disinfection was associated with an approximately 19% lower incidence of HO-GNR BSI, with wide variability in effectiveness among hospitals. Further studies are needed to identify the optimal implementation strategy to maximize the effectiveness of UV-C disinfection technology.
The hospital environment has been increasingly recognized as an important contributor to healthcare-associated infections (HAIs) and transmission of microorganisms, particularly multidrug-resistant organisms (MDROs) [1, 2]. Previous studies indicate that patients are at increased risk of MDRO acquisition when their rooms had been previously occupied by other patients infected or colonized by those microorganisms [2, 3]. This can be attributed to nosocomial pathogens’ ability to survive on inanimate surfaces for prolonged periods [4], inadequate cleaning of hospital rooms between patient stays [5], and possible transmission via contaminated surfaces despite routine cleaning practices [6, 7].
Manual cleaning with disinfectants registered with the US Environmental Protection Agency (EPA) is widely regarded as standard practice. Still, previous studies suggest that adequacy of cleaning is often suboptimal, particularly when the focus is only on high-touch surfaces [1, 6]. In addition, it is challenging to standardize the quality of manual cleaning and assure cleanliness [8]. Enhanced terminal room cleaning, which is after patient discharge, with no-touch technologies, such as ultraviolet C (UV-C) or hydrogen peroxide (H2O2) disinfection, have recently been utilized to supplement manual cleaning, increase the cleanliness of the hospital room environments, and reduce the transmission of important nosocomial pathogens, particularly Clostridioides difficile or vancomycin-resistant enterococci (VRE) [9–11]. A recent meta-analysis concluded that enhanced terminal room cleaning with UV-C or H2O2 disinfection is associated with reductions in incidence rates of infections due to C. difficile or VRE infections [12], although the effect size widely varied among individual studies [13–17]. In addition, the effectiveness of UV-C in reducing a critically important group of environmental pathogens, namely, gram-negative rods, is yet to be assessed. We aimed to determine the association of UV-C disinfection systems implemented during terminal cleaning with the incidence of hospital-onset gram-negative rod bloodstream infection (HO-GNR BSI) within the nationwide Veterans Health Administration (VHA) System over a 9-year period.
METHODS
Data Sources and Study Population
In January 2017, the VHA Healthcare Analysis and Information Group (HAIG) conducted a mandatory survey of all VHA hospitals to assess status and needs in the implementation of infection control practices, which included whether a hospital had implemented a UV-C disinfection system. To collect information on the details of UV-C system utilization and date of implementation, we sent a second voluntary survey to the environmental service chiefs at hospitals that indicated they used or had used the UV-C system in the responses to the HAIG survey using Research Electronic Data Capture (REDCap) hosted by the University of Iowa (Supplementary Material) [18, 19]. This survey was conducted in the first quarter of the calendar year 2019. Hospitals were asked to provide information about the specific type of UV-C system (if known to survey respondents), timing (month and year) of introduction, and timing of cessation (if applicable). Hospitals that provided only partial responses or did not provide acute care were excluded from the study. During the study period, all VHA hospitals were required to follow the Centers for Disease Control and Prevention’s (CDC's) Guidelines for Environmental Infection Control in Health-Care Facilities, but otherwise there had been no VHA-specific guidelines or protocols for environmental cleaning.
To identify cases of HO-GNR BSI, we extracted data from the Corporate Data Warehouse (CDW), an integrated infrastructure system from VHA's electronic medical records, as described previously [20]. We also obtained data for monthly BDOC at each hospital as denominators from CDW.
Study Design
To assess the effect of UV-C disinfection systems, accounting for variable implementation dates, we used a quasi-experimental stepped wedge interrupted time-series analysis design. We included both hospitals with and without UV-C disinfection systems in the analysis, considering the former group as the intervention group, and the latter as the non-equivalent concurrent control group. We analyzed clinical data from a retrospective cohort of all patients admitted to these hospitals between January 2010 and December 2018.
The primary exposure was the presence or absence of a UV-C system in each hospital and timing of implementation as determined in the 2-stage survey process described above. We considered an incidence rate of HO-GNR BSI (definitions below, as a surrogate measure for severe nosocomial infections due to GNR pathogens), as the primary outcome with bed days of care (BDOC) as the denominator. We also assessed subgroups for BSIs with Escherichia coli, Klebsiella spp., and non-fermenting GNRs (Pseudomonas spp., Acinetobacter spp., Achromobacter spp., Sphingomonas spp., Burkholderia spp., and Stenotrophomonas spp.) as secondary outcomes. We included these conditions a priori as previous studies have shown that these 3 pathogens or groups represent the majority of GNR BSIs across various healthcare settings [21–23].
Variable Definitions
We defined HO-GNR BSI as the first positive blood culture for any GNR organisms more than 48 hours following admission to an acute inpatient unit. Multiple positive blood cultures for the same organism during 1 hospital admission were considered a single episode of a bloodstream infection.
Statistical Analyses
Hospital characteristics based on the presence or absence of a UV-C system were compared using Student t test for continuous variables and χ2 test or Fisher exact test for categorical variables.
Mixed-effect over-dispersed Poisson (quasi-Poisson) regression models were fitted with baseline trends, a dummy variable for presence or absence of a UV-C system, and the number of months after UV-C system introduction for each month. The month of the year was also included as a categorical variable to account for seasonality. Hospital-specific random intercepts were included to account for clustering effects at each hospital. We also included hospital-specific random coefficients for baseline trend and UV-C system use to account for potentially variable baseline trends and intervention effects among hospitals (Supplementary Figure 1). BDOC was included in the model as the offset (denominator) variable. Hospital-specific HO-GNR BSI incidence rate ratios associated with the presence of a UV-C system were calculated from estimated population fixed-effect and hospital-specific random effect coefficients, and confidence intervals were calculated with bootstrapping method by randomly resampling hospitals 1000 times. We also performed stratified analyses by classifying hospitals into high and low baseline incidence rates based on the median incidence rate in the year 2010 prior to the implementation of UV-C. This analysis would help detect possible biases such as selection-regression. All P-values are two-sided, and the significance level was set at .05. All statistical analyses were performed using R version 4.1.2 (R Foundation for Statistical Computing, Vienna, Austria) and glmmTMB package [24].
Ethics
The institutional review board at the University of Iowa and the Research and Development Committee at the Iowa City Veterans Affairs Health Care System approved this study and granted a waiver for informed consent for this retrospective cohort study with minimal risk.
Role of the Funding Source
The funding source had no role in the design of this study and did not have any role during its collection, management, analysis, interpretation of the data, or decision to submit results.
RESULTS
One hundred twenty-eight VHA hospitals responded to the initial mandatory HAIG survey. Among 48 hospitals that indicated use of UV-C systems, 8 were excluded due to incomplete responses to the secondary survey or the lack of acute care units; thus, 120 hospitals (40 hospitals with UV-C systems and 80 hospitals without) were included in our analysis (Figure 1). Table 1 summarizes hospital demographic characteristics by UV-C exposure status. Baseline differences in size, teaching status, rural/urban location, and hospital complexity level between hospitals with and without UV-C usage were statistically unremarkable. These 120 hospitals reported a total of 24 141 378 BDOC during the study period.
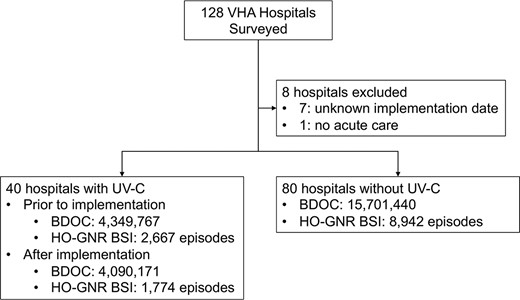
Assignment of VHA hospitals and number of extracted patients. Abbreviations: BDOC, bed days of care; HO-GNR BSI, hospital-onset gram-negative rod bloodstream infection; UV-C, ultraviolet C; VHA, Veterans Health Administration.
Demographic Characteristics of Veterans Health Administration Acute Care Hospitals, 2010–2018
| Characteristic | UV-C n = 40 | No UV-C n = 80 | P value |
|---|---|---|---|
| Number of operating beds | 180 [116–373] | 266 [156–363] | .68 |
| Teaching hospitals | 37 (92.5) | 66 (82.5) | .14 |
| Rural hospitals | 10 (25.0) | 16 (20.0) | .53 |
| Transplant programs | 6 (15.0) | 7 (8.8) | .35 |
| Hospitals with ICUs | 37 (92.5) | 63 (78.8) | .06 |
| Hospital complexity levela | |||
| ȃ1a | 12 (30.0) | 23 (28.8) | .89 |
| ȃ1b | 7 (17.5) | 14 (17.5) | >.99 |
| ȃ1c | 13 (32.5) | 17 (21.3) | .18 |
| ȃ2 | 5 (12.5) | 12 (15.0) | .71 |
| ȃ3 | 3 (7.5) | 14 (17.5) | .14 |
| HO-GNR BSI episodes | |||
| ȃBefore UV-C Implementation | 2667 | 8942 | |
| ȃAfter UV-C Implementation | 1774 | N/A | |
| BDOC | |||
| ȃBefore UV-C Implementation | 4,349,767 | 15,701,440 | |
| ȃAfter UV-C Implementation | 4,090,171 | N/A | |
| Incidence rates of HO-GNR BSI (per 10 000 BDOC) | |||
| ȃBefore UV-C implementation | 6.16 | 5.70 | |
| ȃAfter UV-C implementation | 4.34 | N/A |
Data presented as no. (%) or median [interquartile range].
Abbreviations: BDOC, bed days of care; HO-GNR BSI, hospital-onset gram-negative rod bloodstream infection; ICU, intensive care unit; UV-C, ultraviolet C.
A 5-point ordinal scale that incorporates levels of hospital services, patient volume, intensive care and surgical services, patient risk, and resident or research involvement. 1a: Highest complexity, 1b: Very high complexity, 1c: High complexity, 2: Medium complexity, 3: Lowest complexity.
UV-C use was reported from 40 hospitals with various implementation start dates (June 2010 to June 2017; Figure 2). One facility discontinued UV-C use in 2017, and the maximum number of facilities with UV-C at 1 time during the study period was 39. Two types of automated UV-C disinfection technology were identified: xenon pulsatile UV-C illumination for 24 hospitals, continuous UV-C illumination for 10, and more than 1 technology for 2 hospitals. Respondents could not provide technology-type information at 4 hospitals, but were still included in the analysis.
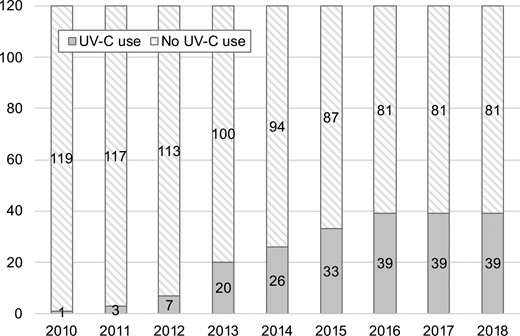
Number of hospitals that introduced UV-C disinfection between 2010 and 2018. Abbreviations: UV-C, ultraviolet C; VHA, Veterans Health Administration.
We identified 25 401 positive blood cultures for GNR, which represented 13 383 HO-GNR BSI episodes. The overall incidence rate of HO-GNR BSI was 5.54 episodes per 10 000 BDOC. Hospitals that introduced UV-C during the study period had 6.13 episodes per 10 000 BDOC before implementation of UV-C (interquartile range [IQR] of hospital-specific incidence rate: 2.34–6.85 per 10 000 BDOC), which declined to 4.34 episodes per 10 000 BDOC after implementation (IQR: 1.73–5.18 per 10 000 BODC) (Supplementary Figure 2). Hospitals without UV-C had 5.70 episodes per 10 000 BDOC (IQR: 2.21–5.88 per 10 000 BODC). The population-average baseline trend was down-trending (incidence rate ratio [IRR] per month: 0.996 [95% confidence interval {CI}: .994–.997]), indicating there was a −0.43% decline in HO-GNR BSI incidence rates per month even without implementation of UV-C (95% CI: −.49% to −.37% per month). Implementation of UV-C was significantly associated with an approximately 19% decline in incidence rates of HO-GNR BSI (IRR: 0.813 [95% CI: .656 to .969], P = .009; Table 2). Facility-specific association ranged from a 30.7% decline to an 8.3% increase (median: 19.3% decline; IQR: −23.9% to −14.2%; Figure 3), suggesting variable effects across the VHA system. Based on CIs estimated from bootstrapping, 23 hospitals among 40 had statistically significant decline of HO-GNR BSI incidence rates (Figure 3). The effect of UV-C attenuated after implementation by 0.55% per month (95% CI: .24% to .85% per month), nearly offsetting the baseline effect and making the incidence rates of HO-GNR BSI stable.
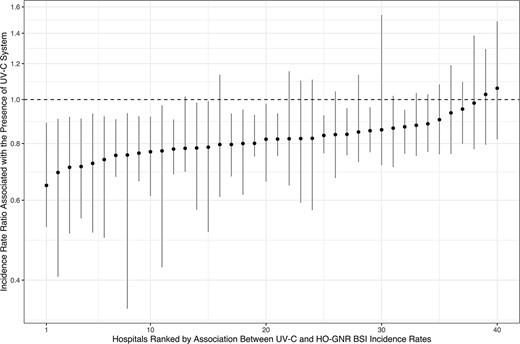
Hospital-specific estimates of associations between UV-C system implementation and HO-GNR BSI incidence rates. Abbreviations: HO-GNR BSI, hospital-onset gram-negative rod bloodstream infection; UV-C, ultraviolet C.
Association Between Automated Ultraviolet-C Disinfection Use and Monthly Incidence Rates of each Measurement
| Outcome | Incidence Rate Ratio (95% CI) | P value |
|---|---|---|
| Primary outcome | ||
| ȃHO-GNR BSI | 0.813 [.656–.969] | .009 |
| Secondary outcomes | ||
| ȃEscherichia coli BSI | 0.885 [.737–1.062] | .19 |
| ȃKlebsiella spp. BSI | 0.892 [.751–1.061] | .20 |
| ȃNon-fermenting GNR BSI | 0.665 [.534–.830] | <.001 |
Abbreviations: BSI, bloodstream infection; CI, confidence interval; HO-GNR, hospital-onset gram-negative rod.
When hospitals were classified into 2 groups, those with high and low baseline incidence rates (which included 20 hospitals with UV-C and 40 hospitals without in each group), there was still a significant association between UV-C implementation and decreased incidence rates of HO-GNR BSI among hospitals with high baseline incidence rates (IRR: 0.809 [95% CI: .658 to .960], P = .006). However, this association was not statistically significant among hospitals with low baseline incidence rates although the estimated effect size was nearly identical to the hospital group with high baseline incidence rates (IRR: 0.779 [95% CI: .197 to 1.361], P = .400).
In subgroup analyses by organism groups, there was a significant association between UV-C implementation and a 33.5% reduction in incidence rates of non-fermenting GNR bloodstream infection (IRR 0.665 [95% CI: .534 to .830], P < .001). This effect also attenuated after UV-C implementation by 0.73% per month (95% CI: .16% to 1.32% per month), suggesting the incidence rate of HO-GNR BSI reached a near plateau afterward. However, the association between UV-C use and incidence rates of HO E. coli and HO Klebsiella spp. bloodstream infections were not significant (E. coli: IRR: 0.885 [95% CI: .737 to 1.062], P = .19; Klebsiella spp.: IRR: 0.892 [95% CI: .751 to 1.061], P = .20).
DISCUSSION
In this stepped-wedge time-series analysis at a large integrated healthcare system, we found that automated UV-C disinfection in the terminal room cleaning process was associated with a 19% lower incidence rate of HO-GNR BSI. With 40 hospitals in the intervention group and 80 hospitals in the concurrent control group, this is the largest study to the best of our knowledge to evaluate the implementation effectiveness of UV-C disinfection on a clinically important group of environmental organisms, gram-negative rods. This reduction was primarily driven by declines in non-fermenting GNR organisms, as UV-C implementation was not associated with significant reductions in the incidence rates of E. coli and Klebsiella spp. bloodstream infection.
The differences in the effect on the incidence of these organisms may reflect the epidemiology of bloodstream infections caused by these pathogens in hospital settings. E. coli and Klebsiella spp. are found in many community- and hospital-acquired infections and are thought to arise from endogenous sources (eg, intestinal tract) to cause infections such as community-acquired urinary tract infections (UTIs) [22, 25]. On the contrary, non-fermenting GNR organisms, such as P. aeruginosa, Acinetobacter spp., and S. multophilia, are predominantly found in the hospital environment, especially in water-associated areas (eg, sinks) [7, 26, 27]. Additionally, previous studies have shown that non-fermenting pathogens could survive on surfaces for longer periods than lactose-fermenting pathogens [4], and UV-C disinfection significantly reduced the microbiologic burden of these non-fermenting GNRs on inanimate surfaces [28]. Thus, it is very plausible that the reduced organism burden in the hospital environment from UV-C disinfection resulted in lower incidence rates of HO-GNR BSI.
Another important finding in our study was the heterogenous effect sizes in the association between UV-C disinfection use and HO-GNR BSI incidence rates, suggesting that effectiveness may vary based on how hospitals implement UV-C disinfection systems in their cleaning processes. Several studies have evaluated the efficacy of UV-C disinfection against GNR organisms. A systematic review published in 2018, which included two primary studies, did not show a statistically significant reduction in infections due to MDRO Gram-negative pathogens [12, 29, 30]. Two more recent studies indicated a possible decrease in GNR infections after implementation of UV-C disinfection [31, 32]; however, both were single-center studies with a before-and-after design without a control group, which did not allow the authors to draw solid conclusions regarding a direct causal relationship between UV-C and the reduction of MDRO Gram-negative pathogens. Our findings of heterogeneous effects may explain these conflicting results from previous single-center studies and suggest a need to evaluate optimal implementation strategies to maximize the effectiveness of UV-C and other enhanced cleaning technologies.
The stratified analysis of hospitals with high and low baseline incidence rates showed that the estimated effect sizes of both groups were nearly identical, although the association between UV-C disinfection and decreased HO-GNR BSI incidence rates was not statistically significant among the low baseline incidence rate group, most likely due to the small number of outcome events. However, similar effect sizes in high and low baseline performing hospitals suggest regression to the mean was not the main driver of the association between UV-C systems and lower BSI incidence.
The strength of our study is that we included an outcome with direct clinical relevance, HO-GNR BSI, in our analysis. Only a few studies have investigated the impact of UV-C disinfection on clinical outcomes outside of C. difficile infection. Microbiologically confirmed HO-GNR BSI is generally a direct result of true infections, strengthening its validity as a clinical outcome. Direct clinical effectiveness is an important outcome when considering options for environmental cleaning in hospital settings, and there has been increasing interest in incorporating HO-BSI as a surveillance target and a potentially less biased quality metric [33, 34]. In addition, our study was conducted in diverse care settings at 120 hospitals in the United States, which should enhance the generalizability of these findings.
In this study, we focused on HO-GNR BSI and did not investigate the incidence rates of C. difficile or VRE for two reasons. First, several other studies had already assessed the association between enhanced terminal cleaning and incidence rates of C. difficile or VRE infections [12–15]. Second, C. difficile and VRE had variable detection thresholds among facilities, which do not allow us to apply the current study design. For example, there are several acceptable protocols for the diagnosis of C. difficile, such as C. difficile toxin A/B assay, positive polymerase chain reaction, or 2- or 3-step algorithms combining them. There is no standardized protocol among VHA facilities. In addition, many VHA facilities had changed their local diagnostic protocols for C. difficile over time. Similarly, some VHA facilities implemented screening of VRE for high-risk patients, and we could not separate clinical specimens and screening specimens reliably.
The present study had some limitations. First, because of the retrospective nature of this study, possible external confounders, such as policy changes in other cleaning techniques and healthcare worker hand hygiene compliance, might exist. As a previous study showed, the nationwide expansion of infection control resources at the VHA System in 2007 had a significant impact on incidence rates of HO-GNR BSI [20]. However, there have been no major changes in the national policy or resource availability within the VHA since the beginning of our analyzed cohort in 2010. The interrupted time-series design, along with the over-dispersed Poisson regression models that we used, is one of the most robust study designs outside of randomized controlled studies [35], and the variable introductory timing of the UV-C system at the individual hospitals reduces the likelihood that implementation of other national policies or interventions influenced the reported association. Second, no information regarding additional implementation strategies that supplemented UV-C system use, such as audit and feedback, was available except for a few anecdotal reports from a limited number of facilities. Because of high acquisition costs, some hospitals introduced UV-C systems in only limited high-risk areas, such as intensive care units (ICUs), hematology/oncology units, or operating rooms. On the other hand, some other hospitals aggressively implemented it beyond the typical terminal cleaning process, such as irradiation when patients briefly vacated their rooms for diagnostic tests. As suggested in our facility-specific estimates for the associations between UV-C systems and HO-GNR BSI incidence rates, it is conceivable that this practice variation affected the effectiveness in these diverse clinical settings. Further studies are needed to investigate associations between implementation practices of UV-C systems and outcomes, to establish optimal implementation strategies. Third, our survey only asked respondents to provide the month and year of the implementation, and it is conceivable that the first month of the intervention period could be effectively misclassified if the implementation occurred at the end of the month. However, we believe the impact of this potential misclassification is minimal, and it only biases the estimated association between UV-C systems and HO-GNR BSI incidence rates toward the null. Finally, most hospitals that implemented UV-C systems in our study had relatively low incidence rates of HO-GNR BSI even before introducing the UV-C system, compared to reported incidence rates in previous studies [36, 37]. This can raise a concern regarding the generalizability of our study to hospitals with higher baseline incidence rates of HO-GNR BSI. However, these results make our study less susceptible to selection-regression bias, also known as a regression-to-the-mean phenomenon.
In conclusion, in a study of 120 hospitals we found that enhanced terminal room cleaning with UV-C disinfection was associated with HO-GNR BSI incidence reduction, primarily driven by non-fermenting GNR bloodstream infection. However, the effect of UV-C at each hospital varied, suggesting the implementation strategy substantially affects effectiveness. Further studies are needed to elucidate optimal implementation strategies and comparative effectiveness of various UV-C technologies.
Supplementary Data
Supplementary materials are available at Clinical Infectious Diseases online. Consisting of data provided by the authors to benefit the reader, the posted materials are not copyedited and are the sole responsibility of the authors, so questions or comments should be addressed to the corresponding author.
Notes
Acknowledgments. The authors thank the Institute for Clinical and Translational Science (ICTS) at the University of Iowa for using REDCap for data collection.
VA-CDC Practice-Based Research Network Members:
Suzanne F. Bradley, Ann Arbor VA Health Care System
Daniel Morgan, VA Maryland Health Care System
Kalpana Gupta, Boston VA Health Care System
Christopher Hostler, Durham VA Health Care System
Charlesnika Evans, Hines VA Health Care System
Matthew Goetz, Greater LA VA Health Care System
Heather Reisinger, Iowa City VA Health Care System
Nasia Safdar, Madison VA Health Care System
Gio J. Baracco Lira, Miami VA Health Care System
Aaron DeVries, Minneapolis VA Health Care System
Bryan Harris, Nashville VA Health Care System
Marvin Bittner, VA Nebraska-Western Iowa Health Care System
Christopher Pfeiffer, Portland VA Health Care System
Michael Rubin, Salt Lake City VA Health Care System
Jose Cadena-Zuluaga, San Antonio VA Health Care System
Katie Suda, Pittsburgh VA Health Care System
Financial support. This work was supported by the Agency for Healthcare Research and Quality (AHRQ; grant number K08HS027472 to M. G.), the US Centers for Disease Control and Prevention (CDC) through the VA-CDC Practice-Based Research Network program (reported by E. N, P.), and the U.S. Department of Veterans Affairs through the Quality Enhancement Research Initiative (QUERI) program (QUE 15–269) (reported by E. N. P.). N. S. reports support from VA QUERI.
Potential conflicts of interest. M. G. reports grants or contracts from Merck Investigator Study Program (paid to institution). All other authors report no potential conflicts.
All authors have submitted the ICMJE Form for Disclosure of Potential Conflicts of Interest. Conflicts that the editors consider relevant to the content of the manuscript have been disclosed.
References
Author notes
M. G, and S. H. contributed equally to this work.
Study Group team members are listed in the Acknowledgments.

