


Abstract
The expansion of the US opioid epidemic has led to significant increases in infections, such as infective endocarditis (IE), which is tied to injection behaviors. We aimed to estimate the population-level IE mortality rate among people who inject opioids and compare the risk of IE death against the risks of death from other causes.
We developed a microsimulation model of the natural history of injection opioid use. We defined injection behavior profiles by both injection frequency and injection techniques. We accounted for competing risks of death and populated the model with primary and published data. We modeled cohorts of 1 million individuals with different injection behavior profiles until age 60 years. We combined model-generated estimates with published data to project the total expected number of IE deaths in the United States by 2030.
The probabilities of death from IE by age 60 years for 20-, 30-, and 40-year-old men with high-frequency use with higher infection risk techniques compared to lower risk techniques for IE were 53.8% versus 3.7%, 51.4% versus 3.1%, and 44.5% versus 2.2%, respectively. The predicted population-level attributable fraction of 10-year mortality from IE among all risk groups was 20%. We estimated that approximately 257 800 people are expected to die from IE by 2030.
The expected burden of IE among people who inject opioids in the United States is large. Adopting a harm reduction approach, including through expansion of syringe service programs, to address injection behaviors could have a major impact on decreasing the mortality rate associated with the opioid epidemic.
The epidemiology of the United States opioid epidemic has expanded from oral ingestion of prescription opioids to injection of illicitly produced opioids, such as heroin and fentanyl [1]. As a result, serious bacterial infections, such as infective endocarditis (IE) and skin and soft tissue infections (SSTIs), have become among the most common medical complications in persons who inject drugs (PWID) [2, 3]. In recent years, hospitalizations for injection-related IE have increased significantly, up 12-fold in some states [4]. As such, costs of these infections have grown and may be as high as $400 000 000 per year for individual states [5].
Many individuals, even those on medications for opioid use disorder (MOUD), do not always completely abstain from drug use for sustained periods [6–8]. Therefore, greater attention needs to be paid to the details of injection opioid use—injection frequency, sterile injection practices, and sharing injection equipment—which are important, potentially modifiable factors that can impact outcomes [9–11]. As the US opioid epidemic continues to evolve, with an increased availability of high-potency, short-acting synthetic opioids, estimates of projected complications of injection opioid use can help guide service planning and resource allocation. We sought to understand the contributions of injection frequency and injection techniques to IE mortality risks among people who inject opioids in the United States and to compare the risk of death from IE against the risks of death from other causes as a function of injection behaviors.
METHODS
Analytic Overview
We developed, validated, and calibrated the Reducing Infections Related to Drug Use Cost-Effectiveness Model, a Monte Carlo microsimulation model that simulates the natural history of injection opioid use. We then projected IE mortality and competing risks of death according to injection behavior profiles. We defined injection behavior profiles by both injection frequency (high, low, and no current) and, for those with current use, injection practices (sharing injection equipment and using sterile injection technique). We modeled 1 million individual cohorts of a particular injection behavior profile who entered the model at a specific age (eg, 20, 30, or 40 years). The primary outcome was probability of death from injection-related IE by age 60 years. We then used model-generated estimates, along with published data on the prevalence of injection opioid use, to project the total number of expected IE deaths in the United States by 2030.
Model Overview
A simulated individual enters the model and is randomly assigned an age, sex, and history of injection opioid use. Among those who have a history of any injection opioid use, the model next assigns a current injection status (high frequency, low frequency, and no current use), and injection technique (shares injection equipment, uses sterile injection technique). Individuals progress weekly through a series of modules in which they encounter probabilities of IE, SSTI, and overdose (collectively known as “sequelae”); hospitalization; and outpatient care. An individual’s progression through these modules impacts the transition probabilities between injection-related health states and their probability of death. See the Supplementary Materials for full model details.
Simulated Cohorts
We simulated cohorts stratified by sex, age, and injection behavior profile. We considered high-frequency injection behavior to be ≥1 injection/day, low-frequency injection behavior to be <1 injection/day, and no current opioid use to be no injection use in the previous 12 months [12]. We defined higher infection risk technique as the combination of sharing equipment and not using sterile technique (eg, not cleaning one’s skin prior to injection), and lower infection risk technique as the combination of not sharing equipment and using sterile technique (eg, cleaning one’s skin prior to injection).
Sequelae of Drug Use
Only individuals with high-frequency or low-frequency injection use are at risk of sequelae. We derived overdose, IE, and SSTI risk probabilities by age, sex, and injection behavior profile.
Hospitalization
Individuals who develop sequelae have a probability of being hospitalized and treated for their condition. Individuals also have a probability of being discharged against medical advice.
Outpatient Addiction Care
Individuals encounter probabilities of linking to outpatient addiction care. This can happen following a hospitalization for sequelae or via a background mechanism. The background mechanism simulates the reality that some individuals link to outpatient addiction care spontaneously and without prior hospitalization.
Mortality
Individuals face risks of death from overdose, IE, and SSTI, as well as from age- and sex-related causes (ie, background mortality). We derive overdose mortality probabilities by age, sex, injection behavior profile, and probability of all overdose. “All overdose” is composed of nonfatal and fatal overdoses. IE and SSTI are both characterized as untreated, in treatment, or resolved, with the mortality risk being lower when in treatment or resolved. An additional in-hospital mortality risk is applied during the time an individual is actively being treated in the hospital, which is no longer applied following discharge. If persons leave the hospital prior to completion of therapy (ie, against medical advice), they are considered untreated. We applied probabilities of non–opioid related death from other causes by sex, age, and injection behavior profile.
Model Calibration and Validation
Details of calibration and validation are outlined in Supplementary Appendix Table 1. Briefly, we followed the best practices as outlined by the 2nd Panel on Cost Effectiveness in Health and Medicine to validate the model [13]. First, we sought face validity (first-order) from experts in the field. We then assessed the model for internal validity (second-order) by comparing the simulated life expectancy to empirically observed age- and sex-stratified life expectancies. Finally, we externally validated by comparing our model-generated outcomes to published literature [14].
Input Parameters
Cohort Characteristics
The distribution of “ever” opioid use was derived from the US Census and a combination of published sources (Table 1) [15–19]. In the base case, we assumed the same injection behavior profile, regardless of cohort age, at entry to the model.
Model Inputs to Estimate the Long-term Infective Endocarditis Mortality Rate Associated With Injection Opioid Use in the United States
| Parameter | Estimate | Range | Source |
|---|---|---|---|
| Population | |||
| Distribution of persons who ever injected drugs | Varies by age and sex | … | [15–19] |
| Probability of injection drug use frequency | Varies by age and sex | … | [20, 21] |
| Probability of skin cleaning | .3414 | .1214–.5614 | [10, 22–24] |
| Probability of needle sharing | .4420 | .3739–.5101 | [25–29] |
| Sequelae of drug use | |||
| Probability of overdose | … | … | [18, 30–35] |
| Low-frequency drug use | .0026 | .0026–.0027 | |
| High-frequency drug use | .0005 | .0005–.0006 | |
| Probability of fatal overdose | .1300 | .1200–.2400 | [34–36] |
| Combined probability of IE and SSTI, stratified by injection behavior profile | See Supplementary Material | … | [3, 23, 37–40] |
| Proportion of infections attributable to IE | .1300 | .0300–.4000 | [3, 37, 41, 42] |
| Probability of linking to inpatient care following nonfatal overdose | .9700 | … | Unpublished data |
| Probability of linking to inpatient care for IE | .2000 | .1830–.2170 | [43] |
| Probability of linking to inpatient care for SSTI | .0019 | .0008–.0040 | [44] |
| Previous overdose multiplier for risk of subsequent overdose | 1 NFOD: 1.15 | .72–1.82 | [45] |
| 2–3 NFOD: 1.81 | 1.19–2.27 | ||
| 8+ NFOD: 5.24 | 1.56–17.01 | ||
| Previous infection multiplier for risk of subsequent infection | 2.8 | 1.50–5.10 | [46] |
| Inpatient | |||
| Duration of hospitalization for SSTI, weeks, mean | 2 | 1–4 | [37] |
| Duration of hospitalization for IE, weeks, mean | 6 | 4–8 | [37] |
| Probability of discharge AMA | .0500 | .0300–.1000 | Expert opinion |
| Outpatient | |||
| Outpatient addiction care linkages | |||
| Outpatient addiction care from inpatient, with MOUD | .5714 | .5404–.6024 | Unpublished data |
| Outpatient addiction care from inpatient, without MOUD | .0500 | .0490–.0501 | [47, 48] |
| Outpatient MOUD initiation | |||
| Outpatient addiction care | .1620 | .1439–.3430 | [47] |
| Outpatient unlinking | |||
| Spontaneous “unlinkage” from outpatient addiction care, with MOUD | .0481 | .0298–.0666 | [49, 50] |
| Spontaneous “unlinkage” from outpatient addiction care, without MOUD | .1560 | .1262–.1860 | [49, 51] |
| Mortality | |||
| Background overdose, subtracting mortalitya | Varies by age and sex | .0008–.0011 | [52, 53] |
| Probability of death, untreated IE | .1623 | .0848–.5358 | [54, 55] |
| Probability of death, untreated SSTI | .0023 | .0023–.0028 | [54] |
| Probability of death, inpatient with IE | .0100 | .0018–.0161 | [54, 56–59] |
| Probability of death, inpatient with SSTI | .0008 | .0008–.0025 | [54] |
| Probability of death, inpatient with overdose | .0190 | .0130–.0270 | [60] |
The Reducing Infections Related to Drug Use Cost-Effectiveness Model runs on a weekly time cycle; therefore, all probabilities in this table are weekly probabilities.
Abbreviations: AMA, against medical advice; IE, infective endocarditis; MOUD, medication for opioid use disorder; NFOD, non-fatal overdose; SSTI, skin and soft tissue infection.
aOverdose was subtracted from background mortality rate. Mortality rates from IE and SSTI were not subtracted, as we determined that they did not substantially impact national mortality statistics.
Sequelae of Drug Use
We estimated the rates of fatal and non-fatal overdoses from state-level data [36]. We used published literature to estimate the rates of injection-related infections among PWID and the proportion of infections that are IE and SSTI (Supplementary Appendix Table 2) [3, 37, 41, 42].
Hospitalization
We used published literature and expert opinions to estimate the rates of hospitalization for each of the sequelae [43, 44]. The published literature suggests that there is often a time delay from symptom onset to hospitalization among PWID with IE [43]. Since IE rarely, if ever, resolves without medical treatment, a weekly probability was calculated from the literature such that persons will either present for hospitalization or die of IE without treatment. To model the broad reality in the United States, we assumed that individuals could continue their MOUD but could not newly initiate MOUD [61].
Outpatient Care
We estimated linkage to outpatient care from the community (ie, background linkage) and following hospitalization using a variety of sources. Background linkage was derived from cohort data from the Veteran’s Administration (unpublished data) and other published literature. We derived linkage rates following hospitalization from cohorts in Massachusetts (unpublished data) and Oregon [61] and from clinical trial data [49].
Mortality
We used overdose-deleted US age- and sex-adjusted mortality rates from the National Vital Statistics System [52] to derive the background mortality rate. We accounted for other drug-related mortality risks by multiplying the background mortality rate by 1.2 [53]. To derive weekly IE mortality, we combined the weekly background mortality rate with weekly mortality risks from overdose [53], untreated and treated IE and SSTIs [54, 55], and hospitalization [54, 56–58] for persons with active injection use (stratified by injection frequency).
Population-level Impact
We derived the number of persons in high-frequency, low-frequency, and no current use states in the United States by age and sex using 2011 prevalence estimates [15] and US Census data [19]. We used model-generated cumulative IE mortality rates for each sex, age, and injection behavior profile stratum to derive the expected total number of injection opioid-related IE deaths by 2030 in the United States. We generated a 95% credible interval using a probabilistic sensitivity analysis.
Sensitivity Analysis
We performed deterministic sensitivity analyses with alternative assumptions and parameter estimates to explore uncertainty. Assumptions in the main text include the following: (1) accounting for the changes in the opioid supply to more high-potency opioids (ie, the “fentanyl effect”), which increases the overdose-related death risk; (2) varying the impact of violence, trauma, and homelessness, which affects other drug use–related risks of death; (3) varying the efficacy of antimicrobials against increasingly multidrug-resistant organisms, which affects both the IE- and SSTI-related death risks; and (4) varying the proportion of infections that are attributable to IE, which affects the IE-related death risk. We also performed probabilistic sensitivity analyses to generate quantitative estimates of uncertainty in simulated outcomes: IE mortality by age 60 for each cohort and 10-year IE mortality for a cohort representative of the US population. For each probabilistic sensitivity analysis, we performed 10 000 simulations on a cohort of 1 million people.
RESULTS
Base Case
For men with high-frequency use, the probabilities of death from IE by age 60 years for 20-, 30-, and 40-year-olds with higher infection risk techniques compared to those lower risk techniques were 53.8% versus 3.8%, 51.4% versus 3.1%, and 44.5% versus 2.2%, respectively (Table 2). For men with low-frequency use, the probabilities of death from IE by age 60 years for 20-, 30-, and 40-year-olds with higher versus lower infection risk techniques were 44.9% versus 2.5%, 36.8% versus 1.8%, and 25.6% versus 1.2%, respectively (Table 2). Similar reductions were seen among women.
Model-generated Probability of Death from Endocarditis by Age 60, Stratified by Age at Initiation of Injection Opioid Use and Injection Behavior Profile
| Probability of Endocarditis Death by Age 60 Years, % (rangea) | ||||||
|---|---|---|---|---|---|---|
| Began Use at Age 20 | Began Use at Age 30 | Began Use at Age 40 | ||||
| Female | Male | Female | Male | Female | Male | |
| High frequency, higher infection risk | 54.4 (38.2–83.6) | 53.8 (37.7–83.1) | 52.0 (36.3–83.4) | 51.4 (35.9–82.8) | 45.2 (30.7–81.3) | 44.5 (30.2–80.5) |
| High frequency, lower infection risk | 3.8 (0–13.6) | 3.8 (13.4) | 3.1 (0–11.7) | 3.1 (0–11.6) | 2.2 (0–8.8) | 2.2 (0–8.7) |
| Low frequency, higher infection risk | 45.8 (31.1–90.7) | 44.9 (30.4–89.5) | 37.4 (23.3–84.0) | 36.8 (22.8–82.9) | 26.0 (13.7–68.8) | 25.6 (13.4–67.7) |
| Low frequency, lower infection risk | 2.5 (0–10.7) | 2.5 (0–10.4) | 1.9 (0–7.9) | 1.8 (0–7.8) | 1.2 (0–5.1) | 1.2 (0–5.1) |
High infection risk was defined as persons who do not clean their skin and reuse injection equipment; low infection risk was defined as persons who clean their skin and do not reuse injection equipment.
aRanges were determined by probabilistic sensitivity analysis.
Risk of IE Death Versus Other Causes
The injection behavior profile impacted risks of mortality from IE versus other causes. For women who began injecting at age 20 years with high-frequency use but lower infection risk techniques, the probability of IE mortality was nearly 15 times less than the probability of death by overdose (Figure 1A). However, the probability of IE mortality was 2 times higher than the probability of death by overdose in those from the same population who instead had higher infection risk techniques. For 20-year-old women with low-frequency use and higher risk injection techniques, the mortality risk from IE was 9 times greater than the risk of death by overdose. Similar trends were observed in men (Figure 1B).
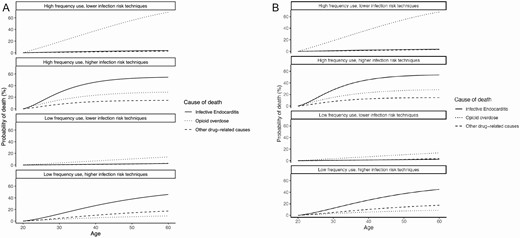
Probability of death, by cause, among (A) women and (B) men who begin injection drug use at age 20. Probability of death beginning at age 20 through age 60 among (A) women and (B) men. Each graph represents a different injection behavior profile. High-frequency use is defined as ≥1 injection/day; low-frequency use is defined as <1 injection/day. Higher infection risk techniques are defined as regularly sharing or reusing injection equipment and not cleaning one’s skin prior to injection; lower infection risk techniques are defined as not regularly sharing or reusing injection equipment and regularly cleaning one’s skin prior to injection. The solid line represents endocarditis mortality; the dotted line represents overdose mortality; the dashed line represents other drug-related mortality (including skin and soft tissue infections).
Population-level Impact
The predicted population-level attributable fractions of 10-year mortality for IE and overdose were 20% and 32%, respectively. We estimated the future burden of IE deaths by multiplying the projected mortality rate by the estimated number of people who inject opioids. Assuming a prevalence of 2.6% people who have ever injected opioids [15], 257 800 people (95% credible interval, 62 700–868 500) in that population are expected to die from IE by 2030.
Sensitivity Analysis
We performed deterministic sensitivity analyses where variations in the underlying parameters had important impacts on the outcome of interest: IE mortality.
The “Fentanyl Effect”
When we considered the effect of more pervasive high-potency opioids (eg, fentanyl and carfentanil), the probability of death due to IE among 20-year-olds with high- and low-frequency use decreased substantially, whereas the probability of death due to overdose increased. For instance, the probability of IE death among 20-year-old men with high-frequency use and a higher infection risk decreased from nearly 55% of all deaths in the base case to 41% of all deaths, while the probability of death from overdose rose from 29% of all deaths in the base case to almost 47% of all deaths in this sensitivity analysis (Figure 2).
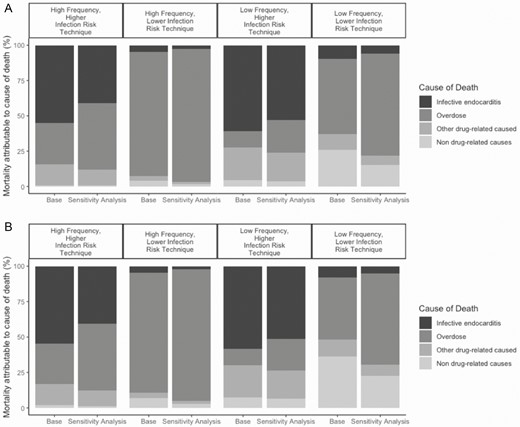
Changes in mortality, by cause, among (A) women and (B) men who began injection drug use at age 20 in the sensitivity analysis of pervasive, high-potency opioids (eg, fentanyl). Bar graphs are grouped by injection behavior profile. The first bar in a pair represents the proportion of cause-specific mortality in the base case. The second bar in a pair represents the cause-specific mortality assuming an illicit opioid market that is nearly exclusively fentanyl. The black section represents endocarditis mortality, dark gray represents overdose mortality, light gray represents other drug-related causes, and the lightest gray represents background mortality.
Varying Other Drug Use–Related Mortality
We considered the effect of greater-than-reported mortality associated with opioid use, which included mortality due to SSTIs, violence, trauma, and homelessness (Supplemental Figure 3A and B). The largest increase in the probability of death due to opioid use from the base case to the sensitivity analysis was among the low injection frequency and lower infection risk practice group.
The Rise of Antimicrobial-resistant Injection-related Infections
The model-generated probability of IE mortality increased as we modeled more virulent infections, especially in those without appropriate antimicrobial therapy (Figure 3). In this sensitivity analysis, the absolute numbers of death from IE and other drug-related causes both increased; however, the proportion of deaths due to IE decreased and the proportion due to other causes increased. This discrepancy can be explained by the fact that SSTIs are included in other drug-related deaths. In the base case, SSTI infections are not as fatal as IE but are more frequent than IE. As antimicrobial resistance increased, SSTI mortality became more common, whereas IE mortality increased only incrementally.
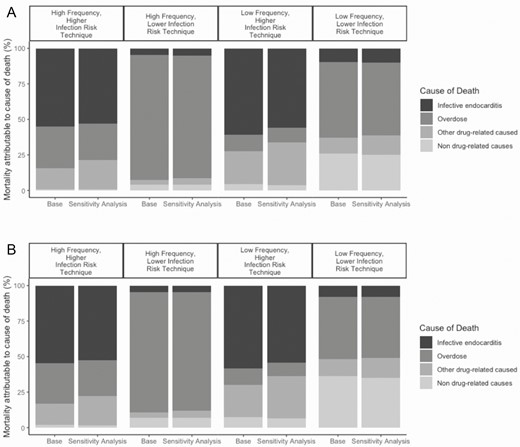
Changes in mortality, by cause, among (A) women and (B) men who began injection drug use at age 20 in the sensitivity analysis of increased antimicrobial resistant infections. Bar graphs are grouped by injection behavior profile. The first bar in a pair represents the proportion of cause-specific mortality in the base case. The second bar in a pair represents the cause-specific mortality assuming an increase in infections caused by antimicrobial resistance organisms. The black section represents endocarditis mortality, dark gray represents overdose mortality, light gray represents other drug-related causes, and the lightest gray represents background mortality.
Proportion of Infections Due to IE
Not surprisingly, as we increased the proportion of drug-related infections that were due to IE, the proportions of deaths due to IE in all injection behavior profile groups increased (Supplemental Figure 4A and B). A relative increase in the probability of IE deaths of 251% was observed in the low-frequency use, lower injection risk technique cohort.
Probabilistic Sensitivity Analysis
The full results of the probabilistic sensitivity analyses are represented as credible ranges around the outcomes of interest. The probabilistic sensitivity analysis demonstrated that in all plausible scenarios, IE mortality was driven by injection techniques more than it was by injection frequency.
Discussion
Using a novel microsimulation model, we found that people with a history of injection opioid use in the United States are at significant risk of death from IE. First, we estimate that more than 50% of the mortality over the next 10 years in this population will be attributable to IE and overdoses, with IE accounting for one-fifth of all deaths. Using an average life expectancy of 75 years, deaths from injection-related IE over the next 10 years roughly equates to 7 260 000 years of potential life lost. Second, we estimate the extent to which nonsterile injection practices and injection frequency contribute to the causes of death among people who inject opioids. Our model suggests that the risk of IE death was more pronounced among those with higher infection risk practices compared to those with lower-risk practices. Injection frequency had little effect on the risk of IE death.
Our findings support the idea that to decrease mortality associated with the opioid epidemic, we must address an individual’s full injection behavior profile. As Figure 1 demonstrates, addressing injection techniques, such as skin cleaning and equipment sharing, will likely substantially decrease IE-related mortality, as opposed to focusing solely on injection frequency. For example, a 20-year-old female in our model could lower her risk of IE death by as much as 93% by cleaning her skin and not reusing equipment. That same 20-year-old female might only lower her risk of IE death by 15% by decreasing her injection frequency alone. Among persons who already have lower infection risk practices, reducing the injection frequency and overdose risk may lead to the greatest reductions in mortality, since an overdose is more likely with higher-frequency use. This risk reduction approach includes access to new and sterile injection equipment and education on sterile injection practices, in addition to overdose education, naloxone distribution, and enhanced availability of MOUD.
Our results show that an individualized, patient-centered approach to the opioid epidemic that includes the expansion of harm-reduction services is needed. Practically, this means meeting patients where they are and, perhaps, addressing injection techniques first. Once a person changes their injection technique, the next thing to consider is injection frequency. Even if our aforementioned 20-year-old female never reduces her injection frequency, we still reduced her IE mortality by 93%.
Our deterministic sensitivity analyses demonstrated that even in the setting of parameter uncertainty, IE and other injection-related infections will likely be a substantial cause of death among PWID in the coming decades. We highlight important contextual issues to consider, including the evolving injection-drug epidemic, the antimicrobial-resistance crisis, and the implications of the convergence of these on mortality. Not surprisingly, the sensitivity analysis in which we modeled the expansion of fentanyl throughout the country demonstrated a substantial rise in opioid overdose mortality. Additionally, our sensitivity analysis in which we modeled the effects of antimicrobial resistance demonstrated minimal changes in overall IE mortality, but increases in other drug-related causes of death, including SSTIs. In general, a growing proportion of injection-related infections occur as the result of drug-resistant organisms [41, 62, 63], but there are few antimicrobials in the development pipeline. As of June 2019, there were only 42 new antibiotics in clinical development with the potential to treat serious bacterial infections [64]. These issues, the expanding drug-use epidemic and the rise and spread of resistant pathogens, have commonalities that include structural factors—such as housing instability and homelessness, food insecurity, and institutional racism—that could cause an expedited collision. Accounting for these colliding crises, we are likely underestimating the potential IE and all-cause mortality rates. To stave off an even larger impending public health crisis, multiple dimensions of the problem need to be addressed urgently: expanding syringe service programs and other harm-reduction efforts, improving initiation and retention on MOUD, increasing research and development into new antimicrobials, and promoting system-level change that addresses the social and structural determinants of health.
Our study has limitations. Most importantly, this is a simplification of complex biological, clinical, and social processes, and underlying our data are many assumptions and potentially unmeasured confounders. Additionally, our data sources were primarily cohort studies and large national databases, which may not be representative of the overall US population. This is particularly relevant with regard to the population-level impact, in which we used older estimates of the prevalence of PWID [15]. We explored model assumptions, confounders, and parameter uncertainty with extensive sensitivity analyses, including probabilistic sensitivity analyses. Estimates from this model should serve as a road map, rather than dogma, to guide policy decisions and future research aimed at reducing the burden of disease from these infections. Future models should incorporate the effects of hospital-based interventions, such as addiction consult services [65].
In conclusion, a large expected burden of IE is anticipated among people who inject opioids in the United States. Our data demonstrate the importance of adopting a harm-reduction approach when working with persons who inject drugs. The highest-priority intervention is to address their injection technique to include skin cleaning and use of sterile equipment, even before addressing drug use itself. Doing so can reduce the risk of drug-use related mortality by >90%, even among patients who cannot or are not interested in reducing the frequency of their drug use. Addressing and mitigating the risks of the ways that people use drugs could prevent a great deal of death, even while drug use itself is increasing.
Supplementary Data
Supplementary materials are available at Clinical Infectious Diseases online. Consisting of data provided by the authors to benefit the reader, the posted materials are not copyedited and are the sole responsibility of the authors, so questions or comments should be addressed to the corresponding author.
Notes
Author contributions. J. A. B. conceived of the study design, performed the analyses, and wrote the initial version of the manuscript. G. E. Y. programmed the simulation model and assisted with the writing of the manuscript. A. S. and S. N. helped parameterize the model and edited the manuscript versions. C. S. oversaw the project implementation and assisted with writing several versions of the manuscript. J. H. S., H. E., and B. P. L. provided content expertise, helped develop the analytic plan, and contributed to manuscript revisions.
Financial support. This work was supported by the National Institute on Drug Abuse at the National Institutes of Health (grant numbers K01DA051684, DP2DA05186401, and R01DA046527–02S1 to J. A. B; R01DA046527 and P30DA040500 to B. P. L.), the Boston University clinical and translational science institute (CTSI) (to J. A. B.), and the Charles A. King Trust (to J. A. B.).
Potential conflicts of interest. The authors: No reported conflicts of interest. All authors have submitted the ICMJE Form for Disclosure of Potential Conflicts of Interest.

