


Abstract
The local field potential (LFP) is an extracellular electrical signal associated with neural ensemble input and dendritic signaling. Previous studies have linked gamma band oscillations of the LFP in cortical circuits to sensory stimuli encoding, attention, memory, and perception. Inconsistent results regarding gamma tuning for visual features were reported, but it remains unclear whether these discrepancies are due to variations in electrode properties. Specifically, the surface area and impedance of the electrode are important characteristics in LFP recording. To comprehensively address these issues, we conducted an electrophysiological study in the V1 region of lightly anesthetized mice using two types of electrodes: one with higher impedance (1 MΩ) and a sharp tip (10 μm), while the other had lower impedance (100 KΩ) but a thicker tip (200 μm). Our findings demonstrate that gamma oscillations acquired by sharp-tip electrodes were significantly stronger than those obtained from thick-tip electrodes. Regarding size tuning, most gamma power exhibited surround suppression at larger gratings when recorded from sharp-tip electrodes. However, the majority showed enhanced gamma power at larger gratings when recorded from thick-tip electrodes. Therefore, our study suggests that microelectrode parameters play a significant role in accurately recording gamma oscillations and responsive tuning to sensory stimuli.
Introduction
The local field potential (LFP) in the cerebral cortex, which reflect the dynamic flow of electrical activity, are considered crucial signals for enhancing our understanding of brain functions. Previous studies have indicated that the LFP primarily originate from both neural ensemble input and local dendrite processing within the neural network. In the V1 region, gamma oscillations of the LFP in response to various stimulus features are subject to modulation by multiple types of stimuli, including orientation, spatial frequency, temporal frequency, ocular dominance, and stimulus discontinuities (Eckhorn et al. 1988; Henrie and Shapley 2005; Gieselmann and Thiele 2008; Bartolo et al. 2011; Jia et al. 2011; Ray and Maunsell 2011; Chen et al. 2013; Land et al. 2013; Jia et al. 2013a; Jia et al. 2013b; Hermes et al. 2015; Chen et al. 2017; Saleem et al. 2017; Storchi et al. 2017; Murty et al. 2018; Han et al. 2021; Wang et al. 2021; Li et al. 2022; Shirhatti et al. 2022; Hou et al. 2023). However, there have been inconsistent findings regarding gamma tuning. For instance, a close resemblance between the orientation tuning of both multi-unit activity and LFP oscillations in cats was reported during an orientation tuning study (Eckhorn et al. 1988). Conversely, low correlation between preferred orientations was obtained from gamma oscillations and simultaneously recorded MUA activity in awake macaques (Berens et al. 2008). In addition, the majority of previous studies on size tuning indicate that gamma power increases with the expansion of drifting grating (Gieselmann and Thiele 2008; Jia et al. 2011; Jia et al. 2013a; Veit et al. 2017). On the contrary, in our recent study conducted on lightly anesthetized mice, it was observed that gamma power weakens as the size of drifting grating increased, similar to local spiking activity (Chen et al. 2017; Hou et al. 2023).
The amplitude and rhythm of LFP can be influenced by the physical properties of recording electrodes, such as surface and impedance (Berens et al. 2008; Lempka et al. 2011; Nelson et al. 2007). Generally, lower-impedance electrodes (100 KΩ) with a thick tip (~200 μm) can access electrical signals over a larger area (~700 μm) adjacent to the electrode tip, while higher-impedance electrodes (1 ~ 4 MΩ) with a sharp tip (1 ~ 10 μm) may summate electrical signals over a smaller area (~250 μm) (Katzner et al. 2009; Kay et al. 2010). Additionally, with advancements in invasive brain-computer interfaces, researchers have been striving to develop ultra-sharp flexible electrodes capable of acquiring valuable neural signals for decoding cognitive behaviors while minimizing damage resulting from electrode insertion (Yao et al. 2022; Luo et al. 2023; Xu et al. 2024). Hence, comprehending how microelectrode characteristics affects detecting neural activity is highly significant for obtaining accurate gamma oscillations and decoding visual perception. We hypothesized that the gamma oscillations in LFP and visual tuning could potentially be influenced by the type of electrode with different surfaces and impedance. However, a comprehensive study is still lacking to compare gamma oscillations and their response tuning. In this study, we employed metal microelectrodes with sharp tips (10 μm, 1 MΩ) and thick tip (200 μm, 100 KΩ) to record visually induced neural activity in the V1 of lightly anesthetized mice. Additionally, we also utilized a linear electrode array (LEA) to compare the results obtained from size tuning analysis since previous studies have employed this type of electrode for studying size tuning.
Materials and methods
Animal preparation
The Animal Management Committee of the University of Electronic Science and Technology of China granted authorization for all experimental procedures and techniques utilized in data collection. In this study, we utilized 52 adult male C57BL/6 mice aged 3–4 months (20 ~ 25 g) obtained from Beijing Hfk Biosicence Co. Anesthesia was induced with gaseous anesthetic (4 ~ 5% isoflurane), followed by maintenance with a light dose (0.6 ~ 0.8% isoflurane, RWD Life Science, Shenzhen, China). The mice were immobilized using a stereotaxic device (RWD Life Science, Shenzhen, China), while their body temperature was maintained at 36 ~ 37°C through the use of a heating pad. During data recording, silicone oil was applied to cover the eyes of the mice to prevent dryness and black tape was used to block the ipsilateral eyes. Throughout the experiments, physiological parameters such as heart rate, electrocardiography, electroencephalography, pulse oxygen saturation, and rectal temperature were monitored using MouseOx equipment (Starr Life Sciences Corp, New York, USA). Following craniotomy in V1 region (Bregma: AP: −4 mm; ML: 2.5 mm; size: 1.5 × 1.5 mm), a bone screw was fixed in cerebellum as reference point while two types of metal electrodes with surface insulation were respectively employed for signal recording purposes. The exposed cortical surface was protected against dryness and brain pulsations caused by breathing by covering it with agarose gel (2%, Biowest Nuaillé France). Additionally, a protective cover was installed to minimize environmental interference.
Electrophysiological recording
Three types of electrodes were employed for recording LFP, including two single-channel electrodes and one linear 16-channel electrode. The sharp-tip electrode (S-E, KD-SC, KedouBC, Suzhou, China) was a glass-insulated tungsten microelectrode with a tip diameter of 10 μm and an impedance of 1 MΩ. The thick-tip electrode (T-E, California Fine Wire company, California, USA) was a microelectrode with a larger tip diameter of 200 μm and an impedance of 100 KΩ. Additionally, the LEA (KD-SC, KedouBC, Suzhou, China) consisted of 16 recording sites with each site having a diameter of 15 μm and spacing between sites set at 50 μm. The total experiment involved recording data from 37 mice using the S-E configuration while 13 mice were recorded using the T-E configuration. 2 mice underwent recordings using the LEA configuration. During LFP recordings with S-E and T-E configurations respectively utilized a microelectrode AC amplifier (Model 1800, A-M Systems, Sequim WA, USA) in conjunction with a neural signal processor system (Blackrock Microsystems, Salt Lake City, USA). When utilizing LEA for recordings purposes specifically employed the Cerebus system (Blackrock Microsystems, Salt Lake City, USA). The visual stimuli experiments were presented on a positioned monitor (GX258F, IC, Shenzhen), which was placed approximately 27 cm away from the mouse’s eye. The monitor had a refresh rate of 280 Hz and a resolution of 1920 × 1080 pixels. Its average luminance was maintained at 60 cd/m2 through γ-correction. Psychtoolbox-3 software ran on a computer equipped with a high-resolution graphics card (GTX2060, NVIDIA, USA), which had 12 GB video memory to generate visual stimuli.
Measurement of the visually induced neural response
For the S-E recording, a vertically inserted electrode was utilized to target either L2/3 and L4 of V1 (150 ~ 450 μm) with the assistance of a single motorized micromanipulator (Scientifica, Uckfield, UK). The movement of the micromanipulator ceased upon identification of a neuron exhibiting visually evoked responses. Spike responses were sorted using Blackrock Central Software Suite (Blackrock Microsystems, United States). Only well-isolated cells that met stringent criteria for single-unit recordings (including consistent action potential waveform and absence of refractory period spikes) were selected for further analysis. Once the single-unit action potentials were isolated, tuning curves was determined by online analysis. Firstly, the preferred orientation for each cell was determined within a range of 0° ~ 330°for direction, spatial frequency (SF) at 0.04 cycles per degree (cpd), and temporal frequency (TF) at 1 Hz. The center of the receptive field (RF) was measured by presenting a drifting grating patch with the preferred orientation and parameters SF: 0.04 cpd, TF: 1 Hz at random positions along axes perpendicular or parallel to the optimal orientation of the cell and measuring its response to drift. The center of RF was defined as the peak in the profiles of gamma response observed across both axes (Fig. 2A). Size tuning were obtained by presenting drifting gratings centered at RF center with preferred orientation and parameters SF: 0.04 cpd, TF: 1 Hz at sizes ranging from 0° ~ 68°. For each recording session in T-E experiments, an electrode was vertically inserted into V1 at depths of 150 μm below dura. 2 ~ 3 penetrations were conducted for each animal. The RF was approximately determined by analyzing gamma oscillations in response to a strip grating. The center of the RF was defined as the peak of the distribution of gamma oscillations along both axes (Fig. 2B). Size tuning was assessed using drifting gratings with sizes ranging from 0°to 68°, including uniform luminance, 4°, 6°, 9°, 13°, 20°, 30°, 45°, and 68°. Each size was presented at intervals of every 30° with 12 different drift orientations (ranging from 0 ~ 330°), and single trial data were generated by calculating the mean response across sizes for stimulus with different orientations (SF: 0.04 cpd; TF: 1 Hz). The LEA recording was performed by vertically penetrating below the dura by a depth of 800 μm for data acquisition purposes. RF locations were determined based on gamma oscillations evoked by the strip grating, where each channel exhibited a peak of gamma response. The center of the RF was defined as the location encompassing the maximum number of channel peaks observed. Similar to T-E methodology mentioned earlier, single site data were obtained by calculating mean sizes across different orientation stimulus (SF: 0.04 cpd; TF: 1 Hz). Each stimulus presentation was repeated between 5 ~ 10 times with each trial consisting of a 2-s stimulus period followed by a 1-s stimulus interval (uniform luminance: gray blank screen with mean luminance).
Data analysis
Power spectrum density estimation
The power spectrum density (PSD) was estimated using the multi-taper method provided by the Chronux toolbox (www.chronux.org, Bokil et al. 2010), employing a time-bandwidth product of 3 and 5 tapers (2TW-1). To determine gamma tuning, a tuning curve was constructed based on the integrated power within the gamma band. Power gain was defined as the ratio between power evoked by the drifting grating and that during presentation of a gray screen. Peak frequency referred to the frequency at which maximum ratio between spectra for stimulus-induced and spontaneous activity occurred (Jia et al. 2013a), specifically within the range of 20 ~ 45 Hz. The normalized response was obtained by calculating the average of data from all trials after performing normalization. The process of normalization involved dividing all data by their maximum value across all trials.
Suppressive index
After conducting an analysis of the spiking activity and gamma power across various stimulus sizes, we successfully identified both suppressed and non-suppressed tuning curves. In order to quantitatively assess the level of suppression in the size tuning, we calculated the suppression index (SI). The SI serves as a measure for gauging the extent of attenuation from the peak response to the minimum response, and can be mathematically expressed using the following equation (Hou et al. 2023):
where the Rmax represents the maximum response, while the Rmin denotes the minimum response observed when the stimulus size exceeds the receptive field. The Rspon refers to the spontaneous response. Non-suppressed tuning is classified when the SI falls between 0 and 0.1, whereas suppressed tuning is classified when SI ranges from 0.1 to 1.
Bayesian spike removal algorithm
The Bayesian Spike Removal Algorithm (BSRA, http://apps.mni.mcgill.ca/research/cpack/lfpcode.zip) is based on the principles of Bayesian theory for spike removal (Zanos et al. 2011). Its primary objective is to estimate the true LFP by effectively eliminating action potential features from the raw voltage signal. This algorithm employs a measured wide-band voltage trace to accurately estimate the LFP. The researchers make an assumption that this wide-band signal comprises low-frequency LFP, high-frequency spike components, an offset, and white noise. These assumptions are incorporated into a probabilistic model, which facilitates determination of LFP without any interference from spiking activity effects through Bayesian inference.
Statistical analysis
The quantitative data were presented as mean ± SEM (standard error of the mean). GraphPad Prism 8.0.2 for Windows (San Diego, CA, USA) was utilized to assess normality and homogeneity of variance. Specifically, paired t-tests were employed for normally distributed and equivalent data. For non-normally distributed data, the Mann–Whitney U test were used. Two-way analysis of variance (ANOVA) was employed to compare means from multiple groups within variable. Pearson correlation was used for correlation analysis. A P-value less than 0.05 was considered statistically significant for all tests.
Results
Much stronger gamma oscillations sampled by sharp-tip electrode
It is widely acknowledged that microelectrodes with thicker tips have a larger integration area, while those with sharper tips exhibit more localized integration (Fig. 1A). Both types of electrodes were utilized to record LFP during experiments of visual stimulus, aiming to investigate the characteristics of gamma oscillations (Fig. 1B). The experiment utilized a total of 20 S-Es to record data from 37 mice, while 10 T-Es were employed for recording data from 13 mice. And 2 ~ 3 penetrations were performed in each mouse. For S-E, 1 ~ 2 sites were recorded for each penetrations, resulting in a total of 210 sites. For T-E, 3 sites were recorded for each penetrations, for a total of 96 sites. An example of gamma oscillations in response to uniform luminance and drifting grating is illustrated in Fig. 1C, where S-E demonstrates significantly higher amplitude compared to T-E. Additionally, visually induced population responses were evaluated using both electrode types. The difference in power between the spectrum during stimulus presentation and the uniform luminance is depicted in Fig. 1D. Furthermore, Fig. 1E displays the response gain as the ratio between the spectrum during stimulus presentation and the uniform luminance. It reveals that power within the frequency band of 20 ~ 40 Hz surpasses average gamma power (the shaded part of Fig. 1E). Consequently, for subsequent analysis purposes, integrated power within the range of 20 ~ 40 Hz was calculated as the PSD.
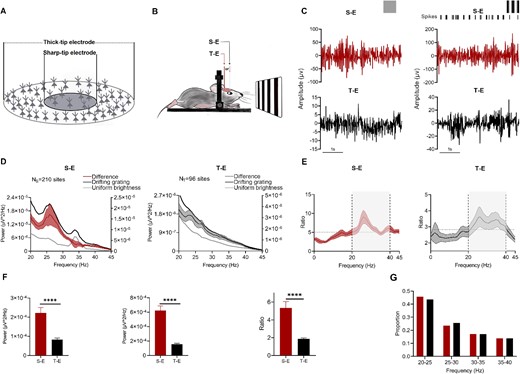
Characteristics for gamma oscillations sampled by two types of electrodes. A) the electrode recording sketch illustrates that T-E has a larger range of spatial integration than S-E. B) Two types of electrodes were utilized to acquire the gamma oscillations. C) Representative gamma oscillations (20 ~ 50 Hz) under uniform luminance and moving grating recorded by two electrodes (left: Uniform luminance; right: Drifting grating). D) the comparison of PSD between LFP during stimulus presentation and uniform luminance from two electrodes. E) the PSD gain of LFP during the stimulus presentation compared with that during the uniform luminance by two electrodes. The dash line means average PSD gains (the shaded portion represented the gamma band that we had computed). F) the comparison of gamma power during uniform luminance (left), drifting grating (middle) and the gamma power gain (right) within two electrodes (**** for P < 0.0001, Mann–Whitney U test, error bars are SEM). G) Distribution of peak frequency of gamma oscillations measured by two types of electrode during drifting grating.
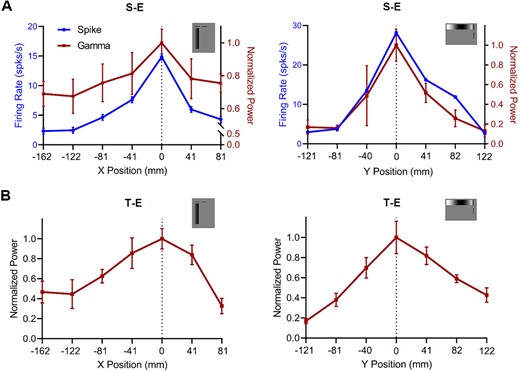
Determination of the receptive field center measured by two types of electrodes. A) the RF center measured by the S-E through the distribution of the gamma oscillations PSD by systematically placing a narrow drifting grating patch at different positions along axes perpendicular or parallel to the optimal orientation. B) the RF center measured by the T-E through the distribution of the gamma oscillations PSD by systematically placing a narrow drifting grating patch at different positions along axes perpendicular or parallel to the optimal orientation. Error bars are SEM.
The power spectrum was calculated and compared between the two types of electrodes under uniform luminance and drifting grating, respectively. Significantly stronger gamma oscillations were observed with S-E under both uniform luminance and drifting grating. Under uniform luminance, the average power for S-E was (2.2 ± 0.3) × 10−4 μV2/Hz, while for T-E it was (8.3 ± 0.8) × 10−5 μV2/Hz (P < 0.0001, Mann–Whitney U test). Similarly, under full-screen drifting gratings, the average power for S-E was (6.2 ± 0.6) × 10−4 μV2/Hz and for T-E it was (1.6 ± 0.1) × 10−4 μV2/Hz (P < 0.0001, Mann–Whitney U test). The gamma gain recorded by S-E was significantly higher than that of T-E with an average gain of 5.3 ± 0.7 compared to 1.9 ± 0.1 (P < 0.0001, Mann–Whitney U test). Additionally, the peak frequencies during drifting grating were quantified, and there were no significant differences in the average peak frequencies between the two types of electrodes (P > 0.05, 27.5 ± 0.4 Hz vs. 27.7 ± 0.6 Hz) (Fig. lG). In summary, the relative gain in the gamma band (20 ~ 40 Hz) is notably stronger, and the amplitude of gamma oscillations is much higher with S-E compared to T-E. However, there were no significant differences in the peak frequency of gamma oscillations between electrodes with different tip sizes.
Much stronger surround suppression in size tuning sampled by sharp-tip electrode
The visually induced gamma oscillations depend on the size of the stimulus. To further investigate the size tuning measured by two types of electrodes, it is necessary to determine the center of RF for LFP recorded from these two electrodes. Spiking activity and gamma oscillations were both recorded and quantified in the S-E recorded, whereas only the gamma oscillations were analyzed in the T-E recorded. The RF center was determined by placing a thin drifting grating patch at successive positions along either perpendicular or parallel axes to the optimal orientation and measuring its response to the drifting stimulus. The position with the highest gamma response was identified as the RF center (position “0” on the axis) when recording with S-E and T-E (Fig. 2A and B).
After determining the RF center, neural activity could be elicited by gratings of various sizes, revealing a prominent power bulge in the gamma band (Fig. 3A). The size tuning of the 210 sites was measured using S-E, while T-E was used for the 96 sites. Most of the spiking activity and gamma oscillations recorded by S-E exhibited a peak followed by a decrease as grating sizes increased, with only a small subset showing an increase in both spiking activity and gamma oscillations with size. In contrast, the majority of gamma oscillations recorded by T-E continued to rise with increasing size (Fig. 3B). Figure 3C illustrates the population result obtained from averaging all recorded size tuning using both types of electrodes. Figure 3D depict the normalized size tuning recorded from S-E and T-E respectively. Our findings indicate a significant reduction in peak frequency with increasing grating size in S-E and T-E (P < 0.001, two-way ANOVA), while no significant difference was observed between S-E and T-E (P > 0.05, two-way ANOVA). However, the peak frequency of S-E recorded at 13°was found to be significantly higher than that of T-E, as determined by the Mann–Whitney U test (P = 0.0063) (Fig. 3E).
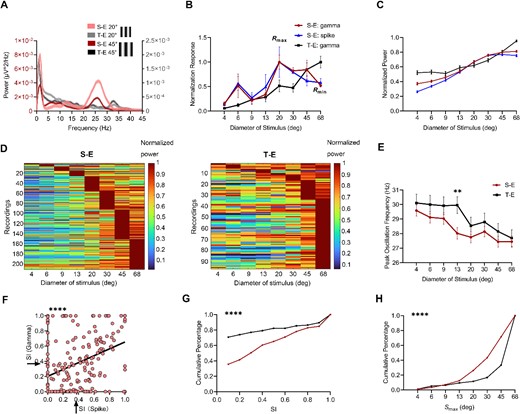
Comparison of size tuning for gamma power between two types of electrodes. A) Representative PSD of the LFP during the presentation of drifting grating with two stimulus size (20° and 45°) for two types of electrode. B) Examples of size tuning for gamma oscillations were shown, revealing surround suppression in both spiking activity and gamma oscillations in S-E. In contrast, the gamma power increases with stimulus size in T-E. C) Average gamma power from 210 sites in S-E and 96 sites in T-E. D) Normalized size tuning recorded by S-E (n = 210) and T-E (n = 96). E) the population results comparing peak frequency to stimulus size recorded between two types of electrodes. The peak frequency in gamma power exhibited a significant decrease as the grating size increased. (P < 0.001, two-way ANOVA), and the peak frequency of T-E was higher than that of S-E at 13° (** for P < 0.01, Mann–Whitney U test, error bars indicate SEM). F) Correlations in SI between gamma oscillations with spiking activity in T-E (the arrows represent the mean values and SI were 0.37 for both spiking and gamma response, R = 0.4, **** for P < 0.0001, Pearson correlation). G) Distribution of SI for S-E and T-E (**** for P < 0.0001, Mann–Whitney U test). H) Distribution of Smax for S-E and T-E (**** for P < 0.0001, Mann–Whitney U test).
To characterize the size tuning, SI and Smax were quantified. SI represents the degree of attenuation from peak response to minimum response, while Smax corresponds to the size that elicits maximum response (Rmax). Based on their respective size tuning, inhibitory effects (0.1 < SI ≤ 1) and non-inhibitory effects (0 ≤ SI ≤ 0.1) were categorized accordingly. The correlation between gamma oscillations and spiking activity in T-E was investigated using SI as a measure. Scatter plots illustrating this relationship were presented in Fig. 3F, revealing a moderate correlation (R = 0.4; P < 0.0001; Pearson Correlation). By analyzing the probability distributions of SI for gamma oscillations recorded using both types of electrodes, Fig. 3G demonstrates that S-E recordings exhibit a significantly higher proportion of inhibitory effects in their size tuning profiles compared to T-E recordings. (64.3% vs. 29.2%). Moreover, when comparing SI values between these two electrode types, it was found that S-E yielded significantly stronger results than T-E. The median recorded SI for S-E was 0.29, whereas it was 0 for T-E. (P < 0.0001, Mann–Whitney U test). Furthermore, we calculated the probability distributions of Smax (the size that generates Rmax). Figure 3H revealed significant disparities between measurements obtained from the two electrodes. The median recorded Smax for S-E was 45°, whereas it was 68°for T-E (P < 0.0001, Mann–Whitney U test). The Smax measured by S-E showed a considerably smaller value compared to that measured by T-E.
Validation of previous studies on linear electrode array and excluding the effect of spike leakage at sharp-tip electrode
Previous studies have frequently employed LEA for recording purposes (Adesnik et al. 2018; Olsen et al. 2012; Veit et al. 2017). Their findings revealed enhanced gamma power as stimulus size increase. Therefore, we re-examined the experiment in two lightly anesthetized mice by LEA recording (Fig. 4A). The RF center was determined based on gamma activity evoked by the strip grating, with each channel exhibiting a peak of gamma oscillations. The RF center was defined as the location encompassing the maximum number of channel peaks. Gamma power were calculated from channels corresponding to L2/3 and L4. Figure 4B demonstrates consistent findings with previous studies, indicating an increase in gamma power as stimulus size increases. Interestingly, we observed that peak frequency of gamma oscillations recorded using LEA occurred at two frequencies (Fig. 4C). Figure 4D shows the peak frequencies recorded by LEA fell within two frequency bands in different tracks from mouse I, specifically ranging from 30 to 35 Hz and from 35 to 40 Hz, respectively. The peak frequencies of gamma oscillations induced by three types of electrodes were further compared under drifting gratings (Fig. 4E). The highest peak frequency recorded by LEA (S-E: peak = 27.5 ± 0.4 Hz; T-E: peak = 27.7 ± 0.6 Hz; LEA: peak = 37.0 ± 0.5 Hz, P < 0.0001, Mann–Whitney U test).
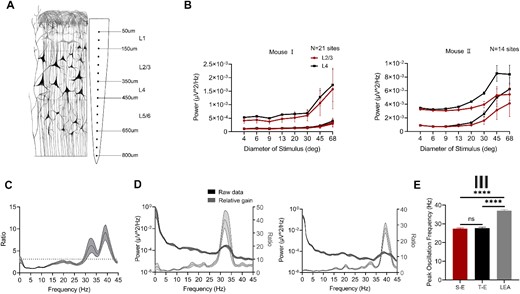
Size tuning for gamma power measured by the LEA. A) a schematic representation of V1 recording was shown using a 16-channel LEA, with gamma power measured from L2/3 (150 ~ 350 μm) and L4 (350 ~ 450 μm). B) Size tuning for the PSD of the gamma measured by the LEA in two mice, each line of the same color represents a track. D) the gamma gain collected by LEA (the dashed line indicates the average: 3.12). D) Representative PSD of the gamma, with peak frequencies occurring at two frequency bands from two tracks in mouse I. E) the peak frequency of LEA was higher than that of the other two types under a 68° grating (**** for P < 0.0001, ns for P > 0.05, Mann–Whitney U test).
The estimation of LFP relies on the assumption of a significant frequency disparity between LFP and spike waveform, achieved by isolating LFP using a low-pass filter. However, in the presence of overlapping frequencies, complete segregation may not occur, giving rise to concerns about spectral contamination when estimating causal relationships. This issue is particularly pronounced in simultaneous electrode recordings, affecting both simultaneous and separate electrode recordings, especially when there is high correlation in spike density functions. At S-E, a basic low-pass filter failed to eliminate spurious correlations originating from spiking activity. To address this concern, we employed a BSRA to assess and eliminate contamination of low-frequency LFP signals caused by spiking activity. The impact of this spike removal method is demonstrated in Fig. 5A left, while Fig. 5A right displays a 200 ms segment of the LFP signal before and after spike removal within that time frame. The algorithm effectively eliminates any influence of spiking activity on the LFP recordings. To further investigate the effect of spike removal using BSRA, we compared the PSD of LFP before and after applying this process which revealed minimal variation (Fig. 5B). Additionally, examples demonstrating size tuning were conducted and compared prior to and following spike removal with BSRA (Fig. 5C). Therefore, our findings suggest that spiking activity has negligible impact on gamma tuning measurements; consequently enabling accurate and reliable comparison of visual tuning for gamma between two types of electrodes in this study.
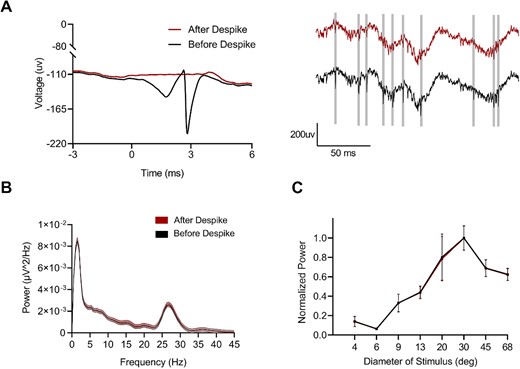
Negligible impact of spike leakage on the gamma tuning recorded by S-E. A) Raw data with spiking activity and no spiking activity removal by Bayesian algorithm. B) PSD of the LFP before and after removing spikes within a 200 ms window. C) Size tuning of gamma oscillations before and after spiking removal.
Discussion
The comparison of gamma response between the two types of electrodes in this study revealed that the S-E, characterized by higher impedance, exhibited significantly stronger gamma power compared to the T-E. When stimulated with drifting gratings of varying sizes, it was observed that most responses in gamma power from the S-E showed surround suppression; however, in contrast, the majority of gamma power sampled from the T-E continued to increase as size increased.
Generation and recording of the local filed potential
LFP is commonly believed to arise from an averaged combination of potential changes in the vicinity of the electrode tip, which are caused by current sinks and sources in the extracellular space (Goense and Logothetis 2008; Leopold et al. 2003). These sinks and sources are generated when synchronized excitatory synaptic input activates a neuron’s dendrites, resulting in a sink at the dendrite and a source at the soma (Mitzdorf 1985). The measured LFP is influenced by these dipoles depending on the relative positioning of the generating cell with respect to the local population. For instance, pyramidal cells have aligned dendritic arbors facing one direction opposite their somata. This arrangement, known as an “open field arrangement” (Mitzdorf 1985; Johnston and Wu 1995), allows dendritic processes on pyramidal cells in the cortex to strongly contribute to the LFP because potential differences from neighboring neurons do not cancel each other out due to their geometric alignment. However, dipoles generated by spiking activity itself exhibit higher speed and do not directly contribute to the power of LFP. While it was initially believed that excitatory postsynaptic potentials were the primary source of LFP-generating dipoles (Mitzdorf 1985; Mitzdorf et al. 1987), more recent studies have demonstrated that other sources such as inhibitory synaptic input (Hasenstaub et al. 2005), subthreshold membrane oscillations (Kamondi et al. 1998), and afterpotentials of somatodendritic action potentials (Buzsaki et al. 2002) also make significant contributions to the generation of LFP signals (Berens et al. 2008).
The measurement of LFP involves the utilization of microelectrodes inserted into brain tissue, typically spanning a range of 250 μm micrometers (Katzner et al. 2009; Xing et al. 2009). These electrical potentials reflect the collective activity of neighboring neurons and provide valuable insights into local neural processing. LFP represent the electric field effect generated by the electrical activity of multiple neurons. When a neuron exhibits electrical activity, it generates an electric current across its membrane, which propagates through surrounding cells and tissues until it reaches either the surface of the scalp or an implanted electrode. These induced current changes lead to modifications in various characteristics of LFP signals, including amplitude and frequency, which are influenced by factors such as neuron type, density, location, as well as electrode location and properties (Buzsáki et al. 2012). In this study, we compared differences in gamma signal acquisition between S-E and T-E. The amplitude of the gamma signal was significantly affected by varying surface area and impedance of electrode during gamma recordings. While using T-E approximates low-pass filtering to the LFP signal compared to S-E, it has minor impact on the peak frequency of visually induced gamma oscillations around 30 Hz. In terms of peak frequency recording, we have compiled a comprehensive summary of several previous studies on the peak frequencies of visually induced prominent gamma oscillations in different states across multiple species. In anesthetized monkey V1, Jia et al. (2013a) reported a peak frequency of 37.9 ± 0.1 Hz using a 96-channel Utah electrode array configuration. However, Berens et al. (2008) observed a peak frequency of 55 Hz utilizing tetrode arrays. In awake monkeys’ V1, Ray et al.(2009) recorded a peak frequency of approximately 50 Hz employing a 96-channel Utah electrode array configuration. Gieselmann and Thiele (2008) recorded peak frequencies ranging from 35 to 45 Hz with glass-coated tungsten electrodes. Murty et al. (2018) captured peak frequencies between 20 and 40 Hz using a similar setup with the aforementioned Utah electrode array configuration in awake monkeys’ V1 area. In awake mice experiments conducted by Veit et al. (2017), they measured a peak frequency around 28 ± 1 Hz by employing 16-channel linear electrodes. On the other hand, under anesthesia conditions in mice experiments performed by Adesnik (2018), also utilizing 16-channel linear electrodes, detected peak frequency of approximately 40 Hz. Hou et al. (2023) used glass-coated tungsten electrodes to record a result ranging from 33.2 ± 6.1 Hz. It is evident that these results exhibit significant variability, which may be attributed to many factors such as the animal model employed, the state of anesthesia or wakefulness during recording, and the characteristics of the electrodes used. Surprisingly, we observed distinct variations in peak frequencies across different recording tracks when using LEA electrodes on the same mouse, with some frequencies centered around 30 Hz and others around 40 Hz. Therefore, it is imperative to further elucidate the underlying factors influencing these peak frequencies in subsequent investigations.
Size tuning for gamma oscillations related to the recording electrodes
Significant variations in size tuning were observed among different types of electrodes recorded in V1. Specifically, visually induced gamma power from S-E electrodes exhibited suppressive, counter-suppressive, or non-suppressive effects akin to local spike activity (Hou et al. 2023). These findings align with the discovery that changes in slow gamma power were not consistently associated with grating stimulus size (Murty et al. 2018). Subsequently, Han et al. (2021) modeled and validated this phenomenon using data from Murty et al.’s (2018) study by establishing a connectivity network of V1 neurons and drawing conclusions consistent with experimental results: under large grating stimuli, gamma power demonstrates inhibition. Other researchers have reported that gamma power increases steadily as stimulus size increases, which is similar to our findings on T-E electrodes (Gieselmann and Thiele 2008; Jia et al. 2011; Jia et al. 2013a; Jia et al. 2013b; Veit et al. 2017; Han et al. 2022). We propose that the choice of electrodes may be one of the potential factors contributing to differences in the size tuning of gamma activity. The impact of electrode size and shape on the averaging of local signals has been investigated in recent and earlier studies (Berens et al. 2008; Freeman 1978; Katzner et al. 2009; Li et al. 1995; Nelson et al. 2010; Pesaran 2009; Xing et al. 2009; Yaeli et al. 2009). Extensive research has consistently demonstrated that low impedance electrodes, as employed in previous studies (Lim et al. 2021; Mitzdorf et al. 1987; Sakkaki et al. 2016; Vallone et al. 2016), capture electrical potentials across a substantial area of the brain. However, depending on the specific research question under investigation, different types of electrodes have been utilized. The predominant use of high-impedance electrodes has played a pivotal role in effectively examining single neuronal activity and isolating individual neuronal responses. Nevertheless, it is important to note that these electrodes are limited to recording local potential alterations (Gray et al. 1989; Kayser et al. 2007; Gieselmann and Thiele 2008). Therefore, recordings obtained using S-E capture highly localized neuronal activity and may be influenced by nearby neurons surrounding the electrode. Conversely, recordings acquired with T-E encompass broader regions of neuronal activity as they represent measurements at the population level. The increase in stimulation size leads to an augmentation of gamma power across a wider range, thereby overshadowing any inhibition observed around the electrode.
Shortcoming and functional implications
Firstly, instead of concurrently implanting electrodes with varying tip sizes in the same V1 region of an animal to compare their differences in LFP signals, we conducted these comparisons across different animals. Hence, there is a limitation when comparing gamma signals. Secondly, despite extensive research on extracellular recordings, explaining the observed phenomena remains relatively challenging due to the highly diverse sources of LFP signals. This necessitates combining various signal observation methods to elucidate the relationship between LFP signals and other signals and further clarify experimental observations. Previous studies have demonstrated that the propagation of visually evoked LFP varies across different layers of V1. Specifically, at L2/3 and L5/6, the propagation distance was approximately 250um, whereas at L4, it was smaller with a measurement of only 200 μm (Xing et al. 2009). To ensure more precise results, it is crucial to consider the specific recorded layer’s range of LFP propagation during electrode selection. In layers with a limited propagation range, opting for lower impedance electrodes would enable recording of the LFP signal within a broader spatial extent. Conversely, high impedance electrode recordings were employed when capturing signals from regions with an extensive spread of LFP. In current LFP recording and studies, it is common practice to utilize electrodes with varying parameters; however, this may lead to discrepancies in experimental observations. Therefore, it is crucial to carefully consider the impact of different electrode properties on integration range as this can significantly affect the results of LFP signal analysis and its correlation with behavior. In future studies, it would be advisable to select electrodes for recording field potential signals based on specific research needs.
Acknowledgments
This study was supported by the National Natural Science Foundation of China (82121003, 82072011, 82330030), the Sichuan Science and Technology Program (24GJHZ0231, 2021YFS0369, 23DZYF2022), and the CAMS Innovation Fund for Medical Sciences (2019-12 M-5-032).
Author contributions
Haoran Deng (Data curation, Methodology, Writing—original draft), Yan Cui (Funding acquisition, Investigation, Methodology), Haolun Liu (Investigation, Methodology), Guizhi Zhang (Investigation, Methodology), Xiaoqian Chai (Data curation, Software), Xiaotong Yang (Investigation), Qiang Gong (Investigation, Methodology), Shuang Yu ( Methodology), Daqing Guo (Conceptualization), Yang Xia (Conceptualization, Funding acquisition), Dezhong Yao (Conceptualization, Data curation, Formal analysis, Supervision), Ke Chen (Conceptualization, Data curation, Formal analysis, Funding acquisition, Investigation, Methodology, Project administration).
Funding
This work was supported by the National Natural Science Foundation of China (82121003, 82072011, 82330030), the Sichuan Science and Technology Program (24GJHZ0231, 2021YFS0369, 23DZYF2022), the CAMS Innovation Fund for Medical Sciences (2019-I2M-5-032, 2019-I2M-5-039).
Conflict of interest statement: None declared.
References
Author notes
Haoran Deng and Yan Cui contributed equally.