


Abstract
In the absence of hearing during development, the brain adapts and repurposes what was destined to become auditory cortex. As cortical thickness is commonly used as a proxy to identify cortical regions that have undergone plastic changes, the purpose of this investigation was to compare cortical thickness patterns between hearing and deaf cats. In this study, normal hearing (n = 29) and deaf (n = 26) cats were scanned to examine cortical thickness in hearing controls, as well as differential changes in thickness as a consequence of deafness. In hearing cats, a gradient in cortical thickness was identified across auditory cortex in which it is thinner in more dorsal regions and thicker in more ventral regions. Compared with hearing controls, differential thickening and thinning was observed in specific regions of deaf auditory cortex. More dorsal regions were found to be bilaterally thicker in the deaf group, while more ventral regions in the left hemisphere were thinner. The location and nature of these changes creates a gradient along the dorsoventral axis, wherein dorsal auditory cortical fields are thicker, whereas more ventral fields are thinner in deaf animals compared with hearing controls.
Auditory cortex is designed specifically to discern small differences in pitch, tone, tempo, and many other aspects of sound that we may or may not be consciously aware of (Lamy et al. 2007). With so many characteristics of sound to dissociate, auditory cortex has developed subregions that are specialized to analyze particular components of the sound, and subregions that combine acoustic stimuli with other senses (Galaburda and Sanides 1980; Romani et al. 1982; Rauschecker and Tian 2000). The constant influx of information allows for an always-adapting auditory cortex, with mature experimental animals showing enhanced areal representation of sounds correlated to their level of acoustic training (Witte and Kipke 2005; Noreña et al. 2006). But what happens when this system is deprived of auditory input?
To investigate this, researchers use deafened animal models to probe the behavioral, structural, and functional effects that losing auditory input has on the brain. To probe the brain in a meaningful and reversible way, a method was developed that involves the opposition of small metal loops to the surface of the brain and running a cooled liquid through them to deactivate the underlying tissue—a “cooling loop” (Lomber et al. 1999). Specific regions of cortex can be turned off and back on again on a rapid timescale without permanent damage, giving researchers the chance to infer behavioral roles of isolated portions of the brain. Using this method in a congenitally deaf cat model, Lomber and colleagues demonstrated an interesting phenomenon called compensatory cross-modal plasticity; two of the auditory regions probed adapted to process very specific visual stimuli in the deaf animals (Lomber et al. 2010). In brief, the posterior auditory field (PAF) enhanced peripheral visual localization abilities while processing in the dorsal zone of auditory cortex (DZ) allowed for superior visual motion detection. Both of these behaviors were brought down to control levels when the appropriate regions were cooled in the deaf animals and the enhanced abilities returned upon rewarming. Another auditory region tested using this method was the auditory field of the anterior ectosylvian cortex (FAES). In a hearing cat, this region is typically involved in orienting toward auditory stimuli; however, this region is associated with visual localization in the deaf cat. This was found when FAES was cooled in the deaf cat, and a visual localization deficit was seen, an effect that was entirely absent in the hearing controls (Meredith et al. 2011). It was reasoned that the role of FAES had appeared to switch sensory, but not functional roles in the absence of hearing, which suggests that cross-modal plasticity may be limited to connections and roles already imposed on an area.
Alternatively, compensatory plasticity has been explored anatomically, by injecting retrograde tracers into regions of interest (ROIs) to show if and by how much the axons originating from other regions of the cortex change in relative numbers to the injected site. Many studies of this sort have been run using the deaf cat as a model (Butler and Lomber 2013; Kok et al. 2014; Chabot et al. 2015; Wong et al. 2015; Butler et al. 2016, 2017, 2018; Meredith et al. 2016), and findings suggest multiple sites of compensatory cross-modal plasticity. For instance, deaf DZ was found to have increased inputs from the posterolateral lateral suprasylvian area, a visual region involved in motion detection (Kok et al. 2014). PAF has also been probed in both deafened (Butler et al. 2016) and congenitally deaf (Butler et al. 2017) cats, with alterations in connectivity to visual regions found in both cases, but to a much greater extent in the congenital model. As further evidence of cross-modal plasticity in the deafened cat, it was found that there was an increased density and size of dendritic spines in the supragranular layers of FAES in the deaf animal, representing an increase in the maturity and number of corticocortical connections to this area (Clemo et al. 2016). Cross-modal inputs to FAES typically terminate in these layers, and it was postulated that these changes may help to explain the mechanisms behind cross-modal plasticity. Functionally, independent component analysis has been used to probe resting state MRI scans of deafened cats (Stolzberg et al. 2018), with alterations found in some between-network correlations relative to hearing controls. Six of the ten changes found involved auditory-related functional networks, providing further evidence of a compensatory plasticity occurring following sensory loss.
With behavioral, histological, and functional studies all pointing to the presence of plasticity in deaf auditory cortex, what can be seen in regards to the thickness of the cortical sheet? Housing neuronal cell bodies, glia, and the majority of the synapses in the brain, the thickness of cortical gray matter could reveal regions involved in plasticity at a macrostructural level. Using structural Magnetic Resonance Imaging (MRI) in an ultra-high-field 7-Tesla scanner, the thickness of auditory cortical regions was measured in neonatally deafened cats as well as healthy controls to assess what happens to the thickness of 14 auditory regions after sensory loss.
Structural MR-based analysis is a noninvasive method of examining the neuroanatomy of humans and animals. It has been used to measure differences after maze training in mice, showing increases in hippocampal or striate cortex volume depending on the cue used in the maze (spatial or visual), and histological evidence demonstrating that this kind of change could be driven by the remodeling of synaptic connections (Lerch et al. 2011; Kassem et al. 2013). These studies have also been performed in humans, with one showing that the volume of the posterior hippocampus correlated with the amount of time spent as a taxi driver, and the inverse relationship was seen in the anterior hippocampus (Maguire et al. 2000). Another study revealed that the thickness of regions within the insula, somatosensory, auditory, and prefrontal cortices changed with meditation experience, and the thickness of a region within the visual cortex was even correlated with overall lifetime experience (Lazar et al. 2005). Additionally, some studies have looked to demographic features such as sex and age to examine their contributions to the thickness of gray matter (Sowell, Thompson, Holmes, Batth, et al. 1999a; Sowell, Thompson, Holmes, Jernigan, et al. 1999b; Sowell et al. 2001, 2003; Luders et al. 2006), finding that in human studies, there can be a significant impact from these variables. Morphological changes correlating to neurodegenerative diseases have also been investigated, with various studies on the morphological changes following the onset of Alzheimer’s Disease (Lerch et al. 2008; Velayudhan et al. 2018). The effects that deafness has on macrostructural features of the human brain have also been investigated using MRI, although most studies show limited or absent changes in auditory-related GM thickness or volume, possibly due to the spatial resolution typically possible in these studies. A fairly consistent result, however, is one of a decrease in WM volume around deaf auditory cortex (Emmorey et al. 2003; Penhune et al. 2003; Shibata 2007; Allen et al. 2008; Li et al. 2012; Hribar et al. 2020). The measurement of gray matter thickness may reveal the health and use of cortical regions, but exact mechanisms contributing to these measurements cannot be determined at this level of analysis. Any changes found in MRI cortical thickness are the result of many alterations at the cellular level, as such more concrete conclusions on the causes should be limited to studies in which micro-scale analyses can be run in parallel.
The other method for measuring cortical thickness is more invasive but arguably more accurate: histological measurement. To perform this tissue-based measurement, the brain must first be perfused with a fixative such as paraformaldehyde prior to extraction from the skull. This fixation hardens the tissue to allow it to be handled without disintegrating but brings with it a small amount of shrinkage in the process. Once extracted, the brain may be sliced in a chosen plane, and multiple series of tissue slices may be stained for various markers. Once mounted onto slides, each slice may be analyzed using a light microscope to obtain measurements at an incredibly high spatial resolution relative to MRI. This method was used by Berger and colleagues to measure the thickness of select regions of auditory cortex in a congenital deaf cat model alongside hearing controls, both in terms of overall thickness as well as separating the data into subsets of layers (Berger et al. 2017). They found that for overall thickness of gray matter (cumulating cortical layers I-VI), primary (A1) and secondary auditory cortex (A2) were thinner in deaf animals. However, when considering only layers IV-VI, A1, A2, as well as DZ were found to be thinner in the deaf, yet layers I-III were unaffected for all three regions. Unfortunately, A1, A2, and DZ were the only auditory areas examined in this work due to the plane of slicing chosen. Taking any measurements where the cortical sheet begins to dip into a sulcus is confounded by oblique sectioning through the layers, causing an overestimation of thickness to varying degrees. This issue is absent in MR-based measurement methods, but at the cost of spatial resolution.
Until recently, a three-dimensional cortical atlas of the adult cat has not existed. To remedy this, Stolzberg et al. (2017) used past atlases in combination with high-resolution MRI scans of mature cats to design and model an atlas which they called the Catlas. This atlas contains 71 bilateral cortical regions and 9 sub- or noncortical regions which include the cerebellum and midbrain/brainstem gray matter structures. Lines defining areal borders were created using delineations of best agreement between multiple atlases and drawn on a three-dimensional average brain. The files provided with the Catlas also contain the average image of 8 mature animal scans which is in alignment with the atlas, allowing for easy normalization and use of data in other studies. In the current research, only the 14 bilateral auditory areas are used, but future work could examine visual, somatosensory, and all other regions.
In the current study, the thickness differences of auditory cortical subregions between hearing and neonatally deafened cats were examined using ultra-high-field 7 T MRI. Due to the histological work done in congenitally deaf cats (Berger et al. 2017), we hypothesized that the auditory cortical regions in the deaf animals will have shrunk in thickness relative to the hearing group. Using structural T1-weighted images and the open-source software Advanced Normalization Tools (ANTs), mean thicknesses for each of the 14 bilateral auditory cortical regions were assessed and compared across the two groups. Due to the proposed effects of synaptic pruning and the aforementioned findings by Berger and colleagues (Berger et al. 2017), it is predicted that auditory cortex of the deaf group will be thinner than the hearing controls. Specifically, out of the three regions, only A1 and A2 are expected to be significantly thinner in this analysis, as DZ in Berger’s work had very minimal overall thickness changes and was only found to have changed on the scale of the subgranular cortical layers. The work here will lay groundwork for future studies in which the nature of any differences can be dissected using alternative or combinatorial approaches.
Materials and methods
All procedures were conducted in compliance with the National Research Council’s Guide for the Care and Use of Laboratory Animals (2011; 8th edition), the Canadian Council on Animal Care’s Guide to the Care and Use of Experimental Animals (1993), and National Institutes of Health Guide for the Care and Use of Laboratory animals (NIH Publications No. 8023, revised 1978). Furthermore, the following procedures were also approved by the University of Western Ontario’s Animal Use Subcommittee of the University Council on Animal Care.
Subjects
All subjects were domestic short-hair cats received from a commercial breeding facility (Marshall BioResources, formerly Liberty Laboratories, Waverly, NY). The animals were group housed with other cats in an enriched environment with a 12-h light cycle and ad libitum water. Their health was monitored by a veterinary technician on a daily basis and by a veterinarian once per week. The facility was regularly inspected by the Ontario Ministry of Agriculture, Food, and Rural Affairs, and the Canadian Council on Animal Care. Food was provided ad libitum for at least 1-h per day. The first 23 (13 hearing, 10 deaf) mature cats scanned were used for the generation of the average template and they plus an additional 32 cats (16 hearing, 16 deaf) were used in the analysis (total n = 55).
Auditory brainstem responses
The integrity of the auditory pathway was confirmed in the hearing population of animals. Prior to deafening, the baseline hearing threshold of each cat was tested by the recording of an auditory brainstem response (ABR), a procedure that identifies the electrical signals from synapses in nuclei along the auditory pathway in the brainstem. During this procedure, the animal was sedated with the administration of 0.04 mg/kg dexmedetomidine, commonly known as dexdomitor, intramuscularly (i.m.), and then induced and maintained under gaseous general anesthesia of 1–4% isoflurane and 100% oxygen (by volume) delivered through a mask. This noninvasive procedure recorded auditory evoked electrical activity in the auditory nerve and brainstem pathways (Starr et al. 2008) through the placement of four subdermal electroencephalography (EEG) recording leads on the cat; one above each ear, at the mid-cranial scalp, and on the lower back (ground). Auditory stimuli were delivered to each ear simultaneously via earbuds placed in each of the ear canals, delivering squarewave clicks ranging between 1 and 80 decibels (dB). Evoked electrical activity was detected by the leads and recorded on a computer. All animals were considered hearing, without impairment, when they demonstrated a characteristic ABR present at or below 20 dB (World Health Organization, 2019; Institute for Quality and Efficiency in Health Care, 2006). Once the ABR was recorded, the effects of dexdomitor were reversed by administration of antipamezole (i.m.), with the same dose volume as the preceding volume of dexdomitor. For all animals, recovery was uneventful. An example of ABRs from hearing and deaf cats is provided in Fig. 3 of Chabot et al. 2015.
Induction of hearing loss
The population of deaf animals (n = 26) had a profound hearing loss (deafness) induced early in development using the ototoxic antibiotic neomycin (Leake et al. 1991). The neomycin selectively destroys hair cells of the cochlea (Xu et al. 1993). From postnatal day 1 (P1), kittens were subcutaneously administered neomycin daily until hearing thresholds were above 80 dB as determined by an ABR. In general, the threshold shift was observed by P25–P30. Follow-up ABRs were performed at least 3 months later to confirm deafness in these animals.
Animal preparation for imaging
In order to minimize any possible movement in the scanner, cats were anesthetized according to previously established protocols (Brown et al. 2013; Hall et al. 2014). Prior to each imaging session, cats were premedicated with a mixture of atropine (0.02 mg/kg s.c.) and acepromazine (0.02 mg/kg s.c.), then anesthetized ~30 min later with a solution of ketamine (4 mg/kg i.m.) and dexdomitor (0.022 mg/kg i.m.). Upon confirmation of an absent gag reflex, each animal was intubated, and an indwelling catheter was placed in the saphenous vein to facilitate intravenous delivery of fluids and anesthesia. Once prepared, the animal was placed in a sternal position within a custom-built apparatus that was originally designed for nonhuman primates (Gilbert et al. 2016). In brief, an 8-channel transmit and 24-channel receive radiofrequency coil setup was rigidly attached to a sled that contained the animal and all required equipment. The animal was placed in a sternal recumbent position and using towels for the body and a 3D-printed adjustable support for the head, the subject was vertically positioned such that the top of the head opposed the inner surface of the coil setup for best signal-to-noise ratio. Anesthesia was maintained during each session with ketamine (1.2–1.8 mg/kg/h i.v.) and spontaneously inhaled isoflurane (~0.5%) with medical oxygen (~1.5 L/m). After scanning was complete, animals were recovered until sternal recumbency was achieved, at which point they were placed into individual housing until the next morning, when they were returned to the colony. In all cases, recovery was uneventful.
Imaging
Structural MRIs were taken using a 7 T Siemens Magnetom MRI scanner (68-cm bore diameter) located at the Center for Functional Metabolic Mapping at Western’s Robarts Research Institute. The scanner was operating at a 350 mT/m/s slew rate and used the previously mentioned 8/24 channel transmit/receive radiofrequency coil (Gilbert et al. 2016). A high-resolution T1-weighted MP2RAGE image was acquired for each subject (repetition time (TR) = 6500 ms, echo time (TE) = 3.93 ms, flip angle 1 = 4°, flip angle 2 = 5°, 96 slices, and 0.5-mm isotropic voxel size).
Cortical thickness measurements
Raw DICOM files were converted to the compressed Neuroimaging Informatics Technology Initiative (NIfTI) file format and manually reoriented into stereotaxic space using an open-source software (3D Slicer; http://www.slicer.org), placing the image origin at the midsagittal interaural line for each subject. The images were then all manually skull-stripped using MRIcron (Rorden and Brett 2000). To create the average template image, 23 of these brain-only images were combined using the MultivariateTemplate-Construction2 function from the ANTs software toolbox (Avants et al. 2011). This script iteratively warps all input images together with a cost function to find the image space closest to all input images. Tissue probability priors were then created from this template for GM, WM, and cerebrospinal fluid (CSF) using antsAtroposN4, which corrects for field distortions and then segments tissues based on voxel intensity and local neighborhoods. The GM prior was then manually separated using MRIcron into cortical gray matter, deep gray matter, brainstem, and cerebellum. The template and its priors were then used in the antsCorticalThickness pipeline. Diffeomorphic Registration-based Cortical Thickness (DiReCT) is the method that the ANTs cortical thickness pipeline utilizes to generate thickness maps (Das et al. 2009). DiReCT first determines the GM/WM and GM/CSF borders. It then three-dimensionally draws the GM/WM surface and grows it in the direction of the GM/CSF border. Once the GM/CSF border is reached, all voxels along the growth line are filled with an intensity equal to the measured thickness of the tissue in millimeters. In this way, a thickness map is generated in which voxel intensity is related to local thickness of the cortical sheet. All subjects’ images had thickness maps extracted using this DiReCT measurement method. The cortical GM thickness maps were then aligned using nearest neighbor interpolation to the Catlas template image to have a common space for processing of the data.
Data preprocessing
Thickness maps in atlas space were then imported into MATLAB R2019b (The MathWorks, 2019) as matrices. First, a mask was created that included only the voxels within the dataset that had values for every single subject; that is, any voxel that had a 0 value for any given subject would be omitted from further analysis. This was done to ensure that each subject had the same number of data points going into the proceeding steps of preprocessing. To allow for the extraction of thickness means for each of the auditory regions in the Catlas for each subject, the Catlas image file was also imported into Matlab as a matrix. Using the intensity values in the Catlas matrix, populations of voxels were selected for each region and mean thickness values were calculated in each subject’s image. Considering that previous human MRI literature shows that age affects MRI-measured cortical thickness, age was linearly regressed using the mean thickness across all regions as the dependent variable and the age in days of each subject at the time of scanning as the independent variable (Fig. 1). The effects of sex and group were also examined using unpaired t-tests. No effect of sex or group was found in overall mean thickness in this dataset.
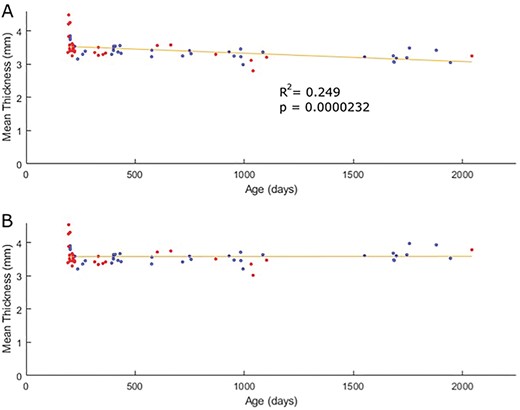
Scatterplots of mean thickness before a) and after b) linear age regression. Each point represents one subject, with hearing cats indicated in blue and deaf cats in red.
Data analysis
Once all data had been preprocessed, means for each region were calculated for each group and t-tests were run between the ROIs across groups. As there were 28 tests performed, all P-values were corrected using the Benjamini–Hochberg False Discovery Rate (Benjamini and Hochberg 1995) procedure with an alpha of 0.05, yielding 12 significant thickness differences between the hearing and deaf groups. The positions of each region in stereotaxic space were also examined relative to the thickness changes observed using linear regression in the dorsoventral and rostrocaudal axes.
Results
Effects of age, sex, and group on thickness values
Age was found to have a significant effect across all subjects and was consequently linearly regressed out by region (Fig. 1). Effects of sex (P = 0.1141) and group (P = 0.0568) were not found to be significant.
Auditory cortical thickness in hearing cats
Cortical thickness is not uniform across auditory cortex. Overall, the most dorsal regions of auditory cortex tend to have the thinnest gray matter (Figs 2 and 3). These areas include DZ (3.33 ± 0.02 mm), A1 (2.68 ± 0.01 mm), and the dorsal division of the posterior ectosylvian area (dPE, 2.79 ± 0.02 mm). In contrast, ventral regions of auditory cortex, such as the temporal area (T, 5.06 ± 0.02 mm), insular area (IN, 4.68 ± 0.02 mm), ventral division of the posterior auditory field (vPAF, 3.37 ± 0.02 mm), and ventral auditory field (VAF, 4.41 ± 0.03 mm), are significantly thicker than dorsal areas.
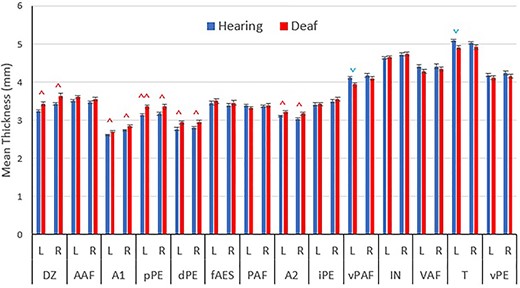
Mean cortical thickness values for each auditory region. Regions sorted based on dorsoventral position in the brain, with more dorsal regions being on the left. Blue downward pointing arrows ( ) indicate significant decreased thicknesses in the deaf group and red upward pointing arrows (
 ) indicate increased thickness. Data presented as mean + SEM. ^P < 0.05, ^^P < 0.01 between the hearing and deaf conditions.
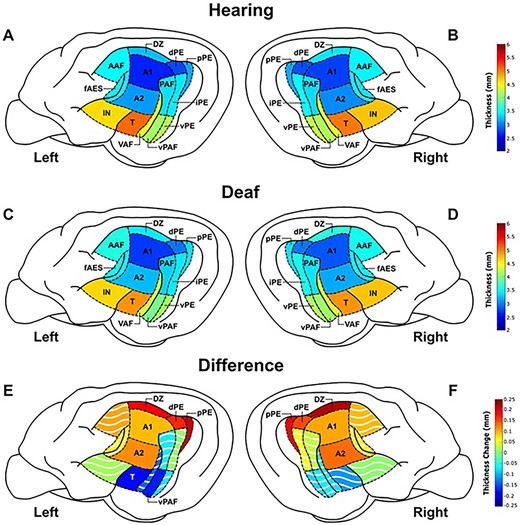
Visual representation of mean thicknesses and thickness differences between the two groups. ROIs in the hearing left a) and right b) hemispheres and deaf left c) and right d) hemispheres are shown with mean thicknesses in mm. Thickness differences between the two groups in the left e) and right f) hemispheres shown as deaf mean minus hearing mean for each ROI in mm, with solid colors denoting significant changes (Table 1). The dorsal zone (DZ), dorsal and posterior divisions of posterior ectosylvian auditory cortex (dPE, pPE), primary auditory cortex (A1), and secondary auditory cortex (A2) were all significantly thicker in the deaf group bilaterally. Temporal auditory cortex (T) and the VPAF were found to be significantly thinner in the left hemisphere only.
Auditory cortical thickness differences in deaf cats
Of the 14 bilateral (28 total) regions examined in this study, 10 regions were significantly thicker in the deaf group compared with the hearing group (Fig. 3, Table 1). These regions were primary auditory cortex (A1L P = 0.020, A1R P = 0.033), secondary auditory cortex (A2L P = 0.034, A2R P = 0.015), dorsal zone (DZL P = 0.015, DZR P = 0.015), the dorsal division of the posterior ectosylvian auditory cortex (dPEL P = 0.015, dPER P = 0.021), and the posterior division of the posterior ectosylvian auditory cortex (pPEL P = 0.006, pPER P = 0.015).
Thickness changes across all auditory ROIs in each hemisphere. Data presented as mean thickness of the deaf group minus mean thickness of the hearing group in mm. Regions sorted based on dorsoventral position, with DZ being the most dorsal and vPE being the most ventral, and 12 regions were found to be significantly different between the groups out of the 28 tested. P-values are adjusted for multiple comparisons. *P < 0.05 and **P < 0.01 between the hearing and deaf conditions.
 |
|
Thickness changes across all auditory ROIs in each hemisphere. Data presented as mean thickness of the deaf group minus mean thickness of the hearing group in mm. Regions sorted based on dorsoventral position, with DZ being the most dorsal and vPE being the most ventral, and 12 regions were found to be significantly different between the groups out of the 28 tested. P-values are adjusted for multiple comparisons. *P < 0.05 and **P < 0.01 between the hearing and deaf conditions.
|
|
While all regions that were observed to be thicker in the deaf group were thicker bilaterally, there were two regions that had significant thinning in the left hemisphere, and thinning on the right that did not reach significance (Table 1). These two regions are the temporal cortex (TL P = 0.022, TR P = 0.229) and the ventral division of the posterior auditory field (vPAFL P = 0.022, vPAFR P = 0.434).
Lastly, there was a significant correlation between the thickness differences between the groups and the dorsoventral position of each ROI as assessed by the goodness of fit of a linear equation: R2. The stereotaxic coordinates of the centroid of each ROI were calculated and then plotted against the thickness differences between the groups (Fig. 4). The more dorsal regions in auditory cortex were thicker in the deaf group relative to the hearing group, while the more ventral regions were thinner. This correlation was found to be highly significant, with R2 = 0.7579 and P < 0.00001. No significant anteroposterior correlations of this kind were identified (R2 = 0.0617, P = 0.2025).
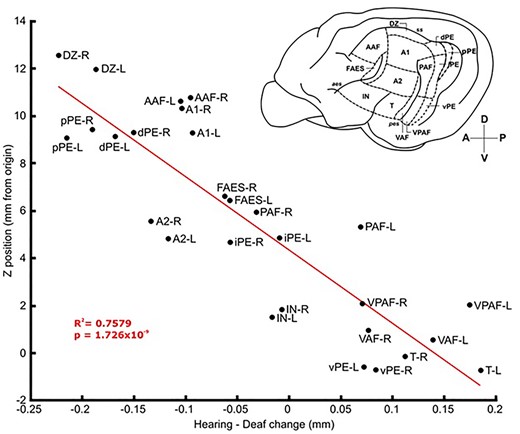
Thickness change versus vertical position of auditory ROIs in the brain. Thickness change was calculated as mean thickness of each ROI in the hearing group minus mean thickness in the deaf group. A linear line of best fit with properties R2 = 0.7579, P = 1.726 × 10⁻⁹ shows that the more dorsal in the brain a region is the more likely that it is thicker in the deaf group and vice versa. Image in top right is a lateral view of the left hemisphere of the cat brain with auditory regions labeled. For all full ROI names, refer to the list of abbreviations provided. L or R at the end of each abbreviation indicates left or right hemisphere, respectively.
Discussion
The purpose of this study was to quantify the differences in auditory cortex thickness between hearing and deaf cats using MR images. In general, more dorsal regions in the hearing and deaf groups tended to be thinner than more ventral regions (Figs 2 and 3). Comparing the hearing and deaf groups, 12 regions were found to be significantly different (10 thicker and 2 thinner in deaf). The physical locations of the thicker and thinner regions in the deaf group are clustered, with the thicker regions being more ventral. This clustering caused a very significant correlation to emerge when the dorsoventral position was examined in the brain of each ROI relative to the thickness change across groups (Fig. 4).
MRI-based cortical thickness measurements
As a noninvasive and within-subject repeatable way to examine the brain, cortical thickness estimations from MR images are a vital tool. However, this does not mean that it can replace more invasive methods such as tissue staining followed by microscopy-based measurements. This is because while gray and white matter appear to have a solid contrast in the most commonly used scan type for these studies (T1-weighted), the perceived border may shift depending on tissue microstructure. One study examining these effects found that MRI thickness measurements are affected by water, iron, and myelin content (Lorio et al. 2016), but this is not an exhaustive list. Taking this into consideration, all thickness changes found in this, and any other MR-based study, should be inferred as changes in tissue structure between experimental populations, but not directly related to the distance between the CSF and layer VI of GM.
What does a thicker auditory cortex mean?
Cortical thickness as measured by MRI is influenced by many things, including myelin content (Natu et al. 2019), cell type and density, and neuropil density. The variables that contribute to cortical thickness are unknown, but there is evidence to suggest that increased thickness in an MR image is associated with more abundant afferent connections than the same region that is thinner in a different subject or group, and vice versa (Wagstyl et al. 2015). These connections may be corticocortical or thalamocortical in nature. Multiple studies have examined the effect of inducing sensory loss before and after thalamocortical circuits that are established in the developing brain, with the consensus that changes are more pronounced when sensory loss is induced prior to the sensory critical periods (Mezzera and López-Bendito 2016). Even though the ototoxic deafening method used in this study induced deafness in the first month, after basic thalamocortical circuits were established, thalamocortical connectivity changes may still have influenced cortical thickness. With this in mind, the increase in thickness in the deaf group can be understood as an increase in thalamocortical and/or corticocortical connection strength causing a change in the myelination and/or synaptic distribution in these regions. Previous work has established that some regions of auditory cortex can undergo cross-modal plasticity and be repurposed in the deaf brain (Lomber et al. 2010, 2011; Meredith and Lomber 2011). As Clemo and colleagues demonstrated an increase in dendritic spine density in fAES of ototoxically deafened cats (Clemo et al. 2016), it would appear that any new function most likely requires the same auditory cortical connections to perform any necessary processing, as well as the additional strength of already existing connections from other modalities such as vision. This does not mean that there would be more abundant connections from visual areas but that the already existing connections are strengthened through an increase in synaptic density in the auditory region. In the case of a thinner region, this may be associated with a decrease in synaptic density, or an increase in myelin content in that area, as examined through brain development in humans using microstructural changes seen in histological studies (Sowell, Thompson, Holmes, Batth et al. 1999a; Sowell, Thompson, Holmes, Jemigan, et al. 1999b; Sowell et al. 2001). This explanation may account for the lack of any significant changes in cortico-cortical projections to deaf auditory cortex as assessed by retrograde tracer studies examining connections of regions such as PAF and A2 (Butler et al. 2016, 2018). This, along with the known cross-modal plasticity in PAF as demonstrated by Lomber et al. (2010), suggests that, perhaps, when comparing plasticity of connectivity after sensory loss, anterograde tracer studies are necessary for a more complete picture.
From Fig. 4, it can be seen that there is a correlation between the dorsoventral location of any given auditory cortical region and thickness changes following deafness. The more dorsal a region is, the thicker it will be relative to the control group. This correlation is highly significant (P < 0.00001) and could be due to the fact that regions with similar roles to one another are often near each other or even share a border, such as the clustering of the “what” and “where” pathway regions in the cat cortex (Lee and Winer 2011). This proximity effect could form clusters of regions with similar tasks that allows for axial correlations such as this to emerge.
Comparison with histological studies
Interestingly, previous histologically based work in cats does not necessarily agree with the present findings. Cortical thickness of A1 in hearing cats has been found to be ~1.7 mm using various stains under light microscopy by one research group (Winer 1984; Winer and Prieto 2001), and 1.84 mm by another group (Berger et al. 2017). These values are >30% lower than the values in the present work (2.68 mm) and demonstrate the need to better classify and understand the thickness measurements from MR images in the future as this difference should not be due to tissue shrinkage after fixation alone. In the more recent study, Berger and colleagues (2017) also compared the thickness differences in a select few auditory regions between congenitally deaf and control subjects. It was found that GM thickness as a whole in A1 and A2 was significantly thinner in the deaf group. Furthermore, the GM was subdivided into layers I-III and IV-VI to extend the analysis, and it was revealed that A1, A2, and DZ all showed significant thinning in layers IV-VI in the deaf group. This contrasts with the current results and suggests either a considerable difference between the congenital model used in this study and the current neonatally deafened group, or some confound interfering with the MRI thickness measurements such as myelin distribution. Unfortunately, this shows that histological and MRI-based methods of measuring cortical thickness may not be directly comparable without further investigation of the MR signal in relation to cortical microstructure. To obtain this data, one could acquire in-vivo MRI followed by ex-vivo scans in the same subjects. The brain tissue could then be sliced and stained for cell bodies as well as myelin, and thickness measurements could be compared across the three datasets to determine a possible algorithm for converting and comparing between histological and in-vivo MRI thickness measurements.
Comparison with human MRI studies
Looking at the overall pattern of thickness in sensory cortices, it has been noted in the past that the more primary regions tend to be thinner than higher level areas as seen using human and macaque MR images and functional hierarchies (Wagstyl et al. 2015). Using this information, Zoellner and colleagues used thickness as a biomarker to better define primary auditory cortex in humans using MR images with validation using MEG data (Zoellner et al. 2019). These results agree with the present findings, as A1 was the thinnest region measured in both our hearing and experimental groups. However, human deafness literature varies, with some work showing no cortical thickness changes between hearing and congenitally deaf groups (Emmorey et al. 2003; Penhune et al. 2003), and others showing decreases in primary (Eckert et al. 2012) or primary, secondary, and tertiary (Neuschwander et al. 2019) auditory cortex with high frequency and general hearing impairment, respectively. The increases in thickness found in the current dataset are not supported by this human work and could suggest differential plastic changes in the deaf cat cortex relative to humans due to different requirements for cross-modal use of auditory cortex, such as the unique use of sign language in deaf humans (Allen et al. 2008; Pénicaud et al. 2013; McCullough and Emmorey 2021).
Regardless of the large thickness change differences between species, it has been shown that the amount of crossmodal plasticity seen in human subjects can be correlated with their clinical outcomes after interventions such as cochlear implants. This is most often done with functional correlates such as EEG. In one study, it was shown that the latency of the N1 component (thought to represent the initial sensory processing of a region in EEG studies) of visually evoked potentials in auditory cortex is negatively correlated with speech perception in noise in children with cochlear implants. The authors of this work surmised that this represented a decreased maturation of the circuits and/or speed of processing (Campbell and Sharma 2016). Research focused on deaf children has also shown that a relative increase of crossmodal, as opposed to intramodal, plasticity was negatively correlated with cognitive performance in unilateral cochlear implant users in the processing of sound cues and language skills (Gordon et al. 2013), or even abnormal or immature processing as determined by EEG waves (Gordon et al. 2008). Any functional plasticity incurred after deafness appears to have relatively permanent effects on specific behaviors, and this could be extrapolated to cortical thickness due to the close relationship of thickness and function of cortical gray matter.
Conclusions
The auditory cortex of the hearing cat as measured by high-field MRI appears to follow patterns seen in other species vis a vis functional hierarchies versus thickness (Wagstyl et al. 2015) but appears to possibly be an overestimate of true thickness based on past histologically based work (Winer 1984; Winer and Prieto 2001; Berger et al. 2017). Differential thinning and thickening of distinct regions of auditory cortex was observed in the deaf cat relative to normal hearing controls. These thickness changes between the groups followed a dorsoventral trend in which more dorsal regions were thicker in the deaf group and ventral regions were thinner. Future work using MRI data and histological work in parallel could be performed to better quantify the effects of various factors (myelination, synaptic density, neuronal density, etc.) in determining GM thickness from MR images.
- A1
Primary auditory cortex
- A2
Second auditory cortex
- AAF
Anterior auditory field
- DZ
Dorsal zone of auditory cortex
- dPE
dorsal posterior ectosylvian cortex
- fAES
auditory field of the anterior ectosylvian sulcus
- iPE
intermediate posterior ectosylvian cortex
- IN
insular cortex
- PAF
posterior auditory field
- pPE
posterior ectosylvian cortex
- T
temporal cortex
- VAF
ventral auditory field
- vPAF
posterior auditory field
- vPE
ventral posterior ectosylvian cortex
Acknowledgments
We thank Paisley Barnes for technical and procedural assistance during this study, Alessandra Sacco for editing of the manuscript, and Dr Ali Khan, Dr Mark Daley, Dr Brian Corneil, and Dr Brian Allman for guidance and expertise throughout the Master’s process.
Funding
Canadian Institutes of Health Research (CIHR); Canada Foundation for Innovation (CFI).
Conflict of interest statement None declared.