


Abstract
Sleep consolidates memory for procedural motor skills, reflected by sleep-dependent changes in the hippocampal-striatal-cortical network. Other forms of procedural skills require the acquisition of a novel strategy to solve a problem, which recruit overlapping brain regions and specialized areas including the caudate and prefrontal cortex. Sleep preferentially benefits strategy and problem-solving skills over the accompanying motor execution movements. However, it is unclear how acquiring new strategies benefit from sleep. Here, participants performed a task requiring the execution of a sequence of movements to learn a novel cognitive strategy. Participants performed this task while undergoing fMRI before and after an interval of either a full night sleep, a daytime nap, or wakefulness. Participants also performed a motor control task, which precluded the opportunity to learn the strategy. In this way, we subtracted motor execution-related brain activations from activations specific to the strategy. The sleep and nap groups experienced greater behavioral performance improvements compared to the wake group on the strategy-based task. Following sleep, we observed enhanced activation of the caudate in addition to other regions in the hippocampal-striatal-cortical network, compared to wakefulness. This study demonstrates that sleep is a privileged time to enhance newly acquired cognitive strategies needed to solve problems.
Introduction
The “eureka moment” for some of the most remarkable ideas, inventions, and works of art in human history have manifested over a night of sleep. A few of the most famous anecdotal accounts include Albert Einstein’s theory of relativity, Dimitry Mendeleev’s inception of the periodic table, the discovery of insulin by Frederick Banting, Niels Bohr’s insight into the structure of the atom, and Larry Page’s inspiration for Google. There is indeed something special about sleep that facilitates the process of insight into the solution to a problem (Lewicki et al. 1987; Walker et al. 2002; Stickgold and Walker 2004; Cai et al. 2009; Brand et al. 2010; Durrant et al. 2011; Sio et al. 2013; Beijamini et al. 2014; Fogel et al. 2015; Monaghan et al. 2015; Lewis et al. 2018; Perdomo et al. 2018; van den Berg et al. 2019). Problem solving involves reasoning, planning, strategies, and skills, which are important aspects of certain forms of procedural memory—the “how to” of long-term memory.
When a memory is initially acquired, it is not fully stabilized or fully integrated. At the system level, the newly encoded memory is stabilized through memory consolidation, which transforms the memory into a lasting, integrated, and more easily retrievable form. Sleep is becoming increasingly recognized as an optimal time for consolidating procedural memory and related skills (for reviews see Rasch and Born 2013; King et al. 2017), including memory involving the acquisition of novel cognitive strategies (Mandai et al. 1989; Smith and Weeden 1990; Smith and Wong 1991; Smith 1995, 1996, 2001; Plihal and Born 1997; Smith and Smith 2003; Fogel et al. 2007; Fogel et al. 2015; Nielsen et al. 2015; van den Berg et al. 2019). Still, it remains unclear how sleep transforms and enhances memory traces for novel strategies, which are needed to solve problems. This was the main aim of the current study.
Given the multifaceted nature of procedural memory and related skills (Cohen et al. 2005; Robertson 2009; King et al. 2017), several studies have employed experimental paradigms, which disentangle the motor execution components from cognitive components (Van Hedger et al. 2015; Nagai et al. 2017; van den Berg et al. 2019; Conte et al. 2020). These studies suggest that sleep preferentially enhances the more cognitive aspects over the purely motor aspects (particularly when motor skills are acquired implicitly), thus suggesting that they rely on distinct neural substrates. One classic example of a strategy-based procedural task is the Tower of Hanoi (ToH). Solving the ToH requires the execution of a sequence of motor movements to learn the underlying cognitive strategy (i.e., recursive logic; Fig. 1). The overall ToH recursive solution consists of moving n disks from the source peg (e.g., A) to the target peg (e.g., C), while using the remaining peg (e.g., B) as the “spare” peg. According to this logic, the key to solving larger, more complicated problems (e.g., the 5-disk solution) can be solved by breaking it down into a series of small problems (e.g., the 3-disk solution), which is repeated several times. There is only one optimal solution to the problem (i.e., using the minimum number of moves). Our recent work has shown that participants extrapolated the fundamental strategy of a simple 3-disk version of the ToH (i.e., a 7-move solution), to a more complicated 5-disk version (i.e., 31-move solution), but only if they slept during the retention interval (van den Berg et al. 2019). By contrast, there was no preferential benefit of sleep versus wake for the motor movements required to execute the solution to the problem, suggesting that sleep processes the recursive strategy, which is not achieved through sleep-related enhancement of the motor sequence per se.
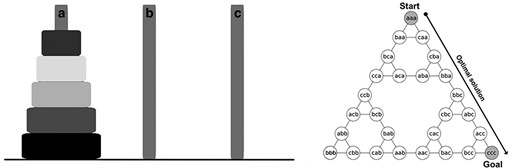
The 5-disk version of the Tower of Hanoi (left) and the graphical representation of the optimal solution for the 3-disk version (right). Each node represents the distribution of the disks, listed from left to right in order of increasing size, and each edge represents a move from one configuration to another. The puzzle starts off with all 3 disks on the left-most peg (aaa), ending in the goal configuration with all 3 disks on the right-most peg (ccc). Only one series of moves results in the optimal 7-move solution for the 3-disk problem. More complicated versions (e.g., the 5-disk problem) can be solved by recursively applying the logic needed to solve the 3-disk problem, iteratively, several times. Figure adapted from Fogel et al. (2015).
Despite behavioral advances in understanding sleep-facilitated problem solving, little is known about the related neurobiological substrates and processes. Existing knowledge regarding the neural correlates of sleep-related procedural memory consolidation largely comes from studies investigating motor sequence learning. More specifically, brain areas in the cortico-striatal-hippocampal network are recruited during the acquisition of a novel motor sequence. This memory trace is transformed (Fogel et al. 2017) and strengthened as a function of both practice (Doyon et al. 2002; Ungerleider et al. 2002) and time (Lehéricy et al. 2005). Recruitment of the putamen is central during the consolidation of memory for newly acquired motor sequences, which is further strengthened when the subsequent retention interval contains sleep versus wake, resulting in enhanced performance (Debas et al. 2010).
However, the putamen does not act in isolation. Sleep-dependent consolidation of newly acquired motor sequences can be dissociated into a motor aspect, which is reliant on the putamen, and a spatial aspect that relies on the hippocampus (Albouy et al. 2013a; Albouy et al. 2015). Evidence points to a competitive interaction between these brain areas (Albouy et al. 2013b), and interestingly, this suggests a role of the hippocampus for procedural memory consolidation when the task has a spatial component, and when consolidation is preferentially enhanced by sleep. Accordingly, the hippocampus seems to play an important role in initial procedural motor sequence learning, and acts in a dissociable way from typically motor-related brain areas (e.g., the putamen) following a period of consolidation, particularly one that contains sleep.
We hypothesize that an analogous, sleep-related consolidation process might take place for motor sequences that also involve complex problem-solving skills. A network of brain structures including the hippocampus, prefrontal cortex (PFC), and the striatum support goal-directed and decision-making behavior (Poldrack et al. 1999; Destrebecqz et al. 2005; Lappin et al. 2009; Pezzulo et al. 2014; Bick et al. 2019). These regions are recruited when solving the ToH and similar tasks, with the caudate playing a key role in this process (Doyon et al. 1996; Owen et al. 1996; Dagher et al. 1999; Rowe et al. 2001; van den Heuvel et al. 2003; Unterrainer and Owen 2006; Stocco and Anderson 2008). For example, activation of the caudate nucleus is observed only during active planning of a novel action versus continuous rule following (Monchi et al. 2006), suggesting a role of the caudate for novel and potentially higher order learning. The caudate is also implicated in skills required to perform the ToH, including error detection and response inhibition (Aron et al. 2003; Rubia et al. 2003, 2007; Stevens et al. 2009; Hochman et al. 2015), attentional control (Cieslik et al. 2015), associative learning (Jueptner et al. 1997; Bick et al. 2019), algebraic problem-solving (Stocco and Anderson 2008), automizing implicitly learned information (Lehéricy et al. 2005), and reward learning (Elliot et al. 2000; Lappin et al. 2009).
In summary, the neural correlates for the sleep-related memory consolidation of motor skills are relatively well known. By contrast, the neural correlates of sleep-related memory consolidation for strategy and problem-solving skills are less clear. To understand this further, two versions of the ToH task adapted for functional magnetic resonance imaging (fMRI) were employed: 1) the “classic” ToH and 2) a modified control (CTL) version of the task. This CTL version visually appears identical to and is operated in the same way as, the ToH, but participants instead execute a series of random movements. In this way, we could subtract out brain activations associated with motor execution movements required to perform the ToH task from the activations related to the cognitive strategy itself. It was hypothesized that 1) the greatest benefit in ToH performance would be from sleep, and 2) a sleep-dependent increase in brain activation would be observed in structures known to be involved in reward learning, planning, and problem solving (e.g., the hippocampus, caudate, motor cortex, and frontal cortex).
Materials and Methods
Participants
Power analyses based on similar studies from our group (Fogel et al. 2014), with alpha = 0.05, indicates that we would need a sample size of at least n = 15 for Sleep, Nap, and Wake groups to obtain 80% power when detecting a significant effect for our primary analyses of the behavioral and fMRI data. This is based on an effect size f = 0.9 for behavioral effects and a more conservative estimate of f = 0.7 for MRI effects. In order to ensure adequate power to control for multiple comparisons and account for bad/missing data, we collected n = 20 per group.
All participants were right handed, in good health, nonshift workers, and were not taking medications known to interfere with sleep. They had regular sleep schedules (within the hours of 10 PM–9 AM), a body mass index <30, and no history of sleep disorders. Participants had no history of chronic pain, seizures or head injury, and no mobility problems with their hands and fingers. To be included, participants had to report normal, or corrected-to-normal vision, score < 10 on the Beck Depression (Beck and Beamesderfer 1974) and the Beck Anxiety (Beck et al. 1988) inventories, and have no signs of sleep disorders indicated by the Sleep Disorders Questionnaire (Douglass et al. 1994). Participants were also excluded from the study if they reported having previous experience with the ToH, or similar tasks.
The first night of polysomnography (PSG) recording served as an acclimatization and sleep disorder screening night, which took place one week prior to the experimental session. Based on the results of the screening night, participants who had poor sleep quality (i.e., sleep efficiency (SE) < 80%), more than 10 respiratory events per hour (indicating signs of sleep apnea), or any other unusual behaviors during sleep that might indicate the presence of parasomnias, were excluded from further participation in the study. To ensure compliance with the experimental protocol, all participants were asked to wear a wrist-worn Motionlogger actigraph (Ambulatory Monitoring Inc., Ardsley, NY, USA) and to complete a log of their daily activities and sleep habits to verify that they maintained a regular sleep schedule for the duration of the study.
Five participants were excluded from the study: four participants for noncompliance with the study protocol based on irregular sleep schedules, and one who voluntarily dropped out of the study following the acclimatization and screening night. The final sample consisted of 60 healthy young adults (34 females) between the ages of 20 and 35 years (M = 24.38, SD = 4.44). Following screening, all participants were randomly assigned to either the Sleep (n = 20), Nap (n = 20), or Wake (n = 20) condition.
Ethics Statement
All participants were given a letter of information, provided informed written consent before participation, and were financially compensated for their participation. All study procedures were approved by Research Ethics Boards at the University of Ottawa and The Royal’s Institute of Mental Health Research (IMHR).
Experimental Design
Following screening, participants returned to the laboratory and underwent the experimental testing session (Fig. 2). Upon arrival, participants performed eight trials of the ToH and four trials of the CTL task while being scanned in the MRI (i.e., training session). This training session was then followed by either: 1) an 8-h overnight PSG recording (Sleep condition), 2) a 90-minute daytime PSG recording (Nap condition), or 3) an 8-h daytime wake period (Wake condition). After a >30-minute period to allow the effects of sleep inertia to dissipate, participants completed four trials of both the ToH and CTL tasks again, while being scanned in the MRI (i.e., retest session).

Overview of the experimental protocol in the Sleep, Nap, and Wake conditions. Sleep condition: The sleep condition participants arrived at the laboratory at approximately 08:00 PM were trained on the classic ToH and performed the CTL task. Participants then slept in the lab from approximately 11:00 PM to 07:00 AM, while their sleep was recorded via PSG. Upon awakening, participants were retested on the ToH and performed the CTL task. Nap condition: The nap condition participants arrived at the lab at approximately 10:30 AM, were trained on the ToH and performed the CTL task, and slept in the lab from approximately 01:00 PM to 02:30 PM, while their sleep was recorded via PSG. Upon awakening, participants were retested on the ToH and performed the CTL task. Wake condition: The wake condition participants arrived at the lab at 08:00 AM and were trained on the ToH and performed the CTL task. Participants then left the lab for the day with instructions not to nap (confirmed via actigraphy). The wake condition participants returned to the lab at 08:00 PM and were retested on the ToH and performed the CTL task. All sessions of the ToH and CTL tasks were completed while obtaining functional BOLD images using a block design (see section “MRI Imaging Acquisition and Analysis” for details). During the ToH testing and retesting sessions, participants performed a 5-disk version of the classic ToH task in addition to CTL task, to control for random motor movements (see section “Behavioral Tasks and Analysis” for details). The order of the ToH and CTL tasks was counterbalanced across participants.
Behavioral Tasks and Analysis
The present study used two computerized variants of the classic Tower of Hanoi (ToH) task, coded in MATLAB R2016a (Mathworks Inc., Natick, MA, USA) using the Psychophysics Toolbox extension v3.0.12 (Brainard 1997; Kleiner et al. 2007), adapted for MRI, including: 1) the “classic” ToH and 2) a modified control (CTL) version of the task.
Tower of Hanoi Task
A 5-disk version of the ToH task was used in the present study. This task requires the participant to learn and execute an underlying cognitive strategy (i.e., recursive logic), acquired through trial and error, with the aim of solving the puzzle with a minimum number of moves, i.e., the optimal solution (Fig. 1). The visual appearance of the task includes three identical pegs equally spaced apart, beginning with 5 disks stacked on the far-left peg in ascending order of size (largest disk on the bottom and smallest disk on the top). Participants were instructed that the objective of the task, for each trial, was to transfer all disks, moving them one at a time, from the beginning position on the far-left peg, to the goal configuration on the far-right peg stacked in the same ascending order, while obeying several simple constraints: 1) only one disk can be moved at a time, 2) only the upper-most disk from any one of the three pegs can be moved, and 3) a disk can only be placed on either an empty peg, or on another disk that is larger in size. Participants are informed of these constraints prior to performing the task. An MR-compatible fiber optic response button box (model HHSC-2×4-C; Current Designs Inc., Philadelphia PA, USA) comprising four push buttons located in a horizontal row at equal distance from each other was used to operate the task. Participants were instructed to control the on-screen movement of the disks as fast and as accurately as possible, by using the response box with their index finger, middle finger, and ring finger on their right hand only, corresponding to the left-most, center, and right-most peg, respectively. Each button-press controlled the movement of disks from and to one of the three pegs.
Each trial was followed by a 20-s rest period. A trial of the ToH task ended when all five disks were stacked in ascending order on the far-right peg, or if the maximum number of moves was reached before successful completion of the task. The maximum number of moves was set at three times the optimal number of moves (2N—1, where N is the number of disks, i.e., 25–1 = 31). Therefore, the maximum number of moves for the 5-disk task, for each trial, was set at 93 moves. For the rest periods, participants were shown all three pegs but with no disks visible, and they were instructed to abstain from pressing any buttons during this time.
(1)
In this way, the MAPE can be interpreted as the percentage difference from perfect performance for valid moves (e.g., 100% reflects perfect performance, whereas 50% reflects making twice as many moves as perfect performance, and 0% represents an infinite number of moves).
Tower of Hanoi Control Task
The purpose of the control (CTL) task was to control for (i.e., subtract out) brain activations related to the motor executions and visual characteristics of the ToH. The CTL task was visually identical to and was operated in the same way as, the ToH, but participants instead executed a series of random movements. Although these random movements adhered to the constraints of the classic ToH task (so as not to make illegal moves), the moves were otherwise random. Each random move was guided by a pair of visual cues appearing above the pegs to indicate the selection of a disk from (indicated by a green dot), and to (indicated by a red dot) one of the three pegs. Each trial of the CTL task ended when a total of 31 randomly guided moves were completed, corresponding to the number of moves for the optimal solution to complete the 5-disk ToH task. Importantly, the movements did not systematically follow the movements required to learn the underlying strategy needed to complete the ToH (i.e., recursive logic), but still required the same type of motor execution as the ToH (e.g., speed and number of movements per trial). Participants performed four trials of the CTL task, where each trial was followed by a 20-s rest period.
Behavioral Analysis
All behavioral statistical analyses were carried out using SPSS Statistics version 25 (IBM, Armonk, New York, USA). To ensure that learning did take place during the training session on the ToH task, repeated measures analysis of variance (ANOVA) for trial (trials 1 to 8) were conducted for errors, speed, accuracy, and SATO. To address our main hypotheses, and to explore whether sleep facilitated performance on the ToH task, separate one-way analysis of variance (ANOVA) with condition (Sleep, Nap, Wake) as a between groups factor were performed on the % improvement in errors, speed, accuracy, and SATO. A significant effect of condition was followed-up by planned comparison independent t-tests. Skewness in the distributions of the measures was normalized by taking the square root of the raw scores where appropriate.
Polysomnographic Recording and Analysis
PSG Recording Parameters
In-laboratory PSG was recorded with Embla N7000 32-channel amplifier system (Natus, Pleasonton, CA, USA) sampled at 500 Hz. EEG (Fp1, Fpz, Fp2, F3, Fz, F4, C3, Cz, C4, P3, Pz, P4, and Oz) and EOG (placed on the outer canthus of the eyes) were referenced to Fpz online with Afz ground, placed according to the international 10–20 system (Jasper 1958). A submental EMG channel was recorded as a bipolar derivation. All EEG electrode impedances were reduced to <5 KOhm.
PSG Analysis
Manual sleep stage scoring according to standard criteria (Rechtschaffen and Kales 1968; Iber et al. 2007) was completed by a single expert scorer using RemLogic analysis software (Natus, San Carlos, CA, USA). EEG and EOG were re-referenced offline to average mastoid derivations (M1 and M2). EEG was filtered from 0.3 to 35 Hz, EOG was filtered from 0.3 to 10 Hz, and EMG was filtered from 10 to 100 Hz. The sleep variables of interest obtained from the PSG recording sessions included the total sleep time (TST), time in minutes spent in Stage 1 (NREM1) sleep, Stage 2 (NREM2) sleep, slow wave sleep (SWS), and rapid eye movement (REM) sleep, sleep efficiency, and wake after sleep onset (WASO). TST was calculated as the total time spent asleep between “lights off” and “lights on.”
MRI Imaging Acquisition and Analysis
Recording Parameters
Functional magnetic resonance imaging (fMRI) data was collected on a Siemens Biograph mMR 3.0 Tesla MRI whole body scanner (Siemens, Erlangen, Germany) using a 12-channel head coil. Anatomical images were acquired using a standard 3D Multislice MPRAGE sequence (TR = 2300 ms, TE = 2.98 ms, TI = 900 ms, FA = 9°, 176 slices, FoV = 256 × 256 mm2, matrix size = 256 × 256 × 176, voxel size = 1 × 1 × 1 mm3). In addition, multislice T2-weighted functional MRI images were acquired during the ToH and CTL tasks (TR = 2.16 s; TE = 30 ms, FA = 90°, 40 transverse slice, 3-mm slice thickness, 10% inter-slice gap, FoV = 220 × 220 mm2, matrix size = 64 × 64 × 40, voxel size = 3.44 × 3.44 × 3 mm3).
Preprocessing
Functional volumes were preprocessed and analyzed using SPM12 (www.fil.ion.ucl.ac.uk/spm; The Wellcome Centre for Human Neuroimaging, London, UK) implemented in MATLAB R2018a for OS X (Apple, Cupertino, CA). Anatomical images were first roughly auto-oriented. Functional images for each participant were realigned to the first functional volume of the session and coregistered to the T1-weighted anatomical image. The coregistered anatomical images were then segmented into gray matter, white matter, and cerebrospinal fluid. Visual inspection of participant movement of both translations and rotations around x, y, and z was performed. Movement was within acceptable tolerances for all participants (i.e., did not exceed 6 mm). Next, an average subject-based template was created using DARTEL in SPM12 and used to normalize all anatomical and functional images. Lastly, spatial smoothing was applied on all functional images (Gaussian kernel, 8-mm full width at half-maximum; FWHM).
First-Level (within Subject) Fixed Effects Analysis
The canonical hemodynamic response function (HRF), and its temporal and dispersion basis functions were estimated at the individual level using the general linear model (GLM) in a block design (i.e., task vs. rest). Slow drifts were removed from the time series using a high-pass filter with a cut-off period of 128 s. Serial correlations in the fMRI signal were estimated using an autoregressive (order 1) plus white noise model and a restricted maximum likelihood algorithm.
In all first-level contrasts, increases in brain activations specifically associated with problem solving (ToH) minus the motor movements (CTL) required to execute the strategy were used in the analysis (i.e., ToH-CTL). Linear contrasts tested for the main effect of: 1) within the training session (ToH–CTL training) in order to assess which brain regions were initially recruited during learning, and 2) the difference between the training and retest sessions [(ToH–CTL retest)—(ToH–CTL training)]. Each of these first-level (within subject) contrasts comprised of the complete basis set (a set of 3 contrasts: one for the HRF, and the temporal and dispersion basis functions), and were passed onto second-level (between groups) analyses (see below), in order to examine the impact of the experimental condition of a retention interval of either Sleep, Nap, or Wake on memory consolidation of the memory trace.
Second-Level (between Groups) Random-Effects Analysis
The resulting within-subject contrast images of interest from the first-level analysis, comprised of the informed basis set (contrasts for the HRF, temporal, and dispersion basis functions) were entered into a second-level ANOVA to examine differences in activation between the: 1) Sleep versus Wake groups, 2) Sleep versus Nap groups, and, 3) Nap versus Wake groups. This approach is advantageous as not only is amplitude of the canonical HRF accounted for, but also the temporal derivative accounts for variations in the timing of the peak response, and the dispersion derivative accounts for variations in the width of the response (Henson and Penny 2005; Henson et al. 2001). In this way, we could examine the HRF response for each group comparison without the assumption that the temporal and dispersion functions were constant. In order to determine the direction of the effect, we examined the contrast estimates and 95% confidence intervals for the HRF only, for each significant cluster. All group-level hypotheses were tested at a threshold of P < 0.05, controlling for multiple comparisons using false discovery rate (FDR) whole-brain correction.
Brain–Behavior Relationships
Follow-up analyses assessed whether changes in behavioral performance were related to changes in brain activation in the post- versus preretention interval (i.e., retest–training). We employed univariate GLM to test whether the association between performance measures (i.e., offline gains in speed, accuracy) and changes in brain activation (from training to retest) in selected and significant regions of interest (i.e., hippocampus, caudate nucleus, supplementary motor area, and prefrontal cortex) differed as a function of condition (Sleep, Nap, Wake). Specifically, gains in performance (in separate models for accuracy and speed for each brain region of interest) were entered as the dependent variable, whereas condition (Sleep, Nap, Wake) was entered as the independent variable, with changes in brain activation (retest–training) as a covariate. The 2-way interaction term with the covariate (condition × activation) was used to determine if the relationship between gains and brain activation differed among the 3 conditions. To illustrate the significantly different relationships between performance gains and changes in brain activation between the conditions, the predicted gains scores were plotted against activation changes.
Results
Behavioral Data
First, in order to verify that all groups improved (i.e., learned) during the training session, a one-way repeated measures ANOVA revealed that there was a significant improvement in errors (F(7,413) = 20.80, P < 0.0001, η2 = 0.26), speed (F(7,413) = 61.52, P < 0.0001, η2 = 0.51), accuracy (F(7,413) = 12.65, P < 0.0001, η2 = 0.17), and SATO (F(7,413) = 123.33, P < 0.0001, η2 = 0.68) over the course of practice during this initial learning phase (Supplemental Figure S1).
Next, we investigated the impact of sleep on performance improvements from training to retest (Fig. 3). A one-way ANOVA revealed a statistically significant difference between the Sleep, Nap, and Wake groups in % improvement for speed (F(2,57) = 51.35, P < 0.0001, η2 = 0.64) and accuracy (F(2,57) = 3.48, P = 0.038, η2 = 0.11). There was no statistically significant effect for errors (F(2,57) = 2.42, P = 0.098, η2 = 0.08) or SATO (F(2,57) = 0.79, P = 0.459, η2 = 0.03). While SATO improved over the course of training, there was no significant group difference in gains scores. Thus, although a SATO occurs with practice, sleep does not preferentially enhance this trade-off, and therefore does not confound the interpretation of one or the other. Finally, it should be mentioned that there was no evidence of a ceiling or floor effect in terms of reaching the maximum number of moves, or consistently performing the optimal solution (Supplemental Table S1).
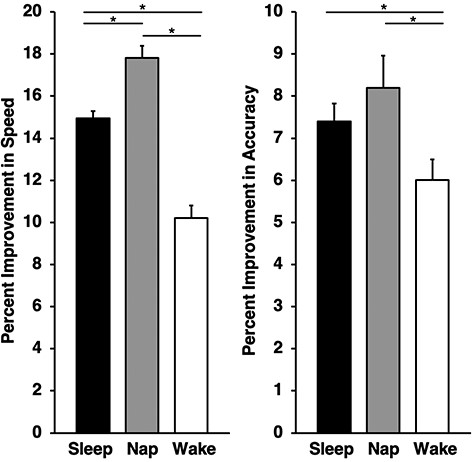
Offline gains in ToH performance (expressed as percent improvement in speed and accuracy) from training to retest for the Sleep, Nap, and Wake groups. Error bars represent one standard error of the mean.
Follow-up independent samples t-tests indicated that performance was significantly improved for Sleep versus Wake for speed (t(38) = 6.69, P < 0.0001, d = 2.12) and accuracy (t(38) = 2.08, P = 0.044, d = 0.66), and Nap versus Wake comparisons for speed (t(38) = 8.86, P < 0.0001, d = 2.80) and accuracy (t(38) = 2.36, P = 0.024, d = 0.75). Thus, either a full night of sleep or a nap afforded a benefit to task performance by increasing speed and accuracy from training to retest. It is worth noting that a nap afforded a greater benefit than a night of sleep for speed (t(38) = 4.11, P < 0.0001, d = 1.30).
Polysomnographic Data
Descriptive statistics for sleep architecture variables for the experimental session in the Sleep and Nap conditions are reported in Table 1.
Sleep architecture for experimental session. Means (M) and standard deviations (SD) for time are displayed in minutes
| Sleep condition | Nap condition | |||||
|---|---|---|---|---|---|---|
| M | SD | N | M | SD | N | |
| NREM1 | 17.23 | 15.28 | 20 | 5.63 | 4.52 | 20 |
| NREM2 | 227.10 | 34.73 | 20 | 36.92 | 12.76 | 20 |
| NREM3 | 74.90 | 22.51 | 20 | 21.09 | 15.45 | 19 |
| REM | 86.06 | 23.86 | 20 | 8.23 | 4.79 | 15 |
| Wake after sleep onset | 42.01 | 30.11 | 20 | 13.21 | 12.85 | 20 |
| Total sleep time | 405.29 | 42.58 | 20 | 68.79 | 13.62 | 20 |
| Sleep efficiency (%) | 87.59 | 7.70 | 20 | 77.97 | 14.56 | 20 |
MRI Data
Retest > Training Session
Sleep versus Wake
As hypothesized, there was a significant group (Sleep vs. Wake) by session (retest–training) interaction in the anterior right hippocampus and a corresponding nonstatistically significant (Z = 3.59, P < 0.001, uncorrected) difference in the contralateral hippocampus. More specifically, activation in the hippocampus was decreased in the Sleep group and increased in the Wake group. Further inspection of each participant’s beta values and their relationship to behavioral performance are described below. It is worth noting that there was a similar pattern observed in the bilateral posterior hippocampus (i.e., the parahippocampal gyrus), but only before whole-brain error correction (Z = 3.55, P < 0.001, uncorrected). In addition, increased activation was observed in the Sleep versus the Wake group in the right caudate (Fig. 4, Table 2).
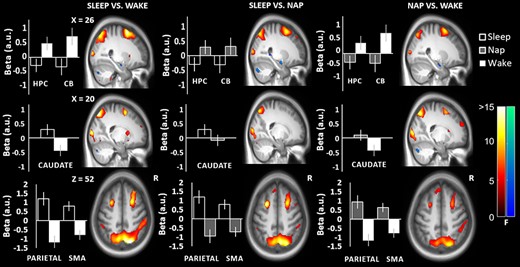
Significant brain activations in the sleep vs. wake, sleep vs. nap and nap vs. wake contrasts from training to retest. Changes in activation in the hippocampus and cerebellum (first row), the caudate (second row), and in the parietal and supplementary motor cortices (third row) are shown with corresponding contrast estimates (beta values in arbitrary units; a.u.) and 95% confidence intervals for the magnitude of the HRF. Warm colors reflect increases in activation and cool colors reflect decreases in activation. Abbreviations: hippocampus (HPC); cerebellum (CB); supplementary motor area (SMA).
Changes in activation from training to retest for, A: Sleep versus Wake, B: Sleep versus Nap, and C: Nap versus Wake comparisons
| L/R | Level | Region | X | Y | Z | Size | Z | P FDR |
|---|---|---|---|---|---|---|---|---|
| A: Sleep versus Wake | ||||||||
| Bilateral | Cerebral cortex | Superior and inferior parietal | 10 | −68 | 60 | 11 979 | >8.00 | <0.001 |
| Bilateral | Cerebral cortex | Middle temporal gyrus | 68 | −40 | 0 | 2218 | 6.27 | <0.001 |
| Bilateral | Cerebral cortex | Supplementary motor area | 24 | 8 | 58 | 1982 | 7.35 | <0.001 |
| Bilateral | Cerebral cortex | dlPFC | −48 | 36 | 28 | 498 | 5.91 | <0.001 |
| Bilateral | Cerebral cortex | mPFC | 2 | 20 | 46 | 289 | 4.64 | 0.012 |
| Bilateral | Cerebral cortex | Inferior parietal | −52 | −64 | −8 | 169 | 4.98 | 0.005 |
| Bilateral | Cerebral cortex | Insula | 32 | 24 | 2 | 446 | 5.99 | <0.001 |
| Right | Basal ganglia | Caudate | 20 | 16 | 10 | 446 | 4.76 | 0.009 |
| Bilateral | Limbic | Hippocampus | 24 | −8 | −18 | 90 | 4.65 | 0.012 |
| Left | Hindbrain | Cerebellum | −30 | −38 | −44 | 322 | 4.78 | 0.008 |
| Left | Hindbrain | Cerebellum | −6 | −72 | −52 | 41 | 4.65 | 0.012 |
| Bilateral | Hindbrain | Cerebellum | −40 | −68 | −52 | 116 | 4.58 | 0.015 |
| B: Sleep versus Nap | ||||||||
| Bilateral | Cerebral cortex | Superior and inferior parietal | −12 | −96 | 2 | 7605 | 7.77 | <0.001 |
| Bilateral | Cerebral cortex | Middle temporal gyrus | 66 | −40 | 0 | 4489 | 6.78 | <0.001 |
| Bilateral | Cerebral cortex | Supplementary motor area | 26 | 10 | 58 | 809 | 6.39 | <0.001 |
| Bilateral | Cerebral cortex | dlPFC | −10 | 50 | 42 | 388 | 4.72 | 0.017 |
| Bilateral | Limbic | Hippocampus | −30 | −12 | −18 | 127 | 4.84 | 0.011 |
| C: Nap versus Wake | ||||||||
| Bilateral | Cerebral cortex | Superior & inferior parietal | 8 | −68 | 60 | 10 116 | 7.70 | <0.001 |
| Bilateral | Cerebral cortex | Middle temporal gyrus | −58 | −32 | −2 | 10 116 | 6.52 | <0.001 |
| Bilateral | Cerebral cortex | Supplementary motor area | 24 | 10 | 56 | 4523 | 6.65 | <0.001 |
| Bilateral | Cerebral cortex | Orbitofrontal gyrus | −44 | 34 | −10 | 1252 | 4.26 | 0.049 |
| Bilateral | Limbic | Hippocampus | 26 | −6 | −18 | 220 | 4.99 | 0.005 |
| Right | Hindbrain | Cerebellum | 24 | −76 | −34 | 224 | 5.24 | 0.002 |
Note: Results shown for significant activations at P < 0.05, corrected for multiple comparisons using whole-brain FDR correction. Maximum coordinate shown for bilateral activations. Abbreviations: dorsolateral prefrontal cortex (dlPFC); medial prefrontal cortex (mPFC); Left/Right (L/R)
In addition to the hypothesized sleep-related changes in activation of the hippocampus and the caudate, there was a predictable group by session interaction in neocortical areas that support procedural skill learning, which were also recruited during training (Supplemental Table S2: training session). There was a widespread increase in activation in the Sleep condition bilaterally in the SMA, which extended to the premotor cortex and inferior medial PFC. A bilateral increase in activation in the dorsolateral prefrontal cortex (dlPFC) was also observed. Another set of widespread activations was observed in the parietal and temporal cortex. Specifically, there was an extensive bilateral activation encompassing much of the dorsal (“where”) visual stream in the Sleep versus Wake condition, which was maximal in the superior parietal cortex, but extended ventrally into the inferior parietal and superior occipital cortex. In addition, there was also increased activation in the Sleep condition throughout much of the ventral (“what”) visual stream, including the occipital cortex and posterior parietal cortex, which extended to the precuneus, left angular gyrus, right supramarginal gyrus, and bilaterally throughout the temporal lobes to the temporal pole (Supplemental Figure S2). Finally, there was increased bilateral activation of the central cerebellar area and a decrease in cerebellar areas crus 1 and crus 2.
Sleep versus Nap
Similar to the Sleep versus Wake group comparison, decreased activation from training to retest was observed for the Sleep versus Nap comparison bilaterally in the anterior hippocampus (Fig. 4, Table 2). By contrast, no significant differences in the striatum (e.g., caudate or putamen) were observed. A similar pattern of frontal cortical activation was observed in the Sleep versus Wake comparison and was also observed in the Sleep versus Nap comparison. Bilateral increases were observed in the SMA, premotor cortex, inferior medial PFC, and left dlPFC. Widespread activations were also observed in the Sleep versus Nap comparison in the occipital–temporal–parietal areas, again, in the same areas as the Sleep versus Wake comparison. Widespread cortical activations in the inferior left occipital cortex, bilateral calcarine fissures, and lingual gyrus were also observed. There was also decreased activation in areas crus 1 and crus 2 of the right cerebellum.
Nap versus Wake
Similar to the Sleep versus Wake comparison, bilateral decreased activation of the anterior hippocampus was also observed in the Nap versus Wake comparison (Fig. 4, Table 2). No enhancement of the striatum was observed, suggesting that a Nap may be sufficient to consolidate the trace in the hippocampus, but a night of sleep is required for observable changes to take place in the striatum. In terms of cortical areas, there was increased bilateral recruitment of the motor cortex, medial frontal and orbitofrontal area. Similar to the Sleep versus Wake group comparison, the same widespread bilateral parietal and temporal increases in activation encompassing the dorsal and ventral visual streams were observed for the Nap versus Wake comparison. Decreased activation was also observed in crus 1 and crus 2 of the cerebellum.
Brain–Behavior Relationships
Univariate GLM tested whether the association between performance measures (speed, accuracy) and changes in brain activation (from training to retest) in selected and significant regions of interest (e.g., hippocampus, caudate nucleus, supplementary motor area, and prefrontal cortex) differed depending on (Sleep, Nap, Wake) condition. We did not explore any relationships with errors or SATO as they did not differ significantly among the 3 conditions.
These analyses confirmed that the relationship between performance improvements in speed and changes in brain activation differed among the 3 experimental conditions in the hippocampus (Fig. 5A: F(3,56) = 3.72, P = 0.017), orbitofrontal cortex (Fig. 5B: F(3,56) = 3.92, P = 0.013), precuneus (Fig. 5C: F(3,56) = 17.43, P < 0.001), SMA (Fig. 5D: F(3,56) = 11.29, P < 0.001), prefrontal cortex (Fig. 5E: F(3,56) = 4.77, P = 0.005), and caudate nucleus (Fig. 5F: F(3,56) = 4.22, P = 0.009). There were no significant brain–behavior relationships for any brain regions for accuracy.
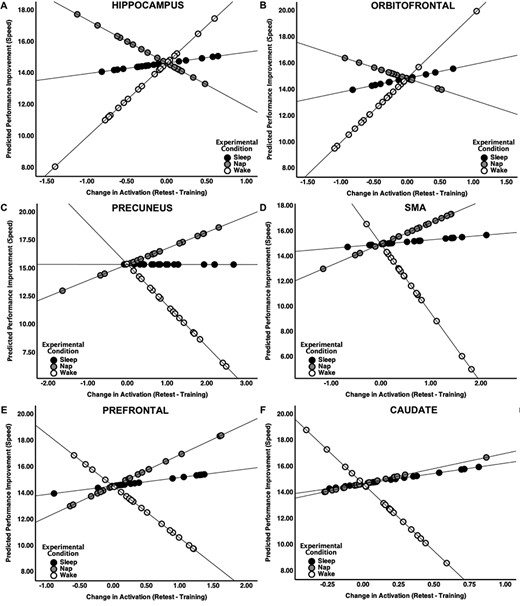
The relationship between the changes in performance (predicted values) and changes in brain activation from training to retest significantly differed across the three experimental conditions (Sleep, Nap, Wake).
More specifically, in the hippocampus, a positive association between change in activation and speed-related performance improvements was observed in the Nap condition. In the Wake condition, the inverse relationship was observed (Nap vs. Wake: t(36) = −2.94, P = 0.003), and an intermediate relationship was observed in the Sleep condition (Sleep vs. Wake: t(36) = −1.54, P = 0.066). The Sleep condition was similar to the Nap condition (Sleep vs. Nap: t(36) = 1.22, P = 0.116). A very similar pattern was observed in the functionally and anatomically interconnected orbitofrontal cortex. In addition, the reverse overall pattern across groups was observed for the precuneus, SMA, prefrontal cortex, and caudate nucleus. For these regions, the relationship between change in activation and performance improvements differed between Sleep and the Wake condition (all P-values <0.007), and the Nap and the Wake condition (all P-values <0.001), but there was no difference between the Nap and the Sleep Condition (all P-values >0.061).
Discussion
The present study investigated how sleep affects the behavioral and functional brain changes upon awakening, which support novel problem solving. We subtracted blood-oxygen-level-dependent (BOLD) activity that occurred during a motor execution control task from the BOLD activity that occurred during performance of the strategy-based ToH problem-solving task. Participants performed these two tasks in the fMRI before (i.e., “training” session) and after (i.e., “retest” session) a period of sleep, nap, or wakefulness. Consistent with our hypotheses, we showed that from training to retest: 1) offline gains in task performance (e.g., increased speed and accuracy) were greatest following sleep or a daytime nap, and, 2) the magnitude of the changes in brain activation for brain regions recruited during training depended on whether a night of sleep, a daytime nap, or a period of wakefulness occurred during the retention interval. Finally, 3) follow-up analyses of the brain–behavior relationships show that for a given brain area, a dissociable relationship between changes in brain activation and offline improvements in performance depend on whether a consolidation interval contains overnight sleep, a daytime nap, or a period of wakefulness. Specifically, increases in brain activation from the training to the retest session were observed in the motor cortex, prefrontal cortex, as well as a widespread cluster of regions encompassing the dorsal and ventral visual stream, in all three comparisons (Sleep vs. Wake, Sleep vs. Nap, and Nap vs. Wake). Greater changes in hippocampal activation were observed from training to retest in Sleep versus Wake, Sleep versus Nap, and Nap versus Wake comparisons. However, the caudate showed activation only in the Sleep versus Wake comparison. Overall, these results suggest that 1) either a nap or a full night of sleep benefits performance in terms of speed and accuracy, and 2) a full night of sleep is required for optimal neural enhancement (i.e., greater changes in the hippocampus, and for changes to occur in the caudate) for a newly acquired strategy necessary for problem-solving skills.
The striatum plays a key role in both motor learning and strategy learning; however, the subregions of the striatum (e.g., putamen and caudate) are specialized to support these distinct functions, respectively (Liljeholm and O’Doherty 2012). Specifically, the putamen is involved in reinforcement-based reward learning, conditioning and motor sequence learning (Pennartz et al. 2004; Lansink et al. 2009, 2016; Liljeholm and O’Doherty 2012), whereas the caudate supports higher order reasoning, novel learning (e.g., strategies) and problem-solving skills (Doyon et al. 1996; Dagher et al. 1999; Grafton et al. 2002; van den Heuvel et al. 2003; Monchi et al. 2006; Unterrainer and Owen 2006; Pezzulo et al. 2014). It is well established that the putamen is implicated in sleep-related consolidation of motor sequences (Debas et al. 2010; Barakat et al. 2013; Fogel et al. 2014, 2017; Boutin et al. 2018). However, much less is known about the role of sleep for the consolidation of problem-solving skills (which also involves motor sequence learning), and whether an analogous process occurs, specifically in the caudate. As predicted, sleep as compared to an equivalent period of wake showed increased activation in the caudate, but not in the putamen. A daytime nap was not sufficient to afford this benefit. Interestingly, and importantly, hippocampal activation was reduced in the Sleep versus Wake and the Nap versus Wake comparisons, suggesting that either a full night of sleep or a nap can facilitate the hippocampal-neocortical dialogue that is involved in memory consolidation. In addition, the significant difference in the Sleep versus Nap condition for the hippocampus (and other brain areas) suggests that there is an additional transformation of the memory trace over a night of sleep over-and-above a daytime nap. While the behavioral benefit of Sleep versus Wake also manifested after a daytime nap, sleep appears to continue to be involved in longer term transformation of the memory trace, which may afford benefits not investigated here (e.g., resistance to forgetting or interference, generalization, integration, schematization, etc.). However, this possibility remains to be investigated. Overall, these results suggest that a full night of sleep is required for optimal neural enhancement for a newly acquired strategy necessary for problem-solving skills. In addition, while a nap might be sufficient for faster processes, which involve the hippocampus, a slower consolidation process involving the caudate requires a whole night of sleep. This finding is consistent with accounts (e.g., Walker and Stickgold 2010) suggesting that dissociable aspects of memory consolidation (e.g., strengthening and integration) during sleep occurs sequentially in distinct sleep stages (SWS and REM sleep), and possibly within or across several nights (Lehéricy et al. 2005; Conte and Ficca 2013). While the specific role of different sleep stages remains to be investigated, our results suggest that these dissociable processes might involve dissociable brain areas (e.g., hippocampus and striatum).
Interestingly, while cortical and caudal activations increased after sleep (as compared to wake), recruitment of the hippocampus was decreased after sleep. This observation is consistent with the classical (albeit sometimes contentious) view that the hippocampus is a temporary waystation for newly acquired information before transferring it to the cortex for long-term storage (Dudai 1996; Squire and Zola-Morgan 1996; Dudai et al. 2015, but see Nadel and Moscovitch 2001; Rosenbaum et al. 2001; Schapiro et al. 2019 for alternate and complementary views). It is thus possible that the memory trace following wake was still labile in the hippocampus, whereas following sleep or a nap, consolidation was accelerated, as reflected by reduced hippocampal recruitment at retest.
In addition to sleep-related changes in the hippocampus and caudate, there was a strong bilateral activation that was maximal in the superior parietal cortex extending into the inferior parietal and superior occipital cortex. This extensive activation was greatest in the Sleep condition, and encompassed much of the dorsal (i.e., “where”) visual stream, which is involved in processing spatial information, the guidance of actions and recognizing where objects are in space. There was also a similarly widespread activation that was greatest in the Sleep condition throughout much of the ventral (“what”) visual stream, including the occipital and posterior parietal cortices, which extended bilaterally throughout the temporal lobes. These widespread activations are in line with PET and fMRI studies employing the ToH and similar tasks (Baker et al. 1996; Owen et al. 1996; Lazeron et al. 2000). This is not surprising given the nature of the task, which requires the movement of objects of different colors and sizes that can be demanding on visual associative areas (Corbetta et al. 1991) and requires these objects to be moved from one spatial location to another as determined by higher order processing and planning. In addition, changes in activation in the prefrontal cortex (Sleep vs.Wake) and orbitofrontal gyrus (Nap vs. Wake) were observed—brain regions typically involved in planning, problem-solving and goal-directed spatial memory. It is worth noting that the orbitofrontal cortex is implicated in error inhibition (Elliott and Deakin 2005; Stevens et al. 2009), receives projections from the caudate (Haber et al. 1995), and is functionally interconnected with the hippocampus, which performs complementary functions (Wikenheiser and Schoenbaum 2016). Areas including the SMA and prefrontal cortex (Aron et al. 2004; Lehéricy et al. 2005; Cieslik et al. 2015) are implicated in planning, error processing, and performance monitoring. The greatest changes in these areas were observed following a period of sleep.
Finally, we investigated the relationship between performance improvements and changes in brain activation across the 3 conditions. The greater the reduction of hippocampal and orbitofrontal activation, and related brain areas such as the medial prefrontal cortex, the better the performance improvements in the Nap condition. The inverse relationship was observed in the Wake condition, and an intermediate association was observed in the Sleep condition. By contrast, the reverse overall pattern across conditions was observed for the precuneus, SMA, prefrontal cortex, and caudate nucleus. Specifically, changes in brain activation from training to retest in these brain areas were positively associated with improved performance in both the Sleep and Nap conditions, whereas a negative association was observed in the Wake condition. Taken together, these results suggest that sleep-dependent changes in brain activation, which support the acquisition of novel cognitive strategies required for problem solving are associated with sleep-related changes in performance. The pattern of these relationships is consistent with the notion that the greater the decrease in recruitment in the hippocampus and related brain regions (e.g., orbitofrontal cortex), the greater the performance improvements. The opposite pattern was observed in motor cortical areas involved in planning (e.g., SMA), whereby greater increases in activation following sleep were related to improved performance.
Many of the relationships between performance enhancements and changes in brain activation were also apparent in the Nap condition, which may explain why robust changes in performance improvements are also observed after a daytime nap. However, it is important to note that the brain–behavior associations in the Wake condition are in all cases distinct from both the Sleep and the Nap condition (except for the hippocampus and orbitofrontal cortex, which were only statistical trends when comparing the difference in the association between changes in brain activation and performance improvements in Sleep versus Wake, directly).
In summary, both a daytime nap and a night of sleep can contribute to problem-solving relative to wake; however, a full night of sleep is optimal—and perhaps necessary—for the process to be fully realized in terms of both the neuronal and behavioral manifestations.
Implications and Future Directions
Several questions remain unresolved. It is not conclusive how much sleep is sufficient for optimal consolidation. There is evidence that even a brief nap (i.e., 20 min or less) can benefit memory when compared to a period of wake (Lahl et al. 2008). Fewer errors have been associated with higher order procedural memory consolidation following a night of sleep, but not following a nap (van Schalkwijk et al. 2019). Some studies report that a daytime nap can afford the same or similar benefit as a night of sleep (Doyon et al. 2009; Albouy et al. 2013c). However, conflicting evidence suggests that naps might merely stabilize procedural skills (Tucker et al. 2006; Sugawara et al. 2018; van Schalkwijk et al. 2019). Several factors might explain these inconsistencies. For example, inherent differences between nocturnal sleep and daytime naps (e.g., varying length, architecture, sleep quality, circadian influences, sleep pressure) preclude clear and direct comparisons. However, some comparisons can still be made, particularly in examining the characteristics of sleep architecture. For example, the presence or absence of REM sleep during a daytime nap appears to be a key predictor of post-napping problem solving (Tucker et al. 2006) or perceptual learning (McDevitt et al. 2015). Moreover, the degree of improvement is proportional to the amount of REM sleep (McDevitt et al. 2015), providing some evidence for a dose–response relationship. Similarly, other findings suggest that “a nap is as good as a night” for visual texture discrimination memory, but only if the nap contains REM sleep (Mednick et al. 2003). The presence or relative absence of REM sleep during a nap might explain differences in memory consolidation as compared to a full night of sleep.
Finally, it is also not known which neural/electrophysiological mechanisms might support this process. Simultaneous EEG-fMRI sleep studies can further clarify how sleep-related neural oscillations might influence the neuroanatomical changes that occur during sleep. Reactivation studies have shown that the brain regions, which are active during learning, are also reactivated during post-learning sleep (Maquet et al. 2000; Fogel et al. 2017; Boutin et al. 2018). Specifically, following sequence learning, activation of the putamen time-locked to spindles was associated with improved performance (Fogel et al. 2017). It is possible that an analogous process occurs for strategy and problem-solving skills. Simultaneous EEG-fMRI studies can provide a more complete understanding of how sleep supports the realization of complex strategies needed for problem solving.
Conclusion
A night of sleep affords a benefit to the consolidation of the striatal (e.g., caudate), hippocampal, prefrontal, and motor cortical and related aspects (e.g., SMA, cerebellum) of problem-solving skills. However, if only a daytime nap occurs during the retention interval, these sleep-dependent changes in brain activation are apparent in some areas (e.g., hippocampus and the SMA), but not in the striatum. Thus, to get the full benefit of sleep, a full night of sleep is required. Distinct contributions of the hippocampus and putamen have been observed for learning and sleep-related consolidation of motor sequences (Albouy et al. 2008; Albouy et al. 2013c). Here, our results suggest that an analogous process may take place for sequences of movements that also involve problem-solving skills, but in brain regions specialized for this task, including the caudate, rather than the putamen. This strengthening of activation in the caudate required a full night of sleep. Moreover, the early and short-lived involvement of the hippocampus observed here is consistent with the notion that the hippocampus is important for early stages of the consolidation process but is less involved after a period of sleep. Thus, sleep facilitates the realization of a novel cognitive strategy, perhaps through two distinct processes: a rapid consolidation-based hippocampal-neocortical transfer of information, and a slower consolidation process in the striatum. Sleep may be an opportune time to actively facilitate the transfer of information to other brain areas for more permanent storage.
The processes by which we gain insight and inspiration into the solution to a problem is not well understood, nor is the putative contribution of sleep, or the underlying neuronal processes. Sleep appears to have a privileged role in facilitating novel cognitive strategy learning. This study suggests that sleep facilitates and enhances the transformation of the neuronal activity that supports ingenuity, and ultimately, novel discoveries.
Funding
The Natural Sciences and Engineering Research Council (NSERC) Discovery grant (RGPIN/2017–04328 to S.F.); Ministry of Research and Innovation Early Researcher Award (ERA; ER17–13-023 to S.F.).
Notes
The authors would like to thank Katie Dinelle, Rahim Ismaili, Reggie Taylor, and the Royal Ottawa Hospital’s Brain Imaging Centre for their support with Magnetic Resonance Imaging. Conflict of Interest: All authors declare no conflict of interest.