


Abstract
The brain is continuously bombarded by external stimuli, which are processed in different input systems. The intrinsic features of these sensory input systems remain yet unclear. Investigating topography and dynamics of input systems is the goal of our study in order to better understand the intrinsic features that shape their neural processing. Using a functional magnetic resonance imaging dataset, we measured neural topography and dynamics of the input systems during rest and task states. Neural dynamics were probed by scale-free activity, measured with the power-law exponent (PLE), as well as by order/disorder as measured with sample entropy (SampEn). Our main findings during both rest and task states are: 1) differences in neural dynamics (PLE, SampEn) between regions within each of the three sensory input systems 2) differences in topography and dynamics among the three input systems; 3) PLE and SampEn correlate and, as demonstrated in simulation, show non-linear relationship in the critical range of PLE; 4) scale-free activity during rest mediates the transition of SampEn from rest to task as probed in a mediation model. We conclude that the sensory input systems are characterized by their intrinsic topographic and dynamic organization which, through scale-free activity, modulates their input processing.
Introduction
The human cortex is characterized by a hierarchy along the lines of unimodal and transmodal regions in the resting state (Margulies et al. 2016; Golesorkhi et al. 2020, 2021; Ito et al. 2020; Raut et al. 2020). Recent studies demonstrate that uni- and transmodal regions exhibit different neural dynamics. Transmodal regions show long intrinsic neural timescales while the unimodal regions exhibit shorter timescales (Margulies et al. 2016; Huntenburg et al. 2018; Ito et al. 2020; Raut et al. 2020; Golesorkhi et al. 2021). However, there is no strict distinction of uni- and transmodal regions within the cortex itself. For instance, various sensory input streams like auditory, visual, and somatosensory systems include unimodal regions like V1 and primary auditory cortex while, at the same time, progressing towards transmodal regions like dorsolateral prefrontal cortex (Taylor et al. 2015; Wengler et al. 2020). Given that the sensory input systems cut across the uni-transmodal distinction, one may raise the question for their intrinsic organization, that is, topography. Do these sensory input systems exhibit an intrinsic topography that differentiates their respective regions as well as the different input systems among each other? Addressing these questions is the goal of our study. This will help us to better understand how the different sensory systems encode their inputs and how that shapes our perception (Golesorkhi et al. 2021).
Sensory input systems are heterogenous within themselves. The prototypical example is the visual cortex that exhibits well-differentiated processing in a staggered manner from V1 over V2, V3, V4 and V5/MT to even higher cortical regions like dorsolateral prefrontal cortex (DLPFC) (Hyvärinen and Poranen 1978; Galaburda and Pandya 1983; Felleman and Van Essen 1991; Morel et al. 1993; Kaas and Hackett 2000; Chaudhuri et al. 2015; Vázquez-Rodríguez et al. 2019; Wengler et al. 2020). Two recent studies (Taylor et al. 2015; Wengler et al. 2020) suggest staggered pattern within auditory, visual, and somatosensory input systems in terms of their functional connectivity (Taylor et al. 2015) and intrinsic neural timescales (INT) (Wengler et al. 2020) during resting state. This leaves open the intrinsic nature of these patterns in the sensory systems, in which case they should be present during both rest and different task states (see also Cole et al. 2016; Ito et al. 2017).
Sensory systems need to be responsive to external inputs. The neural mechanisms of this responsivity remain yet unclear, though. It is established that the brain operates in a zone of self-organized criticality (Jensen and Marcelo 1999; Beggs and Plenz 2003; Chialvo et al. 2008), where it is maximally responsive to perturbations from outside, that is, external stimuli or inputs (Tononi et al. 1994; Shanahan 2012; Deco and Jirsa 2012; Tagliazucchi et al. 2012). Scale-free activity is a key feature of neural dynamics that reflects the brain’s degree of criticality, which can be measured by the power law exponent (PLE) (Linkenkaer-Hansen et al. 2001; Chialvo 2010; He et al. 2010, 2014; Shew and Plenz 2012; Ponce-Alvarez et al. 2018; Korchinski et al. 2021; Pang et al. 2021). PLE is computed as the slope of the log–log transformation of the power spectrum across different frequency ranges (He 2011; Tagliazucchi et al. 2013) like the infraslow frequency range of fMRI (He 2011; Huang et al. 2017; Scalabrini et al. 2017, 2019; Zhang et al. 2018; Tetereva et al. 2020, see also Linkenkaer-Hansen et al. 2001). Experiments by Chaudhuri et al. (2018) show that scale-free nature of neural signal reflects the criticality in recurrent networks. Criticality and correspondent power-law structure was also shown by Expert et al. (2011) in resting state fMRI data. Given that PLE is an indirect index of criticality, one would expect it to modulate input processing in the sensory systems’ regions across different stimuli and tasks (Huang et al. 2017; Avramiea et al. 2020; Kim and Lee 2020).
Yet another measure of brain’s neural dynamics is Sample entropy (SampEn) that, operating in the time domain, measures the regularity and predictability of the signal across time which, like PLE, is well established (Richman and Moorman 2000; Keshmiri 2020; Cieri et al. 2021) and reproducible (Omidvarnia et al. 2021) in fMRI. Generally, entropic measures refer to the degree of the irregularity or unpredictability of signal (Lungarella and Sporns 2006; Quiroga et al. 2009; Sengupta et al. 2013; Carhart-Harris et al. 2014; Carhart-Harris 2018). Conceived in this way, SampEn may serve as proxy for the irregularity/regularity of input and ultimately information processing along the different regions within the sensory systems which also correlates with cognition (Omidvarnia et al. 2021). SampEn may thus index the degree of the signal’s regularity/irregularity during inputs processed in the sensory systems in task states. One would consequently expect that SampEn reflecting input processing is dependent upon the sensory regions’ degree of criticality, that is, PLE, as that indexes their responsiveness to external inputs (Huang et al. 2017; Avramiea et al. 2020; Kim and Lee 2020).
To investigate the neural topography and dynamics of sensory input systems, we used publicly available fMRI dataset UCLA Consortium of Neuropsychiatric Phenomics (Poldrack et al. 2016; Gorgolewski et al. 2017), which includes resting state and six different task data of 130 healthy control subjects (and different number of subjects of different psychopathologies, which we did not investigate in this study). To characterize different regions of visual, somatosensory, and auditory input systems, we relied on Wengler et al. (2020), who used genetic maps, T1/T2w images, and intrinsic neural timescales to identify and distinguish different regions within these three input systems (see also Taylor et al. 2015 who used functional connectivity distance). We here extend their approaches beyond the resting state by including different task states, as well as by focusing on neural dynamics, that is, how its regularity (SampEn) is modulated by neural criticality (PLE). This served the purpose of probing the intrinsic topography and dynamics of the three sensory input systems.
We demonstrate distinct neural topography and dynamics (PLE and SampEn) of the different regions within each of the three sensory input systems: visual, auditory and somatosensory. Moreover, we show that the three sensory input systems differ from each other in their neural topography and dynamics. As a third step, we probe the relationship between PLE and SampEn using correlation and simulation showing that different PLE regimes modulate SampEn differently which is well in line with the notion of criticality (PLE) mediating input responsiveness (SampEn). Finally, we demonstrate that the degree of scale-free activity, as indexed by resting state PLE in the sensory input systems’ regions, takes on a regulatory role for their input and information processing, that is, predictability or irregularity as measured with SampEn, by modulating the latter’s transition from rest to task states. Together, we demonstrate that different sensory input systems exhibit an intrinsic topographic organization and neural dynamics which, during the transition from rest to task states, is modulated or regulated by their degree of scale-freeness. This carries important implications for how these systems encode their input and how that, in turn, shapes our perception.
Materials and methods
Data acquisition
fMRI data (slice thickness = 4 mm, 34 slices, TR = 2 s, TE = 30 ms, flip angle = 90°, matrix 64 × 64, FOV = 192 mm, oblique slice orientation) were downloaded from open-access UCLA Consortium for Neuropsychiatric Phenomics LA5c study (Poldrack et al. 2016; Gorgolewski et al. 2017). Only raw data of healthy controls (n = 130) were selected for analysis. Details about socio-demographic characteristics of the sample, detailed MRI device information, anatomical scan parameters and information on resting state and 6 tasks can be found on (Poldrack et al. 2016; Gorgolewski et al. 2017). Briefly, these tasks consist of an eyes open resting state (REST); balloon analog risk task (BART), in which subjects were asked for pumping experimental balloons which either resulted in an explosion or points and control balloons which neither exploded nor rewarded; paired associate memory encoding (PAMENC) and retrieval (PAMRET), in which subjects were asked for memorization and rate their confidence in recalling the memorized color; spatial working memory task (SCAP) in which subjects tried to remember places of pseudo-randomly positioned circles; stop signal task (STOPSIGNAL), in which subjects tried to not respond to the visual cue when they hear an auditory signal; and task-switching task (TASKSWITCH), in which participants were asked for responses to either shapes or colors of the stimuli. In the paper, we presented STOPSIGNAL and TASKSWITCH in figures due to space constraints, but the reader can find all the results in tables. For the analysis, breath-holding task was excluded because of its different and short duration (83 sampling points), which does not allow a fair comparison of the measures (PLE and SampEn) with those obtained in the rest of the tasks (150 sampling points).
Preprocessing and ROI selection
Five minutes (150 consecutive time points, TR = 2 s) from resting state (REST), balloon analog risk task (BART), periodic associate memory encoding/retrieval (PAMENC/PAMRET), spatial working memory task (SCAP), stop signal task (STOPSIGNAL) and task-switching task (TASKSWITCH) were selected for analysis. Preprocessing steps were implemented in Analysis of Functional Neuroimages software (AFNI; Cox 1996). The procedure is following: 1) discarding first two frames of each fMRI run; 2) slice-timing correction; 3) despiking; 4) spatial alignment of fMRI data to time frame with minimum calculated motion; 5) spatial alignment of fMRI data to skullstripped anatomical data that was aligned to MNI152 stereotactic space; 6) resampling to 3 × 3 × 3 mm isometric voxels; 7) scaling each voxel time series to have a mean of 100 to reflect percent signal change; 8) temporal band-pass filtering (0.01 Hz < f < 0.2 Hz) to reduce low-frequency drift and high-frequency respiratory/cardiac noise, while at the same time undesired components were removed through regression of linear and nonlinear drift, head motion and its temporal derivatives, binarized FD time series, and mean time series from the white matter (WM) and cerebrospinal fluid (CSF) to control for non-neural noise. The WM and CSF masks were eroded by one voxel to minimize partial voluming with gray matter (Jo et al. 2010). Global signal regression was not performed to avoid introducing non-existent correlations and losing correlations due to global signal, which is shown to have physiological relevance (Gotts et al. 2013; Zhang et al. 2019, 2020; Scalabrini et al. 2020; Damiani et al. 2021).
After preprocessing, the quality control files generated by afni_proc.py were thoroughly inspected and those specific tasks from the subjects with excessive motion and artifacts were discarded. Furthermore, those tasks with more than 10% of the time points with motion above 3 mm were also discarded. This left us with the following number of subjects for each task: 108 for REST and SCAP, 107 for BART, STOPSIGNAL and TASKSWITCH, 75 for PAMENC and PAMRET.
Then, we averaged time series from the following regions of interest (ROIs) defined by HCP-multimodal parcellation atlas (Glasser et al. 2016): for visual system: v1, v2, v3, mt, v4, v6, v7, 8a, 46; for sensory system: 3b, 3a, 1, 2, 5m, 7b, 7a, 8a, 46; for auditory system: a1, lbelt, mbelt, pbelt, ri, a4, a5, 8a, 46. These three sensory systems including their regions are based on Wengler et al. (2020). They determined these orderings by selecting the ordering that was best predicted by T1w/T2w and cortical thickness values from 4 candidate orderings that were based on previous anatomical studies (Hyvärinen and Poranen 1978; Galaburda and Pandya 1983; Felleman and Van Essen 1991; Morel et al. 1993) for each system. They also included and determined two additional prefrontal cortex regions known to be downstream projections of the auditory, visual, and somatosensory cortices: area 8a and area 46 (Felleman and Van Essen 1991; Kaas and Hackett 2000).
Calculation of power-law exponent and sample entropy
Power-law exponent (PLE) of time series was calculated using Dynameas toolbox (https://github.com/SorenWT/dynameas) based on MATLAB software (version R2019). Briefly, power spectral density (PSD) of frequencies in the range of 0.01–0.2 Hz were estimated using Welch’s method (Welch 1967). PLE is defined as the slope of the regression line that fits the power versus frequency representation, both in logarithmic scale (He 2011; Tagliazucchi et al. 2013). To test for the validity of this fitting, we performed three control analyses:
To test the goodness of fit for scale invariance, we adapted a goodness of fit test for testing power-law distributions (Clauset et al. 2009) that was used in various fMRI studies (He 2011; Tagliazucchi et al. 2013; Scalabrini et al. 2017). For each ROI in REST, 1000 time series of fractional Gaussian noise (fGn) with the same length and standard deviation of the averaged time series of subjects (Stoev 2021) were generated. fGn is a model of stationary scale-free dynamics (Beran 1994). PLE values for each synthetic fGN time series were calculated. Kolmogorov–Smirnov statistic was used to measure the distance, D, between its log power-log frequency plot and its own best-fit linear-regression line. The P-value is defined as the fraction of synthetic time series with Ds that are larger than the original D of the fMRI time series (Clauset et al. 2009). The larger the P-value, the more plausible the fGn model is for representing the original fMRI time series, and the better the fit of the original data to a scale-free distribution. The hypothesis that the fMRI signal is scale-free was ruled out if P < 0.05. Results can be found in Supplementary Results 2.
For a confirmatory analysis, we calculated Hurst exponent, with detrended fluctuation analysis (H-DFA) as a control measure and calculated its correlation with PLE (Linkenkaer-Hansen et al. 2001; He 2011). H-DFA is defined as the slope of the least-squares line between log(time points) and logarithm of the root-mean square fluctuation of detrended and integrated time series, log(F(n)) (Peng et al. 1995). As a measure in the time domain, H-DFA complements the spectral measure PLE and describes the scale-invariant properties of a self-similar signal. We correlated the H-DFA values with PLE values (Supplementary Results 2—Table 1).
Lastly, we did the same analyses using median frequency (MF, described below), which is another measure in spectral domain, instead of PLE. The use of MF is further justified with the very high correlation found between PLE and MF (Supplementary Results 1—Tables 4 and 5). In this paper, we only report the results from PLE and SampEn in tables and figures, but the results for MF can be found in Supplementary Results 2.
To further confirm PLE, an additional measure of the frequency domain was included by measuring median frequency (MF). MF describes the frequency that divides the power spectrum in two parts of equal area (Schwilden et al. 1985; Schwender et al. 1996; McDonald et al. 1999; Bachiller et al. 2015; Verrusio et al. 2015; Huang et al. 2018; see also Golesorkhi et al. 2020 for measuring MF in fMRI). MF was calculated with the PSD previously estimated using built-in MATLAB function medfreq. It is defined as the frequency which divides the area under the PSD curve into two halves (Schwilden et al. 1985; Schwender et al. 1996; McDonald et al. 1999; Bachiller et al. 2015; Verrusio et al. 2015; Huang et al. 2018).
SampEn was introduced by Richman and Moorman (2000) as a variant of approximate entropy with two important advantages over it: independence with the length of the data and reduction of the bias caused by self-matching (Richman and Moorman 2000; Cieri et al. 2021). This entropic measure can be used for quantifying the irregularity and unpredictability of short and noisy time series. It can be seen as counting repeated patterns, more repetitions meaning more ordered structures with less entropy (higher predictability). To calculate SampEn in a given time series, SampEn procedure need to first divide it into consecutive segments of length m (pattern length). Then, the algorithm assesses whether the maximum absolute Chebyshev distance between the corresponding components of each pair of vectors is less than or equal to a tolerance r (similarity criterion), considering similar patterns when it is met. The same process is repeated for segments of length m + 1. The conditional probability that the segments of length m maintain similarity when increasing said segments by one sample, m + 1, is then calculated. Finally, SampEn value is estimated as the negative natural logarithm of such conditional probability (Richman and Moorman 2000; Keshmiri 2020). Importantly, the higher SampEn values, the lower the self-similarity in the times series and, consequently, more unpredictability and irregularity. For this paper, we set m as 2 and r as 0.5, following previous studies (McDonough and Nashiro 2014; Omidvarnia et al. 2021).
Despite the validation analyses by Omidvarnia et al. (2021), the usage of SampEn in fMRI data can be criticized due to the thermal noise component in the fMRI signal (Liu 2016). To further establish the validity of SampEn in fMRI, we performed two analyses.
First, we randomly scrambled the BOLD time series of every subject in our 23 regions. This surrogate data enabled us to confront the question of randomness due to noise. We compared SampEn values in these surrogate data with our original SampEn values using a t-test. In every task and ROI, original SampEn values were much lower than the surrogate values. Results can be found in Table 1 of Supplementary Results 3.
We calculated the effect size (eta-squared) of our ANOVAs of SampEn values between nine regions in each system and between three systems using measures of effect size toolbox (https://github.com/hhentschke/measures-of-effect-size-toolbox). All the analyses yielded moderate to strong effects (Supplementary Results 3—Tables 2 and 3).
Simulation for the relationship between power-law exponent and sample entropy
To assess the mathematical relationship between PLE and SampEn, we generated 1000 instances of colored noise obeying power law of |$P=1\!\Big/ \!{f}^{\beta}\Big.$| where f is frequency, β is the slope of the power spectrum and P is the power of that respective frequency using built-in Matlab function dsp.ColoredNoise from β = −2 to 2 with equal spacing. Dsp.ColoredNoise uses the algorithm by Kasdin (1995) that filters white noise with for β > 0 PLE of each simulation is calculated the same way as the real data, between 0.01 and 0.2 Hz. We calculated PLE and SampEn in simulations to see the effect of PLE on SampEn in an extended range. For confirmation, we also calculated MF (Supplementary Results 2—Fig. 1).
Mediation model
To analyze the relationships between these measures, a mediation model (Hayes 2009) was performed with the CANLAB mediation toolbox for MATLAB (Wager et al. 2008, 2009). First, we used PLE at rest as mediator, SampEn at task as dependent variable and SampEn at rest as independent variable. Significance of direct and indirect effects and 95% confidence intervals were computed using 10 000 bootstrap samples. Variance explained (VarExp) is defined as indirect effect (ab) divided by total effect (c) (78). Then, we built the same model with SampEn at rest as mediator, PLE at rest as independent variable and PLE at task as dependent variable. We repeated same analyses using MF instead of PLE (see Supplementary Material).
Statistics
All statistical analyses were done in MATLAB using the Statistics and Machine Learning Toolbox. Normality and homoscedasticity were assessed with Kolmogorov–Smirnov and Bartlett’s tests, respectively. Differences within and between input systems were tested using one-way ANOVA. Pearson test was used for the relationship between measures. Differences between r-values coming from correlations were compared with Fisher’s r-to-z transformation (Sheskin 2004). All P-values were corrected for multiple comparisons using Bonferroni method. Asterisks in the tables indicate level of significance (*: P < 0.05, **: P < 0.01, ***: P < 0.001).
Results
In the main paper, we only report REST, STOPSIGNAL and TASKSWITCH results in the figures due to size limitations unless stated otherwise. The reader can find the results of all the tasks in the Supplementary Results 1 and all the analyses for MF in Supplementary Results 2.
Different neural dynamics between the regions within each of the three input systems
To understand the input systems themselves in a more detailed way, we searched for the differences between regions within each of the three input systems respectively. For this, we used one-way ANOVA of nine levels over regions for PLE and SampEn (and MF) and applied this to each of the input systems and every state (rest, tasks). We obtained significant differences for each of the input systems with respect to the two measures (PLE and SampEn) and all states (rest, tasks) (see Fig. 1, Supplementary Results 1—Table 1 for other tasks, and Supplementary Results 2—Table 2 for MF). The auditory input system, relative to the other two input systems, showed the highest F-values for the differentiation among its regions (For REST PLE [F(8,963) = 24.510, P < 0.001], for REST SampEn [F(8,963) = 10.975, P < 0.001]). Of note, STOPSIGNAL was the task that differed most between regions for both PLE [F(8,963) = 27.106; 16.104; 11.406 for auditory, somatosensory and visual respectively, all three P-values < 0.001] and SampEn [10.441, 14.240, 5.875 for auditory, somatosensory and visual, all P-values < 0.001]. Together, these findings suggest that different regions within the input systems themselves statistically differ from each other in their scale-free dynamics (PLE) and signal regularity/irregularity (SampEn), which holds in both rest and task.
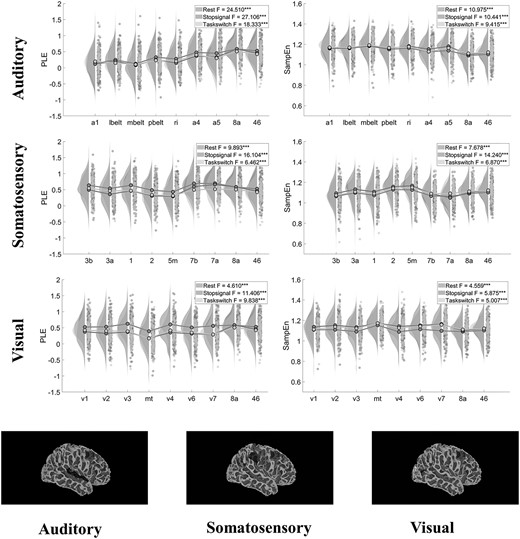
Differentiation in the neural dynamics of the input systems. Top: Raincloud plots and results of one-way ANOVA between regions’ PLE and SampEn values in auditory, somatosensory and visual systems, respectively, showing clear differentiation between regions in all three systems. Bottom: The regions in each system shown on a cortical surface.
Different neural dynamics between the three input systems
To understand the input systems in a more detailed way, we wanted to see if the three input systems differ in their neural dynamics and signal regularity/irregularity, that is, in terms of PLE and SampEn during rest and task states.
For this, we did one-way ANOVA of three levels over systems for PLE and SampEn comparing the three systems with each other for each measure and state (rest, tasks) (Fig. 2, Supplementary Results 1—Table 2 for ANOVAs and 3 for post-hoc comparisons as well as Supplementary Results 2—Tables 3 and 4 for MF results). ANOVA’s indicated significant differences between the three input systems for all measures and states (except PLE in STOPSIGNAL and SampEn in PAMRET). For PLE, the highest F value was at REST, [F(2,24) = 9.968, P < 0.001], while for SampEn, PAMENC showed highest F [F(2,24) = 9.740, P < 0.001], closely followed by REST [F(2,24) = 9.450, P < 0.001]. At post-hoc comparisons, auditory system differed from the other two in almost all states, showing lower PLE, higher MF and higher SampEn than both visual and somatosensory input systems. Together, these results show that the three input systems differ from each other in their neural dynamics and signal regularity/irregularity. The fact that this pattern is present in both rest and task indicates that it reflects an intrinsic neural dynamics and topographical organization of the input systems themselves irrespective of their state (rest or task).
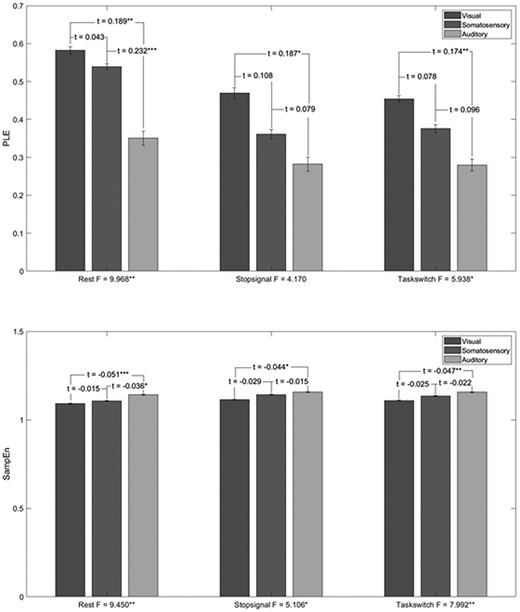
Differences in the neural dynamics between the input systems. Bar plot showing the results of one-way ANOVA between the three systems’ PLE and SampEn values and their post-hoc comparisons. The results indicate clear difference between three systems with the auditory system showing highest SampEn and lowest PLE whereas the visual system has highest PLE and lowest SampEn.
Relationship between PLE and SampEn
To further analyze the relationship between PLE and SampEn, we used both empirical and simulated data. First, PLE and SampEn measures were correlated in innermost (region 46) and outermost (regions a1, v1 and 3b) regions (Fig. 3 top panel, Supplementary Results 1—Tables 4 and 5). The rationale for choosing the extremes and not all the regions together is to avoid the hierarchical trends between regions that could affect the correlations. We found that there is a significant negative correlation between PLE and SampEn in all the regions regardless of rest or task states. These findings were reinforced by additional analyses investigating correlation between median frequency (MF) with both PLE and SampEn (MF-PLE and MF-SampEn) (see Supplementary Results 1—Tables 4 and 5).
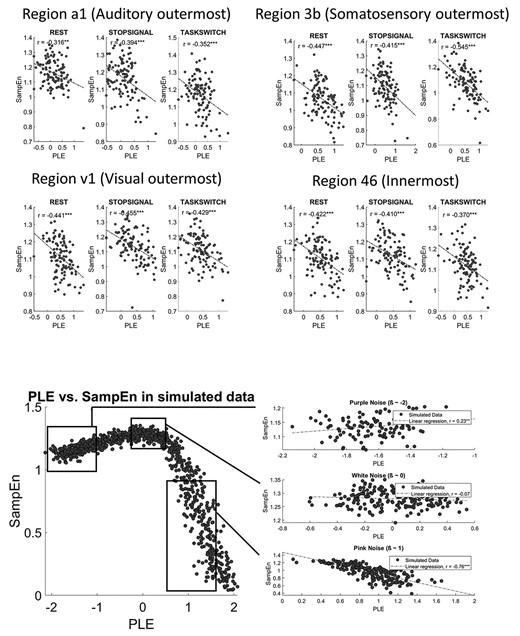
Relationship between PLE and SampEn. Top 4 panels show correlation of PLE and SampEn in empirical data, in the outermost regions (a1, 3b, v1) and innermost region (region 46). This selection is made to ensure that the trends in regions of a system won’t affect correlations. Bottom left panel shows the scatterplot with the simulated data of the synthetic signals generated with a model of noise with different slopes (−2 to 2). 1000 pink noise signals were generated and the PLE and SampEn were computed as in empirical data. Bottom right upper panel shows.
After analyzing the empirical data, we were interested in extending our findings to a wider range of PLE values in order to verify that the linear trend observed in the local region of the empirical data is maintained or not. For that purpose, we synthetically generated 1000 colored noise signals with different slopes between β = −2 to 2 (i.e. PLE values between −2 and 2, respectively), corresponding to different types of colored noises (see bottom panel in Fig. 3). In this way, it is possible to observe the relationship between PLE and SampEn in a wider range of PLE values that reflect different kinds of noise (pink, purple, white).
We observed two different behaviors in two scale-free structures. On the one hand, when the signal is close to purple noise (PLE ~ −2) with more power in the higher frequencies, SampEn and PLE show positive significant correlation (r = 0.23). On the contrary, around a pink noise frequency structure (PLE ~ 1) with more power in the lower frequencies, PLE and SampEn show a clear negative significant relationship (r = −0.76). Interestingly, there is a transition region in which the relationship between both variables are nearly flat (r = −0.07) and nonsignificant. This region corresponds with a signal structure similar to white noise (PLE ~ 0), that is, when the scale-free structure of the power spectrum is absent. That is in line with the ideas about criticality in the brain (Tononi et al. 1994; Jensen and Magnasco 1999; Beggs and Plenz 2003; Chialvo et al. 2008; Chialvo 2010; Deco and Jirsa 2012; Shanahan 2012; Tagliazucchi et al. 2012; Korchinski et al. 2021), as we discuss later.
This simulation analysis confirms that the relationship between PLE and SampEn is not due to measurement methods, but reflects an intrinsic dynamic relationship of the brain’s neural activity. In particular, as the Figure 3 shows, locally (that is, within a limited range of PLE values) the relationship between PLE and SampEn can be considered linear. However, in an extended range as probed in the simulation, this linearity is lost as the local linearity is embedded within a more global non-linearity. The empirical data of the neural signal appear to be restricted to the region with pink noise, that is, positive PLE where the scale-free structure is maximum as indexed by the strong negative correlation of PLE with SampEn in both simulated and empirical data.
Mediation model between PLE and SampEn for the transition from rest to task states
Together, our ANOVA, correlation and simulation findings suggest differential, but related roles of PLE and SampEn during input processing. Probing their relationship further, we employed a mediation model to the empirical data. Given previous findings of PLE determining the critical threshold, that is, the point where the potential for change is at maximum, (Linkenkaer-Hansen et al. 2001; Shew and Plenz 2012; Ponce-Alvarez et al. 2018; Pang et al. 2021), we hypothesized that PLE at rest would mediate the relationship of SampEn from rest to task.
First, we used PLE at rest as mediator, SampEn at rest as independent variable and SampEn at task as dependent variable. After that, we used SampEn at rest as mediator, PLE at rest as independent variable and PLE at task as dependent variable. We did the same analyses with MF instead of PLE as control analyses. While all the analyses were statistically significant showing partial mediation, when we used SampEn as mediator, the VarExp values reduced. Details of all the results can be found in Supplementary Results 1—Tables 6 and 7 for PLE mediating SampEn and SampEn mediating PLE, Supplementary Results 2—Tables 5 and 6 for MF mediating SampEn and SampEn mediating MF respectively, as well as in Figure 4 (we could only report auditory system values for due to size limitations). These results suggest that temporal dynamics (PLE) mediate signal regularity/irregularity of information processing (SampEn).
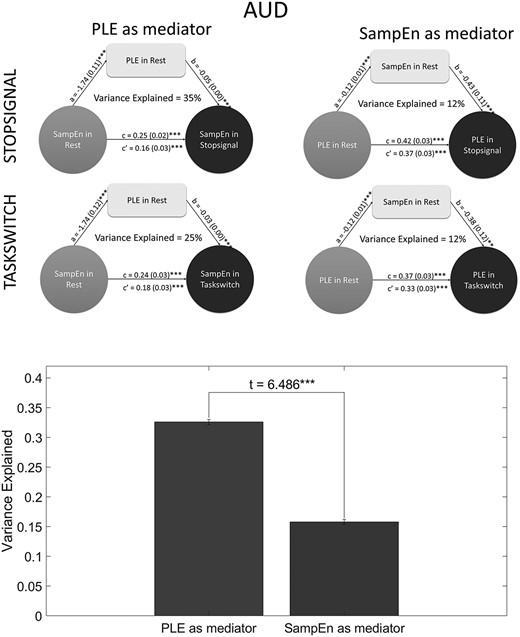
Mediation models and their comparison. On top left, PLE at rest mediating SampEn change from rest to task, on top right, SampEn at rest mediating PLE change from rest to task. Both figures are in the auditory system. Bottom: Comparison between the two measures in the role of mediators. T-test between VarExp values show that VarExp significantly decreases when we use SampEn as mediator, instead of PLE.
To see if this decrease in VarExp when we used SampEn as mediator is significant, we did a t-test between VarExps by PLE as mediator and VarExps by SampEn as mediator (Fig. 4). We used Kolmogorov–Smirnov test and Bartlett’s test to see if the VarExp values come from a standard normal distribution and VarExp when PLE is mediator and VarExp when SampEn as mediator have equal variances, respectively and saw significant results for the first (P < 0.001 for both) and non-significant results for the second (P > 0.05) test. Then, we applied a t-test and found that VarExp when PLE (mean = 0.326, SD = 0.080) is mediator is significantly higher than VarExp when SampEn is mediator (mean = 0.158, SD = 0.074) (t(34) = 6.585, P < 0.001, SD = 0.077). We did the same analysis using MF instead of PLE too (P-values for Kolmogorov–Smirnov test were <0.001, for Bartlett, >0.001, VarExp when MF as mediator (mean = 0.360, SD = 0.107) was found to be significantly higher than SampEn as mediator (mean = 0.148, SD = 0.089) (t(34) = 6.487, SD = 0.098).
Discussion
Intrinsic topography and dynamics of sensory systems
Previous findings show a neural hierarchy throughout the whole cortex along the lines of unimodal and transmodal regions. Generally, unimodal regions (“periphery”) show less functional connectivity among each other and shorter intrinsic neural timescales than transmodal regions (“core”) (Honey et al. 2012; Chaudhuri et al. 2015; Margulies et al. 2016; Golesorkhi et al. 2020, 2021; Ito et al. 2020; Raut et al. 2020). The strict distinction of uni- versus transmodal regions may be put into doubt, though, when considering sensory input systems. For instance, the auditory system includes both unimodal regions like primary auditory cortex as well as transmodal regions, such as the DLPFC (Taylor et al. 2015; Wengler et al. 2020).
We observed that the regions within each of the three input systems, that is, visual, somatosensory, and auditory differed from each other in their dynamics. Notably this applied to both PLE and SampEn during both rest and all six task states; that is indicative of the intrinsic nature of the topographic differences within the input systems. This was extended further when comparing the different sensory input systems with each other in both their topography and dynamics. Together, these findings suggest an elaborate intrinsic topographic and dynamic organization within the input systems as well as key differences between them.
Criticality regulates the irregularity of information processing in sensory input systems
We observed significant correlation of PLE with SampEn. The higher the PLE, the lower the SampEn. To the authors’ knowledge, this association between these measures is a novel finding that raises further questions about the effect of scale-freeness on input and thus information processing. That was further explored in simulation and mediation model.
The simulation showed three different types of relationships in different power-law structures. If we look only at a single zone, we see a linear relationship between PLE and SampEn (be it positive in the purple noise, negative in the pink noise or non-relationship in the white noise). However, when we look at the whole range of PLE, we can see the three types of relationships clearly which together form a non-linear relationship (Fig. 3). These different types of PLE-SampEn relationships may be related to the differences in the power of slower and faster frequencies. In that case, one would expect that median frequency, as an index of the slow-fast frequency balance in the power spectrum, shows similar non-linear relationship. This was indeed the case in our simulation (see Supplementary Results 2—Fig. 1). That is further supported by the fact that the significant correlation between PLE and SampEn is nonsignificant when abolishing the slow-fast scale-free nature of the power spectrum in our simulation by generating white noise (where the power of slow and fast frequencies are equal). We consequently assume that pink noise with its scale-free structure of slow-fast frequency power asymmetry where the slower frequencies are more powerful is key in the regulatory role of PLE’s modulation of SampEn as index of input responsiveness. In line with the ideas about criticality in the brain (Tononi et al. 1994; Henrik and Marcelo 1999; Beggs and Plenz 2003; Chialvo et al. 2008; Chialvo 2010; Deco and Jirsa 2012; Shanahan 2012; Tagliazucchi et al. 2012; Korchinski et al. 2021), result supports that the maximal change of SampEn, thus, effective information processing, requires a brain-like environment with a particular slow-fast structure in the power spectrum. Together, this suggests a predominantly task-unspecific intrinsic dynamic, where the sensory regions’ degree of criticality (PLE) modulates the degree of regularity/irregularity of its information processing (SampEn).
The regulating role of PLE in our results is well compatible with its role in determining the critical point. The brain may operate on a neural dynamic spectrum that may be closer or less close to its critical point with that position indicated by the PLE (Linkenkaer-Hansen et al. 2001; Chialvo 2010; He et al. 2010, 2014; Shew and Plenz 2012; Ponce-Alvarez et al. 2018; Korchinski et al. 2021; Pang et al. 2021). Recent findings show that the degree of criticality (as indexed by PLE) modulates the range of possible changes in other task-related neural measures like alpha (Kim and Lee 2020), trial-to-trial variability and amplitude (Huang et al. 2017; Avramiea et al. 2020). Our findings extend this by showing that PLE also modulates signal regularity/irregularity, that is, SampEn, during task states.
Given that the regions (and subjects’) closeness to criticality is key for the degree of activity changes during input processing, one may assume that the PLE provides a region- and subject-specific baseline or threshold (see also Huang et al. 2017; Scalabrini et al. 2017, 2019; Northoff et al. 2020a, 2020b). That in turn may account for the observed differences between regions and ultimately their distinct neural hierarchies within all three sensory input systems.
This relationship was further probed in mediation model where we used PLE as mediating variable for the transition of SampEn from rest to task. This yielded a partial mediation effect which was significantly higher for PLE as mediating variable than SampEn as mediating variable. Again, this was demonstrated for all tasks and all three sensory systems. Together, this suggests a predominantly task-unspecific intrinsic dynamic where the sensory regions’ degree of criticality (PLE) modulates the degree of regularity/irregularity of its information processing (SampEn).
We show distinct neural topographic and dynamics within and between the three main sensory input systems, visual, auditory, and somatosensory. As this holds during both rest and task states, we suppose that such topographic dynamics are intrinsic features thus supporting the more general assumption of uni-transmodal hierarchy across the whole cortex. Moreover, our results suggest that scale-free activity (PLE) may be key in regulating input and information processing in a non-linear way by modulating its regularity/irregularity (SampEn) during the transition from rest to task states.
Together, our results demonstrate an intrinsic topography and dynamics of sensory input systems. This raises the question whether their intrinsic topographic and dynamic features are related to corresponding spatial and temporal stochastics in both input stochastics and perception. In that case, spatial topography and temporal dynamic may be manifest in analogous ways on both neural and psychological levels as their “common currency”; this supports the recently introduced concept of “Spatiotemporal Neuroscience” (Northoff et al. 2020a, 2020b).
Notes
We thank Andrea Scalabrini, Mehrshad Golesorkhi, Soren Wainio-Theberge, Annemarie Wolff and Stefano Damiani for their help in the research. Conflict of Interest: None declared.
Funding
This work was supported by EJLB-Michael Smith Foundation; Canadian Institutes of Health Research; Ministry of Science and Technology of China; National Key R&D Program of China (2016YFC1306700); Hope of Depression Foundation (HDRF); Start-Up Research Grant in Hangzhou Normal University and European Union's Horizon 2020 Framework Program for Research; Innovation under the Specific Grant Agreement No. 785907 (Human Brain Project SGA2) and Canada-UK Artificial Intelligence (AI) Initiative ``The self as agent-environment nexus: crossing disciplinary boundaries to help human selves and anticipate artificial selves'' (ES/T01279X/1) (together with Karl J. Friston from the UK).
References
He BJ.
He BJ, Zempel JM, Snyder AZ, Raichle ME.
Jensen HJ, Magnasco MO.
Zhang J, Huang Z, Chen Y, Zhang Jun, Ghinda D, Nikolova Y, Wu J, Xu J, Bai W, Mao Y, et al.