


Abstract
Recent advances in brain imaging have enabled non-invasive in vivo assessment of the fetal brain. Characterizing brain development in healthy fetuses provides baseline measures for identifying deviations in brain function in high-risk clinical groups. We examined 110 resting state MRI data sets from fetuses at 19 to 40 weeks’ gestation. Using graph-theoretic techniques, we characterized global organizational features of the fetal functional connectome and their prenatal trajectories. Topological features related to network integration (i.e., global efficiency) and segregation (i.e., clustering) were assessed. Fetal networks exhibited small-world topology, showing high clustering and short average path length relative to reference networks. Likewise, fetal networks’ quantitative small world indices met criteria for small-worldness (σ > 1, ω = [−0.5 0.5]). Along with this, fetal networks demonstrated global and local efficiency, economy, and modularity. A right-tailed degree distribution, suggesting the presence of central areas that are more highly connected to other regions, was also observed. Metrics, however, were not static during gestation; measures associated with segregation—local efficiency and modularity—decreased with advancing gestational age. Altogether, these suggest that the neural circuitry underpinning the brain’s ability to segregate and integrate information exists as early as the late 2nd trimester of pregnancy and reorganizes during the prenatal period.
Significance statement.
Mounting evidence for the fetal origins of some neurodevelopmental disorders underscores the importance of identifying features of healthy fetal brain functional development. Alterations in prenatal brain connectomics may serve as early markers for identifying fetal-onset neurodevelopmental disorders, which in turn provide improved surveillance of at-risk fetuses and support the initiation of early interventions.
Introduction
The fetal brain develops rapidly during gestation (Stiles and Jernigan 2010). A series of carefully orchestrated processes including neurogenesis, neural migration, and neural circuitry formation, among others, commence during the third embryonic week and are shaped by genetic and later, epigenetic and environmental factors (Rakic et al. 1986; Rakic 1988; Kostovic and Rakic 1990; Kostović and Jovanov-Milošević 2006; Bystron et al. 2008; Kostović and Judas 2010; Tau and Peterson 2010; Vasung et al. 2010; Malik et al. 2013; Volpe et al. 2017). Previously, in vivo assessment of fetal brain structural and functional changes was not feasible in utero. Recent advances in noninvasive neuroimaging techniques have afforded scientists and clinicians promising tools for interrogating fetal and early postnatal brain development (Doria et al. 2010; Schöpf et al. 2011; Thomason et al. 2013). This is becoming increasingly relevant as the evidence tracing the roots of prevalent neuropsychiatric disorders such as major depression, autism, attention deficit hyperactivity disorder, and schizophrenia are finding their origins in the womb (Szatmari 2011; Raznahan et al. 2012; Glover et al. 2018; Al-Haddad et al. 2019; Robinson et al. 2019; Rotem-Kohavi et al. 2020). Despite numerous studies, the origins of neurodevelopmental disorders remain poorly understood.
In recent years, researchers have begun using resting state functional connectivity MRI (rs-fcMRI) to elucidate whole brain functional connectivity networks in fetuses. Rs-fcMRI detects fluctuations in blood oxygen level-dependent (BOLD) signals; these act as surrogates for neuronal activity (Biswal et al. 1995). The first fetal resting state study by Schopf et al. showed bilateral occipital networks, robust connections between medial and prefrontal regions, and lateralization in the superior temporal cortices (Schöpf et al. 2012). Later studies demonstrated an increasing medial-to-lateral and anterior-to-posterior connectivity gradient with increasing gestational age (GA) (Thomason et al. 2013), increasing intra- and interhemispheric functional connectivity strength with maturity (Thomason et al. 2013; Jakab et al. 2014; Thomason et al. 2014b), weak connectivity in language areas of the brain in fetuses eventually born before term age (Thomason et al. 2017), sexual dimorphism of fetal RSNs (Wheelock et al. 2019) and adverse effects of lead on cross-hemispheric connections (Thomason et al. 2019).
Graph theory is a quantitative framework for modeling complex networks and the interactions among their components (Bullmore and Sporns 2009; Rubinov and Sporns 2010); here, the fetal brain is modeled as a collection of nodes and edges where nodes are regions of interest (ROIs) and edges are the statistical correlations/connections between ROIs’ BOLD activity over time. An advantage of graph-theoretic techniques over other approaches is that it allows for the characterization of the network’s overall organization and not just specific connections. The few studies that have characterized fetal resting state networks (RSNs) using graph theory (Jakab et al. f; Thomason et al. 2014a;van den Heuvel et al. 2018 ; Turk et al. 2019) have reported an occipital-temporal-frontal–parietal sequence of functional maturation in the fetal brain (Jakab et al. 2014), higher integration between functional modules with increasing GA (Thomason et al. 2014a), presence of influential nodes or hubs in sensorimotor regions and some association areas (van den Heuvel et al. 2018; Turk et al. 2019) and overlapping hubs in fetuses and adults (Turk et al. 2019). These studies have provided critical insights into fetal neurodevelopment but have mainly focused on the mesoscale and regional features of networks. While the recent study by Turk et al. (Turk et al. 2019) described small-world organization, it mainly focused on the fetal brain’s hub architecture and how it compared to adult networks.
Our study aimed to characterize the global network organization of fetal RSNs and to determine the trajectory of these metrics from 19 to 40 weeks gestation. We assessed the small-world organization of fetal RSNs using multiple small world indices (Humphries et al. 2006; Humphries and Gurney 2008; Telesford et al. 2011); using two indices gives a more nuanced understanding of the ‘small worldness’ of a network. To further understand underlying global organizing principles, we described the degree distribution and quantified network modularity, efficiency, and economy of fetal RSNs; to the best of our knowledge, except for modularity (Thomason et al. 2014a), none of these metrics have previously been reported in healthy fetuses. Availability of these metrics provides baseline healthy information on which to compare clinical groups against. Individuals with ASD, for example, have aberrant network efficiency (You et al. 2013; Itahashi et al. 2014). Lastly, we examined the associations between global metrics and advancing gestational age. We expected that metrics will change over time, reflecting the brain’s response to the changing gestational environment.
Materials and Methods
Participants
Resting state data acquired from the fetuses of 95 pregnant women who were recruited as part of an ongoing prospective, longitudinal study examining brain development in fetuses and infants with congenital heart disease at Children’s National in Washington DC were included in the study. There were 110 datasets analyzed (i.e., 15 women were scanned twice) from 95 fetuses, 49 females and 46 males, between 19.14–39.71 weeks GA (see Supplemental Material for additional details). All fetal brain MRI studies were reviewed by an experienced pediatric neuroradiologist (GV) and were reported to have structurally normal brains. Maternal exclusion criteria included pregnant women with known psychiatric/metabolic/genetic disorders, complicated pregnancies (i.e., preeclampsia and gestational diabetes), multiple pregnancies, alcohol, and tobacco use, maternal medications, and contraindications to MRI. Fetuses from healthy pregnancies with normal fetal echocardiogram and ultrasonogram were eligible for the study. Fetal exclusion criteria included: dysmorphic feature by antenatal ultrasound, chromosomal abnormalities by amniocentesis, presentation after 28 weeks gestational age, multiple gestations, and evidence of congenital infections. The Institutional Review Board (IRB) of Children’s National approved this study, and all experiments were performed following the regulations and guidelines of the IRB. Written informed consent was obtained from each study participant.
MRI Acquisition
Anatomical and functional MRI data were acquired using a 1.5 Tesla MRI scanner (GE Healthcare, Milwaukee, WI) with an 8-channel receiver coil. Single-shot fast spin-echo anatomical T2- weighted images (i.e., sagittal, axial, and coronal slices) were collected using the following settings: TR, 1100 ms; TE 160 ms, flip angle, 90°; and slice thickness, 2 mm; resting state echo planar images (EPI) were acquired using the following parameters: TR, 3000 ms; TE, 60 ms; voxel size, 2.578 x 2.578 x 3 mm; flip angle, 90°; field of view, 33 cm; matrix size, 128 x 128.
Processing of Resting State Data
To minimize the potential effects of noise on the measured BOLD signal, resting state data were temporally and spatially denoised. Preprocessing was performed using the Analysis of Functional Neuroimage (AFNI) (Cox 1996) software package unless specified otherwise. After slice time correction, the time series’s first four frames were discarded to allow the magnetic gradients to stabilize. Fetal BOLD EPI images were then oriented to their anatomic counterpart, which was previously oriented to an age-matched GA template (Gholipour et a. 2017), using landmark-based rigid registration implemented using IRTK (https://github.com/BioMedIA/IRTK). Once the fetal EPI images were in radiologic orientation, they were despiked, bias-field corrected (using N4BiasFieldCorrection tool) (Tustison et al. 2010), and corrected for motion using an algorithm optimized for motion in fetuses and newborns (Joshi et al. 2011; Scheinost et al. 2018). The latter uses a two-pass registration approach to align all volumes of the time series to a reference EPI volume, the boundaries of which are defined using a brain mask. This mask was generated using an in-house whole brain segmentation approach based on UNet, a deep learning algorithm; the fetal mask was carefully examined to ensure full coverage of the reference volume. After motion correction, a second EPI brain mask, this time based on the mean of the motion-corrected images, was created using the same technique; this was the final mask used to extract the fetal brain from the surrounding maternal tissues. The T2 anatomical image was then registered to the motion-corrected resting state data using FMRIB’s Linear Image Registration Tool (FLIRT) (Jenkinson and Smith 2001; Jenkinson et al. 2002). The resting state images were then intensity scaled to a global mode of 1000 (Ojemann et al. 1997), smoothed using an isotropic 4.5 mm full-width half-maximum Gaussian kernel and band-pass filtered to include signals within the range 0.01 Hz–0.1 Hz. Nuisance regression with censoring of frames assessed as low quality was then performed; residual BOLD signals from this regression were analyzed.
To elaborate on the nuisance regression previously mentioned, tissue- and motion-related signals were included as regressors (Behzadi et al. 2007; Jo et al. 2010; Hallquist et al. 2013). Tissue signals were derived from the white matter and ventricles, initially delineated in the high-resolution anatomy. Specifically, anatomical component correction (aCompCor) using the first three principal components of the white matter signal (Behzadi et al. 2007; Muschelli et al. 2014) and localized white matter regression (ANATICOR)(Jo et al. 2010, 2013) defined nuisance signals originating from these tissues. Motion regressors included linearly detrended rigid motion parameters and their temporal derivatives (Friston et al. 1996). In addition, low quality volumes defined by high frame-by-frame motion and high number of voxel intensity outliers (determined using AFNI’s 3dToutcount) were censored from the time series. High motion included those with frame-by-frame motion exceeding 1 mm and rotational motion greater than 1.5° (Thomason et al. 2017, 2019; van den Heuvel et al. 2018; Li et al. 2019; Wheelock et al. 2019). Volumes where more than 10% of voxels had intensities deviating from the voxel time series’ median absolute deviation were excluded. After low quality volumes were removed, only fetuses with at least four minutes of good quality resting state data were included.
Graph Analysis
Graph Formation
The fetal brain was parcellated into 200 cortical, subcortical, and cerebellar regions of interest (ROIs) defined using a spectral clustering algorithm applied to functional data (Craddock et al. 2012), an approach we have previously used (De Asis-Cruz et al. 2020a). The BOLD signal for an ROI is the average BOLD signal of all voxels that comprise the ROI; these were measured after intensity-based masking of individual label masks (Peer et al. 2016) to ensure that voxels with significant signal dropout were removed in the analysis. The Pearson product–moment correlation coefficient was then computed across all ROI pairs, yielding 19 900 correlations. The correlation, r, between a pair of ROIs represents its functional connectivity. A subject’s graph thus consists of 200 nodes and their connections (edges). To remove spurious correlations, as described in our previous work (De Asis-Cruz et al. 2018), only positive edges significant at pFDR < 0.05 were included. In addition, to obtain reliable graph-theoretic metrics, each fetal graph was thresholded as follows: we analyzed graphs where at least 95% of the nodes were connected for all subjects and where the average degree, k > 2 * ln (number of nodes) (Achard et al. 2006; Bassett et al. 2006). These defined graphs within the edge density (or cost) range = 0.10–051 (interval = 0.01). Global network metrics were computed from each subject’s 200 x 200 binary, undirected graphs at each interval within these range, then averaged across the full range (Lynall et al. 2010).
Graph-theoretic Metrics
The publicly available Brain Connectivity Toolbox found here (https://sites.google.com/site/bctnet/) was used to compute graph metrics (Rubinov and Sporns 2010). These included clustering coefficient (C), characteristic path length (L), global efficiency (GE), local efficiency (LE), and modularity (Q). Briefly, clustering coefficient describes the tendency of neighbors of a node to also be connected to each other. Characteristic path length is the average shortest distance between any two nodes in a network. Related to path length is global efficiency (i.e., inverse of path length) which quantifies how well information is exchanged in the entire network. On the other hand, local efficiency is more closely related to clustering coefficient and describes the ease of exchange of information among neighbors of one node when this node is removed. Modularity measures the tendency of nodes of a network to form subnetworks where nodes are more densely connected with other nodes in their subgroup and sparsely connected to other clusters (Newman 2006). Here, L and GE were used to index network integration; C, LE, and Q were used to represent segregation (or specialization) (Cohen and D'Esposito 2016; Lowe et al. 2016).
To characterize small-world topology, captured by the scalar values σ (Humphries et al. 2006; Humphries and Gurney 2008) and ω (Telesford et al. 2011), and network economy, quantified using cost efficiency (CE = Eglob—cost), 100 reference random and lattice networks that preserved the degree distribution of the original network at each threshold for each subject were generated. Small-worldness is commonly quantified using σ; however, recent studies (Telesford et al. 2011; Muldoon et al. 2016) have suggested that normalizing a subjects’ clustering coefficients to highly clustered lattice networks, such as the case with the metric ω, may be more appropriate. Both were presented here to provide a more nuanced assessment of small-world topology in fetal RSNs. A network is considered small world when σ > 1 and when ω is within the range [−0.5 0.5]. To assess the statistical significance of σ, a one-sample t-test against a mean of 1 was performed. The closer ω is to 0, the more a network is considered small world; positive values suggest more similarity to random networks and negative to lattice networks. We assessed the difference between the fetal network metrics previously described and reference networks using a one-way analysis of variance (ANOVA). As for the network economy, a network was considered economical when the cost efficiency (CE) at all cost intervals was greater than 0.
We also evaluated if fetal RSNs possessed a right-tailed distribution. Most complex real-world networks, including the human brain (Achard et al. 2006; De Asis-Cruz et al. 2015), present with a heavy-tailed distribution with a few nodes having higher degree. We averaged individuals’ unthresholded networks and created a group matrix with the top 10% of edges (i.e., proportional thresholding). A histogram was plotted to visualize the presence of highly connected nodes in the network. Then, we assessed which model—exponentially truncated power law, power law, or exponential—best fit our data distribution using the Akaike information criteria (AIC). The R package brainwaver (Achard et al. 2006) was used for this analysis.
We then evaluated the relationship between the network metrics above and gestational age using generalized estimating equations (GEE) (Zeger et al. 1988). GEE was used to account for repeated measurements in 15 fetuses. We included age and gender as covariates of interest. This analysis was performed in SAS Studio Version 13.1 (Release 3.8) using the GENMOD function.
Results
Participant Characteristics
The clinical characteristics of our cohort are shown in Table 1. A total of 110 fetal resting state scans from 95 healthy fetuses from low-risk pregnancies with normal structural brain MRIs were analyzed. Gestational ages ranged between 19.14–39.71 weeks (median ± MAD: 34.93 ± 3.12).
Fetal Clinical Characteristics
| Characteristics | Median | 25 75 IQR |
|---|---|---|
| Female male (n) | 49 46 | |
| GA at scan, weeks | 34.93 | 31.29 36.57 |
| GA at birth, weeks | 39.57 | 38.71 40.29 |
| Birthweight, grams | 3170 | 3170 |
| Apgar score at 1 minute | 8 | 8 9 |
| Apgar score at 5 minutes | 9 | 9 9 |
| Mode of delivery | ||
| Vaginal | 59 | |
| Cesarean | 27 |
Note:*Data unavailable for some participants (characteristic, missing): GA at birth, 3; birthweight, 6; APGAR scores. 20; mode of delivery 9
Quality Assurance of Resting State Data
High motion volumes, those with frame-by-frame translational and rotational displacement > 1 mm and > 1.5°, respectively, were removed from the time series. Data with at least 80 volumes remaining (i.e., 4 minutes duration) after censoring of motion corrupted frames were included in the analysis. While on average, 108 ± 17 volumes were available for analysis, only 80 volumes were used per participant to eliminate the effect of having a variable number of data points on correlation strength (i.e., higher number of data points lead to higher correlation; Table 2). Fetal head motion, summarized using average (median, [25–75] IQR: 0.50, [0.39–0.61]) and maximum (1.38, [1.27–1.49]) framewise displacement (Power et al. 2012), did not correlate with gestational age at scan or any of the graph metrics. Table 3 provides a summary of fetal head motion data.
Duration of resting state scans
| Duration (min) | Frames (volumes) | |||
|---|---|---|---|---|
| Median | 25 75 IQR | Median | 25 75 IQR | |
| Total | 7 | 7 7 | 140 | 140 140 |
| Data after preprocessing | 5.35 | 4.6 6 | 107 | 91 120 |
| Data analyzed | 4 | 80 | ||
| Duration (min) | Frames (volumes) | |||
|---|---|---|---|---|
| Median | 25 75 IQR | Median | 25 75 IQR | |
| Total | 7 | 7 7 | 140 | 140 140 |
| Data after preprocessing | 5.35 | 4.6 6 | 107 | 91 120 |
| Data analyzed | 4 | 80 | ||
Average and maximum frame-by-frame displacement
| Duration (min) | Frames (volumes) | |||
|---|---|---|---|---|
| Median | 25 75 IQR | Median | 25 75 IQR | |
| x (mm) | 0.1173 | 0.0917 0.1413 | 0.5098 | 0.4248 0.6239 |
| y (mm) | 0.1199 | 0.0994 0.1550 | 0.5098 | 0.4248 0.5972 |
| z (mm) | 0.1542 | 0.1269 0.2090 | 0.6166 | 0.5098 0.7646 |
| pitch (°) | 0.2057 | 0.1565 0.2549 | 0.9164 | 0.7187 1.2385 |
| yaw (°) | 0.1996 | 0.1572 0.2488 | 0.9070 | 0.7021 1.1563 |
| roll (°) | 0.1903 | 0.1569 0.2458 | 1.0322 | 0.8007 1.2552 |
Small World Organization of Fetal RSNs
Graph metrics were measured from binarized fetal resting state networks with edge density between 0.10 and 0.51 (see Methods). To evaluate small-world topology, clustering coefficients and path lengths were measured from individual networks, averaged across the cohort, and then across the threshold range. Clustering refers to the tendency of neighbors of a node to connect with each other; path length refers to the average distance between any two nodes in a network. This architecture allows networks to be simultaneously segregated (or specialized) and integrated. A small-world network has high clustering similar to a lattice network and short path length similar to a random network (Maslov and Sneppen 2002).
We quantified small-worldness using the indices σ (Humphries et al. 2006; Humphries and Gurney 2008) and ω (Telesford et al. 2011). The index σ compares C and L of the brain network to 100 equivalent random networks. Small-world networks have higher clustering than random networks, Cfetus > > Crandom, and longer or comparable path lengths, Lfetus ≥ Lrandom. Within the range of evaluated density thresholds, Cfetus (median [25–75 IQR]: 0.58 [0.57–0.60] was greater than Crandom (0.34 [0.33–0.36]; p < 0.001; Fig. 1), suggesting that fetal brain networks had higher levels of local organization compared to random networks. As graphs grew sparser, Cfetus decreased. The characteristic path length for the fetal brain, Lfetus, was longer than random networks, Lrandom: 1.86 [1.84–189] versus 1.71 [1.71–1.72]. As expected, path lengths became longer as graphs became less dense, as more nodes needed to be traversed to reach other nodes. The small world index σ is the ratio between normalized clustering coefficient (λ = Cfetus/Crandom; 1.86 [1.75–1.94]) and normalized path length (γ = Lfetus/Lrandom; 1.08 [1.07–1.09]); to be considered small world, σ, or λ/γ, must be greater than 1. For our cohort, σ = 1.69 [1.58–1.77] (p < 0.0001), suggesting that fetal RSNs are small world.
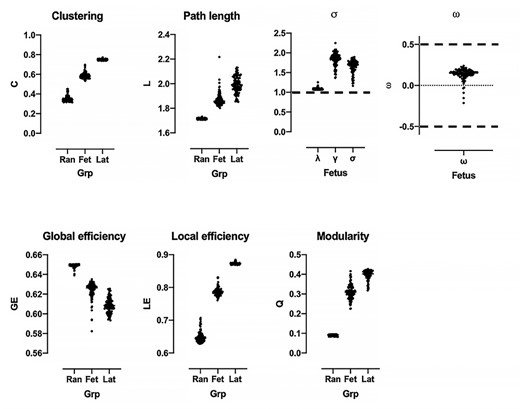
Global network features of the fetal functional connectome. Top shows small world properties of fetal RSNs (Fet). Indices s and w met criteria for small-worldness, marked by the black dashed line. Fetal metrics shown relative to values from reference random (Ran) and lattice networks (Lat).
An alternative metric for quantifying small worldness is ω. Telesford and colleagues proposed that network clustering is more appropriately normalized to the clustering coefficients of maximally clustered lattice graphs (Telesford et al. 2011). A network is considered small world if ω, defined as Lrandom/Lfetus—Cfetus/Clattice, is within the range [−0.5 0.5]. The closer ω is to 0, the more the network exhibits small-world properties. Our fetal cohort’s networks had lower clustering and shorter path length compared to reference lattice networks (Clattice = 0.75 [0.74–0.75], Llattice = 2.00 [1.95–2.04]). As with σ, ω suggested that fetal RSNs were small world with ω = 0.15 [0.12–0.18].
Economy of Fetal Networks
We then determined whether fetal networks were economical. We computed global (GEfetus) and local (LEfetus) efficiency by averaging efficiency values across all subjects at each cost (edge density) threshold (Fig. 2). Fetal networks’ global (0.626 [0.621–0.629]) and local (0.786 [0.780–0.793]) efficiency were intermediate to random (GErandom: 0.649 [0.648–0.650], LErandom: 0.645 [0.637–0.656]) and lattice (GElattice: 0.608 [0.602–0.625], LElattice: 0.873 [0.871–0.875]) networks. Within the evaluated cost range, global and local efficiency of fetal networks exceeded network costs, suggesting economy. Cost efficiency (CEfetus = GEfetus—Costfetus) was highest when 19% (3781/19900) of all possible connections in the network where present. At cost of 0.19, CEfetus = 0.35.
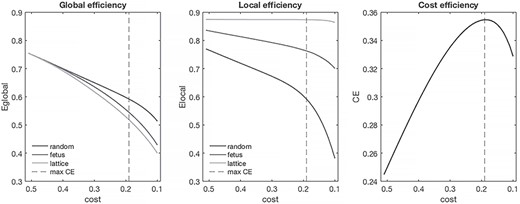
Economy of fetal RSNs. Global and local efficiency of fetal networks, as a function of network cost, are shown relative to random and lattice networks. Fetal RSNs are cost efficient (right); CE values >0 at all costs tested. Maximum cost efficiency denoted by dashed vertical line.
Right-Tailed Degree Distribution of Fetal Networks
Figure 3 shows the degree distribution, p(k), of the group-averaged connectivity matrix at network density of 0.10, the lowest density at which we evaluated individual networks. The degree distribution, which describes the frequency of connections per node, was heavy-tailed; there were a few nodes (hubs) in the right tail of the distribution that were highly connected to other nodes. Three models were compared to best describe the degree distribution. Of the three, the exponentially truncated power, p(k) = kα-1/ek/kc, best fitted the data (Akaike’s information criterion, AIC: 1326). Other model fits evaluated were power law, p(k) ~ k-α, and exponential, p(k) = e-(α)(k); AIC values for these were 2004 and 1598, respectively.
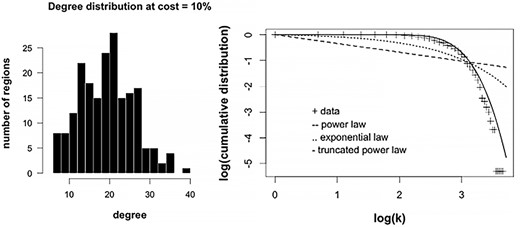
Degree distribution of fetal RSNs. Right tailed distribution at cost (edge density) = 10% is shown (left). A few nodes that have high degree occupy the right side of the distribution. Right show log–log plots of degree vs cumulative distribution; different model fits are presented with truncated power law showing the best fit.
Modularity of Fetal Networks
Modularity describes the tendency of networks to organize into groups of nodes, called modules or communities, whose members are densely connected to each other but sparsely connected to other modules (Newman 2006). The modularity, Q, of fetal RSNs was 0.31 [0.29–0.33], suggesting its modular organization (Fig. 1). Q of fetal networks was significantly higher compared to random (0.093 [0.091–0.094]; p < 0.0001) and lower compared to lattice (0.40 [0.39–0.41]; p < 0.0001) networks. The modularity of the group averaged matrix when connection density was 10% was 0.54.
Fetal Gestational Age and Network Metrics
We assessed the relationship between fetal gestational age and the previously described network measures (Fig. 4). Of these, modularity, local efficiency, normalized clustering coefficient, and the small world index σ significantly decreased with increasing GA (Table 4; p < 0.05). Clustering coefficient decreased, as well, but its effect on GA was only trending towards significance. The patterns observed remained after excluding fetuses less than 25 weeks and greater than 39 weeks (see Supplemental Material). We did not observe a significant correlation between GA and the rest of the metrics—L, λ, ω, and GE. None of the metrics were associated with fetal sex.
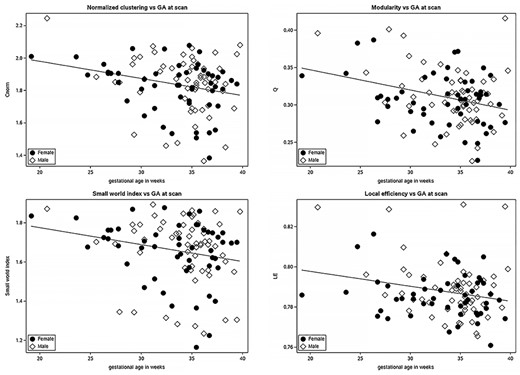
Normalized clustering, modularity, small world index (σ), and local efficiency decrease with advancing gestational age. Males (dot); females (diamond).
Association between graph metrics and fetal gestational age and sex
| GA at scan | Sex | |||||||
|---|---|---|---|---|---|---|---|---|
| M | β | SE | z | p | β | SE | z | p |
| C | -0.0014 | 0.0008 | -1.68 | 0.0931 | -0.0079 | 0.0050 | -1.59 | 0.1120 |
| L | -0.0021 | 0.0014 | -1.50 | 0.1340 | -0.0119 | 0.0097 | -1.23 | 0.2187 |
| Q | -0.0034 | 0.0010 | -3.52 | 0.0004 | -0.0033 | 0.0058 | -0.57 | 0.5695 |
| GE | 0.0002 | 0.0002 | 1.05 | 0.2945 | 0.0022 | 0.0015 | 1.45 | 0.1482 |
| LE | -0.0008 | 0.0004 | -2.05 | 0.0407 | -0.0039 | 0.0022 | -1.78 | 0.0753 |
| CE | 0.0002 | 0.0002 | 1.05 | 0.2948 | 0.0022 | 0.0015 | 1.45 | 0.1482 |
| λ | -0.0012 | 0.0007 | -1.58 | 0.1145 | -0.0071 | 0.0048 | -1.49 | 0.1365 |
| γ | -0.0098 | 0.0034 | -2.84 | 0.0045 | -0.0398 | 0.0317 | -1.26 | 0.2090 |
| σ | -0.0079 | 0.0032 | -2.46 | 0.0140 | -0.0176 | 0.0321 | -0.55 | 0.5832 |
| ω | 0.0025 | 0.0021 | 1.24 | 0.2163 | 0.0182 | 0.0121 | 1.51 | 0.1302 |
Note: Results, Fetal gestational age and network metrics
Discussion
Using fMRI and network analysis techniques, we delineated global features of resting state networks in a large sample of healthy fetuses in the latter half of gestation (19.14–39.71 weeks gestational age). In this normative fetal cohort, using different small world metrics, we showed that fetal RSNs exhibited efficient and economic small-world topology and modular organization. These findings suggest that fetal networks are simultaneously specialized—demonstrated by the tendency to organize into modules—and integrated and that this efficiency is achieved at a minimal cost. We also demonstrated that fetal RSNs have heavy-tailed degree distribution, implying the presence of highly connected hubs in the right tail of the distribution that facilitate integration within and across modules. Lastly, we showed that some network metrics, such as local efficiency and modularity, decreased with increasing gestational age. Taken together, these findings suggest that some important patterns of global network organization observed in mature brains are already present in utero, with some still dynamically changing during gestation.
We reported economic and efficient small-world networks in fetuses with gestational ages between 19 and 40 weeks. Histologic and electroencephalographic (EEG) events during this period show the emergence of transient neuronal circuitry and maturation of thalamocortical/corticothalamic fibers. The fetal neural circuity begins to emerge during the mid-fetal period (15–23 weeks) (Keunen et al. 2017; Kostović et al. 2019b). By 15 gestational weeks, both the cortical plate and subplate, transient fetal compartments essential to the formation of the first neural connections, have already formed (Molliver et al. 1973; Kostovic and Molliver 1974; Kostovic and Rakic 1990; Shatz 1992; Bystron et al. 2008; Rakic 2009; Kostović et al. 2019a). The subplate, comprised of extracellular matrix and differentiated post-migratory neurons (Kostovic and Molliver 1974; Kostovic and Rakic 1990), is the substrate for early fetal neural connectivity. Before reaching their cortical targets, thalamocortical fibers project to the subplate neurons forming a transient circuitry (Kostović and Jovanov-Milošević 2006). This circuitry has been associated with the emergence of spontaneous activity transients (SATs) in premature infants (Vanhatalo and Kaila 2006; Tolonen et al. 2007). Recorded using EEG, SATs are endogenous, intermittent, high amplitude bursts of neuronal activity that drive proper wiring of brain networks before somatosensory input is ever received (Vanhatalo and Kaila 2006, 2011; Luhmann et al. 2009, 2016; Sun et al. 2010); SATs have also been associated with more favorable neurodevelopmental outcomes in premature incomes (Benders et al. 2015). With the formation of thalamocortical connections at around 24–26 weeks (Krmpotić-Nemanić et al. 1980, 1983; Krsnik et al. 2017) and dissolution of the subplate at about 32 weeks (Kostovic and Rakic 1990), sensory-driven and more complex electrical activity (Khazipov and Luhmann 2006), including evoked potential (Kostović et al. 1992), begin to emerge (Kostović and Judas 2007; Milh et al. 2007). Computational modeling of neuronal networks has shown that burst activity timing influenced the formation of cortical synapses and the emergence of small-world architecture (Hartley et al. 2020). Specifically, long-range temporal correlations (LTRC), a complex temporal ordering of bursts observed in premature infants using EEG (Milh et al. 2007; André et al. 2010), facilitated the formation of small-world networks (Hartley et al. 2020).
Determining the association between electrical activity in the fetal brain and macroscale network organization measured using resting state BOLD signals depends on a clear understanding of neurovascular coupling. Even in human adults, this relationship is not well understood, but available evidence suggests that hemodynamic responses reflect postsynaptic potentials of local neuronal populations (i.e., local field potentials) (Logothetis et al. 2001; Logothetis 2002, 2003). To be able to infer neural activity from BOLD signals, both neural and vascular elements need to be sufficiently mature (see Review by (Vasung et al. 2019)). Another consideration is that, unlike in adults, components of the neurovascular coupling cascade in fetuses undergo significant modification during gestation. This, in turn, renders discerning the details of neurovascular coupling in fetuses very challenging. Postnatal data on rodents and premature and term human infants have shown systematic hemodynamic response maturation and suggest fMRI reliability in detecting neural connectivity patterns (Colonnese et al. 2008; Arichi et al. 2012).
We report that fetal resting state networks exhibited small-world organization. This finding is consistent with observations in human fetuses (Turk et al. 2019), premature infants as early as 30 weeks PMA (van den Heuvel et al. 2014; Cao et al. 2016), full-term neonates (Fransson et al. 2011; De Asis-Cruz et al. 2015), infants (Gao et al. 2014), children (Fair et al. 2009; Supekar et al. 2009), and adults (Achard et al. 2006; Bullmore and Sporns 2009). It has been reported across a wide range of neuroscience studies involving different species (Watts and Strogatz 1998; Oh et al. 2014; van den Heuvel et al. 2016; Rilling and van den Heuvel 2018) at different scales, using different imaging modalities (e.g., diffusion tensor imaging and EEG) (Ferri et al. 2007) including in vitro cellular studies (Bettencourt et al. 2007). In a review, Bassett et al. (Bassett and Bullmore 2017) suggested that this ‘near universality’ of small-world topology likely reflects evolutionary selection pressures, implying that the balanced integration and segregation that facilitates efficient and economical information transfer in the brain is beneficial to the organism and increases its survivability.
Previous studies on premature infants between 31–41 weeks PMA (Cao et al. 2016) showed that clustering coefficient, path length, and normalized path length positively correlated with postmenstrual age (PMA) at scan, suggesting enhanced specialization/segregation. We did not observe these trends in our fetal cohort; instead, we observed decreasing modularity, local efficiency, and clustering, although the last is only trending in significance. Functional connectivity differences between healthy fetuses and premature infants/healthy fetuses eventually born premature have recently been described (Thomason et al. 2017; De Asis-Cruz et al. 2020b). Here, we speculate that in premature infants, early exposure to the ex-utero environment likely favors increased segregation, as the ex utero fetus would need to rely on specialized brain functions (i.e., vision and motor function) to adapt to the environment. While our findings differ from those in premature infants, the decreased modularity that we reported was similarly noted by Thomason and colleagues in fetuses (Thomason et al. 2014a). They noted that young fetuses (GA < 31) had higher modularity than older fetuses. The decreased clustering, modularity, and local efficiency with advancing GA are also consistent with connectivity patterns and trajectories presented in the few studies, mostly on premature newborns and a few on fetuses, using different analysis techniques (i.e., independent component and seed-based correlation analyses). In these, they showed that distant, cross-hemispheric connections begin to develop later in development, and dense, anatomically constrained connections predominate early (Doria et al. 2010; Smyser et al. 2010; Thomason et al. 2013). During the late second and early third trimester, resting state networks of fetuses are typically organized into local, anatomically proximal groups (Thomason et al. 2013; Jakab et al. 2014; Thomason et al. 2014b). This could present as high clustering because voxels or regions close to each other would likely be connected. The reduction in clustering during the later third trimester could possibly represent fine-tuning of these local connections as the brain matures. While neurons typically proliferate during gestation, prenatal neural regression also takes place where more than 50% of neurons in certain brain regions are lost (Stiles and Jernigan 2010). Prenatal neuronal apoptosis (Rabinowicz et al. 1996; Rakic and Zecevic 2000) may account for the decrease in segregation as the brain likely only retains connections that it requires to flexibly adapt to its environment. Notably, the decreasing values in metrics that encapsulate network segregation contrast with trends observed in postnatal brain, where clustering, modularity, and local efficiency increase with age. Likely, this suggests a non-linear relationship between these metrics and age.
Small world networks imply an efficient architecture for data processing and information flow at minimal cost (i.e., wiring needs). It is important to understand wiring costs in the fetal brain as altered cost efficiency has been associated with neurologic disorders such as schizophrenia and ADHD, among others. Our current study showed that functional economy emerges during the fetal period, as demonstrated by cost efficiency values greater than cost at all measured thresholds. This is consistent with observations in neonates (De Asis-Cruz et al. 2015) and adults (Achard and Bullmore 2007). The fetal brain exhibited economy comparable to neonates (cost efficiency values of 0.35 and 0.34, respectively). Formation of synapses and establishment of the brain’s neural circuitry during the third trimester of gestation are energy-demanding processes. It is not surprising then that the human brain prioritizes economy during the early fetal period as the fetus’ survival likely depends on the proper allocation of metabolic resources. Cost efficiency in fetal networks was greater than cost at all measured thresholds.
We also showed that local efficiency in fetal resting state networks was higher in younger compared to older fetuses. This is consistent with the decreasing clustering coefficient value and modularity. The high modularity, high local efficiency configuration during the early third trimester may signal a trade-off between higher integrative capacity in the brain and lowering metabolic costs. Oxygen supply in the fetal brain outpaces consumption (Jones et al. 1982), but resources may potentially be allocated first to building connections between proximate neurons before distant ones. It is also likely that the relative hypoxemia of the fetal brain contributes to the need for maintaining metabolic requirements minimal. While fetal hypoxemia is compensated for by increased red cell mass, higher affinity of fetal hemoglobin to oxygen, and the previously mentioned lower oxygen consumption (de Ungria and Daru 2007), the brain may have redundant systems for protecting the developing brain. Keeping metabolic costs at a minimum gives the brain more flexibility to respond when there are sudden, unanticipated demands for increased resources. However, this is purely speculative and will require the simultaneous in vivo measurement of fetal cerebral blood flow and BOLD in future studies.
The degree distribution of fetal networks has not been previously characterized. The degree distribution describes the relative frequency of edges/connections for each node/ROI in the network. A right- or heavy-tailed distribution suggests that there are a few influential nodes (hubs) that are highly connected to others; the rest would have significantly fewer neighbors. This is in keeping with what we would expect in an economical brain where wiring costs are minimized, but the system remains integrated via hubs (Bassett et al. 2009; Chen et al. 2013; Tomasi et al. 2013). Our finding is consistent with previous rs-fcMRI studies in newborns and adults (Achard et al. 2006; Bassett et al. 2008; Hayasaka and Laurienti 2010; De Asis-Cruz et al. 2015). Comparable truncated power-law distributions have also been described in other types of complex ecological, social, and technological networks (Newman 2001; Amaral et al. 2000; Strogatz 2001; Lusseau and Newman 2004). This type of distribution likely arises because of constraints in node processing capability or restrictions in network growth. In fetal networks, for example, physiological, anatomic, and metabolic constraints likely prohibit the occurrence of ultra-high degree hubs such as seen in scale-free networks; instead, a distributed set of hubs are usually observed. Truncated power-law networks confer some advantages over power-law or scale-free networks; they are more resilient to insult (Achard et al. 2006; De Asis-Cruz et al. 2015), more resistant to network over synchronization (i.e., epilepsy), and capable of more specialized, independent activity (Hayasaka and Laurienti 2009).
We did not observe a significant effect of sex on global network organization. In contrast, two recent studies have demonstrated sex-related structural and functional asymmetries in the fetal brain. Vasung et al. reported greater fetal cortex (i.e., cortical plate and subplate) volume in the inferior frontal gyrus and greater subplate volume in the inferior frontal gyrus, pericalcarine area, and cingulate cortex in male fetuses (Vasung et al. 2020). Wheelock and colleagues showed sex-specific GA-functional connectivity associations in different brain regions, such as the cerebellum and frontoparietal cortices (Wheelock et al. 2019). Based on their findings, we speculate that dimorphism in global network topology emerges later in brain development, preceded by regional or connection-wise differences in the fetal period. Research in children and adults does show differences in structural and functional global network parameters, with the divergence becoming more pronounced during adolescence and early adulthood (Wu et al. 2013; Ingalhalikar et al. 2014; Zhang et al. 2016). Fetal testosterone levels at 13–20 weeks, right around the hormone’s first peak (12–18 weeks, (Finegan et al. 1989)), has been shown to influence regional gray matter dimorphism in children (Lombardo et al. 2012); this period’s role, along with the influence of the second peak of testosterone levels at 34–41 weeks (de Zegher et al. 1992) on the emergence of global network sexual dimorphism remains undetermined.
The limitations of our study bear mention. First, we focused on characterizing global properties of fetal networks because the few published fetal resting state papers focused on network community structure and hubs. Although beyond the scope of our current study, understanding how small-world properties relate to intermediate and local features of fetal networks would further enhance our understanding of fetal brain development. Second, while we studied a large sample of healthy fetuses, a cohort where younger gestational ages, i.e., second-early third trimester, are equally represented is ideal. While global network organization patterns were preserved in a subsample that excluded extreme ages, more robust mapping of functional connectivity changes would require higher numbers of second-trimester fetuses. This is especially important in understanding the gestational trajectories (i.e., linear vs. non-linear) of different global metrics. Another methodological consideration is the selection of nodes or regions of interest. A critically examined issue in network neuroscience (Fornito et al. 2013; Bassett and Sporns 2017; Hallquist and Hillary 2019; Doucet et al. 2020) because of its potential influence on connectivity estimates and network organization (Marrelec and Fransson 2011; Hallquist and Hillary 2019), selecting the ‘correct’ atlas is especially challenging in the rapidly evolving fetal brain. Based on a recent fetal study by Turk and colleagues that demonstrated robust intermediate and global network metrics across different types of parcellation (Turk et al. 2019)—a finding also noted in adults (Lord et al. 2016)—we expect the global patterns observed in our study to remain consistent across different atlases. Nevertheless, future studies that systematically evaluate the impact of node selection is essential for developing pipelines optimized for the developing brain. Lastly, motion correction in fetuses is very challenging. Apart from maternal sources of motion (i.e., respiration), fetuses also move in an unconstrained manner. To minimize the effects of motion, we censored high motion volumes and included motion parameters in our model.
Fetal fMRI-based network analysis provides crucial insights into healthy fetal brain connectome development. Our results showed that efficient and economic small-world networks with right tailed degree distributions emerge during the fetal period. In addition, local efficiency, modularity, and clustering decreased with gestational age, suggesting greater segregation in younger compared to older fetuses. Our findings suggest that some key features of complex brain networks can already be detected in utero and may serve as potential markers for early detection of deviations from healthy brain development.
Notes
We thank the participants of this study. Conflict of interest: The authors declare no competing financial interests.
Funding
This study was funded by grant R01 HL116585–01 from the National Heart, Lung, and Blood Institute, National Institutes of Health (C.L.) and grant MOP-81116 from the Canadian Institute of Health Research (C.L.).