


Abstract
Laughter is a complex motor behavior occurring in both emotional and nonemotional contexts. Here, we investigated whether the different functions of laughter are mediated by distinct networks and, if this is the case, which are the white matter tracts sustaining them. We performed a multifiber tractography investigation placing seeds in regions involved in laughter production, as identified by previous intracerebral electrical stimulation studies in humans: the pregenual anterior cingulate (pACC), ventral temporal pole (TPv), frontal operculum (FO), presupplementary motor cortex, and ventral striatum/nucleus accumbens (VS/NAcc). The primary motor cortex (M1) and two subcortical territories were also studied to trace the descending projections. Results provided evidence for the existence of two relatively distinct networks. A first network, including pACC, TPv, and VS/NAcc, is interconnected through the anterior cingulate bundle, the accumbofrontal tract, and the uncinate fasciculus, reaching the brainstem throughout the mamillo-tegmental tract. This network is likely involved in the production of emotional laughter. A second network, anchored to FO and M1, projects to the brainstem motor nuclei through the internal capsule. It is most likely the neural basis of nonemotional and conversational laughter. The two networks interact throughout the pre-SMA that is connected to both pACC and FO.
Introduction
Laughter is a multifaceted human behavior occurring in both emotional and nonemotional contexts (Wood and Niedenthal 2018). Emotional laughter is typically conceived as an expression of mirth, commonly produced in social contexts with the specific aim of promoting affiliation and social bonding (Dunbar 2012). On the other hand, laughter plays also a strategic role in nonemotional contexts including verbal and nonverbal communication (Scott et al. 2014; Provine 2016). Such nonemotional laughter could be produced spontaneously, like in conversation, or voluntarily. From the motor point of view, both these behaviors result from the activation of the motoneuronal cell groups innervating soft palate, pharynx, and larynx as well as diaphragm, intercostal, abdominal, and pelvic floor muscles (Holstege and Subramanian 2016).
These two aspects of laughter mirror the classical neurological distinction between emotional and voluntary, pyramidal, laughter. Clear evidences for this double dissociation have been provided by lesion studies. Volitional facial paresis is evident during conventional clinical testing of movement involving facial muscles, but disappears when a patient is told a joke. In contrast, emotional facial paresis is not apparent during the neurological exam but is evident when facial expressions are driven by emotions (Wild et al. 2003; Lauterbach et al. 2013). Although lesion studies have a crucial role in demonstrating the functional segregation of emotional and volitional laughter, they cannot provide an exhaustive picture of the brain networks sustaining the two behaviors.
It should be acknowledged that neuroscientific research on genuine, emotional, laughter is particularly difficult to conduct, because standard imaging techniques can hardly tackle the issue of its spontaneous and social nature. Accordingly, only few functional magnetic resonance studies investigated the neural correlates of laughter, mainly by Meletti and colleagues (Meletti et al. 2015; Talami et al. 2019; Vaudano et al. 2019) and Wattendorf and colleagues (Wattendorf et al. 2013, 2016, 2019). In contrast, insights concerning the precise identification of the regions involved in laughter production can be provided by intracerebral electrical stimulation studies mostly conducted on patients during presurgical evaluations.
In the last years, intracerebral electrical stimulations identified a limited subset of cortical and subcortical regions whose stimulation elicited laughter. In particular, at the cortical level, laughter has been evoked following the stimulation of the pregenual anterior cingulate cortex (pACC; Sperli et al. 2006; Caruana et al. 2015, 2018, 2020; Bijanki et al. 2019), the ventral temporal pole (TPv; Arroyo et al. 1993; Satow et al. 2003; Yamao et al. 2015; Caruana et al. 2020), the frontal operculum (FO; Fernández-Baca Vaca et al. 2011; Caruana et al. 2016), and the presupplementary motor cortex (pre-SMA; Fried et al. 1998; Krolak-Salmon et al. 2006; Schmitt et al. 2006). In some cases, intracerebral electrical stimulation evoked laughter accompanied by a sensation of happiness and mirth, leading to the hypothesis that some brain regions encode not only the motor aspects of laughter but also its positive affective value (Caruana 2019). At the subcortical level, laughter and mirthful sensations were elicited in studies carried out on obsessive compulsive disorder (OCD) patients during striatal stimulations, in particular of the ventral striatum/nucleus accumbens (VS/NAcc; Haq et al. 2011; Gibson et al. 2016). Another subcortical center classically considered involved in laughter behavior is the hypothalamus. Interestingly, while it is known that hypothalamic hamartomas are the most frequent cause of gelastic seizures—characterized by pathological bursts of laughter and crying (Wild et al. 2003)—and that the stimulation of the hamartomas can induce these seizures (Munari et al. 1995, 1997), there are no reports of laughter induced by the electrical stimulation of the hypothalamus. Therefore, it has been hypothesized that the hypothalamus was not a “laugh center” but rather that the laughter associated with lesions in this area was induced by lesions in connections to limbic and bulbar structures (Wild et al. 2003).
While altogether these data localized regions causally involved in laughter production, obviously stimulation studies per se cannot provide a picture on the anatomical networks through which these regions interact one to another.
To address this issue, here we performed a multifiber tractography investigation by using a ball-and-stick model. Seeds were located in the loci in which electrical stimulations are known to elicit laughter, on the basis of MNI coordinates provided by our and other groups. An additional seed was placed in the primary motor cortex (M1) since it is the cortical territory primarily involved in the voluntary control of face and mouth movements, including voluntary smile and laughter (Kern et al. 2019), and laryngeal muscles control (Eichert et al. 2020). The aim of the present study was 2-fold. First, to assess whether the areas whose stimulation produced laughter are part of a single circuit or if they are distributed over different networks. Second, to identify the specific white matter bundles interconnecting these areas.
Our results provide evidence for the existence of two relatively distinct networks. A first network, centered on the pACC, TPv, and VS/NAcc, is strongly interconnected through the anterior cingulate bundle, the accumbofrontal bundle/amygdalofugal pathway, and the uncinate fasciculus, reaching the brainstem motor nuclei throughout the mamillo-tegmental tract. A second network is anchored to the FO and the primary motor cortex, both projecting to the brainstem motor nuclei through the internal capsule. The two networks interact throughout the pre-SMA that is connected to both pACC and FO. Given the functional properties attributed to these areas, and the descending projections, we discuss at what extent the two networks support the production of the emotional and voluntary laughter, respectively.
Methods
Scanning Protocols
Data from 15 healthy humans (6 Males, 9 Females, range age 21–35, mean age 28) were acquired in a 3T MR scanner (GE MR750) equipped with a dedicated 8 channel head-coil at Parma University Hospital. The sequence protocol included a structural T1 weighted BRAVO sequence for anatomical reference, with TR/TE 57501/3.96 ms, 0.5 × 0.5 × 0.9 mm3 voxel, and a diffusion spin-echo single shot echo planar imaging (EPI) sequence, with TR/TE 56586/82.4 ms, 2 × 2 × 2 mm3 isotropic voxel, 64 diffusion directions with an effective b value of 1000 s/mm2 and 8 images with an effective b value of 0 s/mm2 both in anterior–posterior phase encoding direction and in the reverse phase encoding direction. To assess whether our results were replicable also in data with smaller voxel size, additional four subjects (2 Males and 2 Females, range age 26–35, mean age 30.5) from the WU-Minn dataset of the Human Connectome Project (HCP; Van Essen et al. 2013) were included in our analysis. These subjects (numbers 102 816, 102 311, 128 935, and 100 610) have been acquired with a 3 T MR scanner (Siemens) and the sequence protocol included a structural T1 weighted BRAVO sequence for anatomical reference, with TR/TE 2400/2.14 ms, 0.6999 × 0.6999 × 0.6999 mm3 voxel, and a diffusion spin-echo single shot EPI sequence, with TR/TE 5520/89.5 ms, 1.25 × 1.25 × 1.25 mm3 isotropic voxel, 96 diffusion directions with an effective b value of 3010 s/mm2 90 diffusion directions for each shell defined with b-values of 1000, 2000, and 3000 s/mm2, plus 18 images with an effective b value of 0 s/mm2, scanned along two phase encoding directions (L/R and R/L).
Diffusion Data Analysis
The diffusion images were analyzed with the FMRIB Software Library (FSL) tools (version 5.0.9) (Smith et al. 2004; Woolrich et al. 2009; Jenkinson et al. 2012; Glasser et al. 2013). First, employing the reversed phase data, raw images were corrected for head motion and distortions induced by eddy currents and difference in the susceptibility distribution within the brain using the FSL’s tools TOPUP (Andersson et al. 2003; Smith et al. 2004) and EDDY (Andersson and Sotiropoulos 2016). Then, diffusion tensor estimate was carried out with FSL’s BEDPOSTX tool, which enables to model multiple fiber crossing within each voxel of the brain (Behrens et al. 2003, 2007). Subsequently, a probabilistic tractography analysis was executed with FSL’s PROBTRACKX tool (using curvature threshold = 0.2, number of sample = 5000) (Behrens et al. 2003, 2007). For each tract, the streamlines were seeded from two mask images testing the structural connection from seed A to seed B and vice versa (from B to A): the final output is the sum of the connectivity distributions resulting from the two analyses. To compare and average the resulting tracts, the assessment was performed in the Montreal Neurological Institute 152 (MNI 152) space (Grabner et al. 2006). Each voxel of the resulting images contained the value of the total number of streamlines crossing in voxel, producing maps of connectivity distribution showing the most probable pathway between the selected seeds: to reduce false negative and false positive rate and obtain the best tractography reflection of tracers in monkey studies (Azadbakht et al. 2015), a threshold of 10% on the maximum number of streamlines reported by PROBTRACKX was chosen. Subsequently, to highlight the repeatability in the different subjects of the streamlines of the tracts found, each tract was binarized, the binarized tract of the different subjects added one to another and, then, their sum averaged. The value obtained is proportional at the number of the voxels in which the streamlines are present in at least the 60% of the examined subjects. These values were showed and compared one to another in radar graphs (“connectivity fingerprints”). Only the white matter tracts present in at least half of the subjects were showed. Finally, to assess whether the pathways described are connected throughout the same white matter tracts, they have been further analyzed by tracing fibers connecting three seeds altogether with an and operator (e.g., fibers reconstructed that simultaneously connect pACC and VS/NAcc and TPv using the VS/NAcc as a waypoint). In this more restrictive analysis, a threshold of 1% on the maximum number of streamlines reported by PROBTRACKX was chosen.
Identification of the White Matter Tracts
In order to identify at which fasciculi belonging the white matter tracts observed, we overlap our results with the white matter tracts (Rojkova et al. 2016) of the atlas present in the Tractotron tool in BCBToolkit software (http://toolkit.bcblab.com/;Foulon et al. 2018) and with the accumbofrontal tract as described in Karlsgodt et al. (2015) and downloaded from the follow site: http://karlsgodtlab.org/HBM_accumbofrontal/. A threshold of 10% on the maximum number of streamlines was used also for the tracts of the BCBTToolkit.
Location of the Seeds
The seeds for tractography were defined on the basis of previous studies describing the regions from which electrical stimulation elicited mirth and laughter. The location of the seeds and their coordinates were showed in Figure 1 and Table 1.
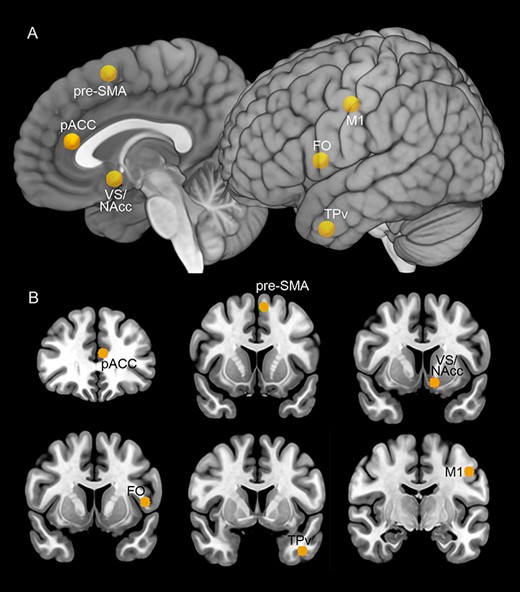
Seeds localization (yellow spheres) on the MNI152 template. The location of the seeds was shown on mesial and lateral views of a 3D reconstruction (A) and on a series of coronal sections (B). Abbreviations: FO, frontal operculum; pACC, pregenual anterior cingulate cortex; TPv, ventral temporal pole; VS/NAcc, ventral striatum/nucleus accumbens.
Coordinates of seeds used in human probabilistic tractography studies and given in MNI standard coordinates
| Region | Left hemisphere | Right hemisphere | ||||
|---|---|---|---|---|---|---|
| X | Y | Z | X | Y | Z | |
| pACC | −7 | 32 | 17 | 7 | 32 | 17 |
| FO | −44 | 8 | 6 | 44 | 8 | 6 |
| TPv | −44 | 4 | −37 | 44 | 4 | −37 |
| VS/NAcc | −12 | 8 | −11 | 12 | 8 | −11 |
| pre-SMA | −8 | 12 | 58 | 8 | 12 | 58 |
| M1 | −50 | −10 | 41 | 50 | −10 | 41 |
| Hyp/MTt | −5 | −2 | −9 | 5 | −2 | −9 |
| Brainstem nuclei | −5 | −34 | −34 | 5 | −34 | −34 |
The location of the seeds in pACC, FO, and TPv was obtained by averaging the MNI coordinates of the stimulation sites from epileptic patients described by Caruana et al. (2015, 2018, 2020). The seed in the VS/NAcc was placed in the location in which laughter was evoked in four patients implanted for the treatment of OCD (Gibson et al. 2016). Specifically, as described in Gibson and coworkers the seed was located 2.5 mm anterior to the anterior border of the anterior commissure, 3 mm inferior to the intercommisural line, and 7.5 mm lateral to midline. The three studies describing laughter following the electrical stimulation of the pre-SMA (Fried et al. 1998; Krolak-Salmon et al. 2006; Schmitt et al. 2006) did not report the MNI coordinates, thus we used the anatomical landmarks as a frame of reference, placing the seed rostral to the anterior commissure.
Considering that insula and amygdala have been both occasionally associated to laughter production, their exclusion from our analysis deserves some specifications. Concerning the insula, one case-study reported of laughter following the stimulation of the posterior insula in a drug-resistant epileptic patient (Yan et al. 2019). This finding is intriguing but disagrees with the evidence that, in the monkey, the stimulation of the ventral insula, and not the posterior one, elicited affiliative communicative gestures (Caruana et al. 2011; Jezzini et al. 2012, 2015). More importantly, the hypothesis of a link between posterior insula and laughing is in contrast with the results from other groups, who extensively mapped the human insula by using high-frequency stimulation without eliciting laughter, and showing that the stimulation of this insular sector mainly produces somatosensory sensations (e.g., Ostrowsky et al. 2000, 2002; Isnard et al. 2004; Afif et al. 2010a, 2010b; Stephani et al. 2011; Mazzola et al. 2017). Therefore, the insula has currently been excluded from our analysis both because its exact role in the behavior of laughing has yet to be defined and, even more, because the insular sector possibly involved in laughter or smile production still has an uncertain location. The amygdala contributes to emotions and social cognition (Tamietto and De Gelder 2010, Rutishauser et al. 2015, Gothard et al. 2018), and happiness and positive sensations associated with laughter and the desire to make jokes were reported following the stimulation of the left amygdala in two patients (Inman et al. 2018). As in the case of insula, however, its association to laughter production is not systematic. Indeed, the stimulation of the amygdala typically elicited negative emotions, such as fear, anxiety, and sadness, accompanied with the correspondent autonomic responses as well as complex behaviors, along with the increase of vigilance and memory retrieval (Meletti et al. 2006; Lanteaume et al. 2007; Inman et al. 2018; see also Rutishauser et al. 2015). Thus, as in the case of the insula, we discarded the amygdala as a target because its possible role in laughter still represents to date an unsettled issue.
To describe the anatomical pathways underline motor output of the regions here studied, three additional seeds were placed, one in the primary motor cortex and two at subcortical levels. The first seed was placed in the face/mouth sector of the primary motor cortex, since it is the cortical territory primarily involved in voluntary smile production. The location of this seed (for MNI coordinates see Table 1) was identified using the classical Penfield map (Penfield and Boldrey 1937; see also Cattaneo and Pavesi 2014) as a frame of reference. Interestingly, this seed overlaps very well with the location of the recently identified laryngeal motor cortex, in line with the notion that laughter production requires fine neural control not only of the face muscles but also of the larynx (Eichert et al. 2020). Finally, to define the descending projections of the regions here studied, one seed was placed in the brainstem at the level of the facial and trigeminal motor nuclei and another in a territory including the hypothalamus and the adjacent origin of the mamillo-tegmental tract (Hyp-MTt), in the so-called subcortical “laughter center” (Martin 1950; Lauterbach et al. 2013), on the basis of coordinates shown in the 7.0 Tesla MRI atlas of Cho (2010).
Results
White Matter Tracts Connecting pACC, VS/NAcc, TPv, FO, and M1
The upper part of Figure 2A–C shows the connectivity of pACC, VS/NAcc, and TPv, based on the average of the streamlines obtained from our dataset. All these areas are connected to each other in both hemispheres in the majority of the subjects of our dataset and in all subjects of the HCP dataset (see Table 2). More specifically, ball-and-stick analysis from our dataset showed connections between pACC and the VS/NAcc in the left hemisphere in 12 of 15 subjects and in the right hemisphere in 13 of 15 subjects. The connections between pACC and TPv were found in the right hemisphere in 10 of 15 subjects and in the left hemisphere in 8 of 15 subjects. The connections between VS/NAcc and TPv were found in both hemispheres of all 15 participants.
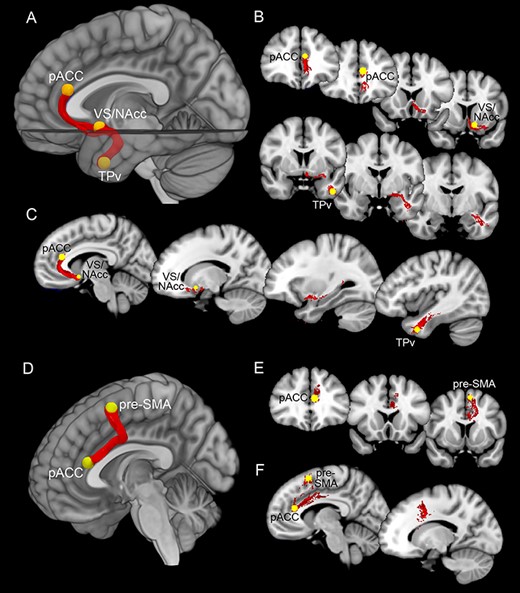
Upper part: white matter tracts connecting pACC, VS/NAcc, and TPv. Lower part: white matter tracts connecting pACC and pre-SMA. Panels (A) and (D) showed the averaged white matter tracts connecting the pACC, VS/NAcc, and TPv and those connecting pACC and pre-SMA in a mesial view of 3D reconstructions. Panels (B) and (E) showed white matter tracts connecting the pACC, VS/NAcc, and TPv and those connecting pACC and pre-SMA in a series of coronal sections ordered from rostral to caudal. Panels (C) and (F) showed white matter tracts connecting the pACC, VS/NAcc, and TPv and those connecting pACC and pre-SMA in a series of parasagittal sections ordered from mesial to lateral.
Number of subjects in which the connections are found and the average of the streamlines
| Acquisition | Resolution 2 × 2 × 2 mm | Resolution 0.7 × 0.7 × 0.7 mm | ||||||
|---|---|---|---|---|---|---|---|---|
| Hemisphere | Left | Right | Left | Right | ||||
| Tract | Subjects | Average of streamlines | Subjects | Average of streamlines | Subjects | Average of streamlines | Subjects | Average of streamlines |
| TPv-VS/NACC | 15/15 (6M and 9F) | 0.4 | 15/15 (6M and 9F) | 0.4 | 4/4 (2M and 2F) | 0.75 | 4/4 (2M and 2F) | 0.75 |
| pACC–VS/NAcc | 12/15 (6M and 6F) | 0.4 | 13/15 (6M and 7F) | 0.33 | 4/4 (2M and 2F) | 0.75 | 4/4 (2M and 2F) | 0.75 |
| pACC–TPv | 8/15 (4M and 4F) | 0.26 | 10/15 (4M and 6F) | 0.26 | 4/4 (2M and 2F) | 0.75 | 4/4 (2M and 2F) | 0.75 |
| pACC–preSMA | 9/15 (3M and 6F) | 0.26 | 12/15 (5M and 7F) | 0.33 | 3/4 (2M and 1F) | 0.5 | 3/4 (2M and 1F) | 0.5 |
| preSMA–FO | 15/15 (6M and 9F) | 0.47 | 15/15 (6M and 9F) | 0.53 | 4/4 (2M and 2F) | 0.75 | 4/4 (2M and 2F) | 0.75 |
| FO–M1 | 14/15 (6M and 8F) | 0.4 | 10/15 (3M and 7F) | 0.4 | 3/4 (1M and 2F) | 0.5 | 2/4 (1M and 1F) | 0.25 |
| FO–TPv | 12/15 (6M and 6F) | 0.26 | 5/15 (2M and 3F) | 0.2 | 3/4 (1M and 2F) | 0.5 | 4/4 (2M and 1F) | 0.5 |
Lower part of Figure 2D shows the connectivity of pACC with the pre-SMA based on the average of the streamlines obtained from our dataset. The pre-SMA is connected to the pACC in the right hemisphere in 12 of 15 of our subjects and in 3 of 4 of HCP subjects and in left hemisphere in 9 of 15 of our subjects and in 3 of 4 of HCP subjects.
Figure 3 shows the connectivity of FO with the pre-SMA and the M1 and with TPv, based on the average of the streamlines obtained from our dataset. The pre-SMA and the FO are connected in both hemispheres of all subjects from both our and HCP dataset. In addition, the FO is connected to the mouth/face region of the M1 in the left hemisphere of 14 of 15 of our subjects and in 2 of 4 of HCP subjects and in the right hemisphere of 11 of 15 of our subjects and in 3 of 4 of HCP subjects. In the left hemisphere of 12 of 15 of our subjects and in 3 of 4 of HCP subjects the FO is connected to the TPv; this connection is less consistent in the right hemisphere of our dataset, in which is present in only 5 of the 15 of our subjects and in 4 of 4 of HCP subjects. It is noteworthy that the subjects from our dataset are all right-handers while this information is not available from HCP dataset. Thus, it is possible that the strong lateralization observed in our dataset is related to the selection of subjects with right-hand preference, in line with the notion that the left arcuate fasciculus extends to the rostral part of the temporal cortex especially in the right-handed subjects (Catani and Bambini 2014).
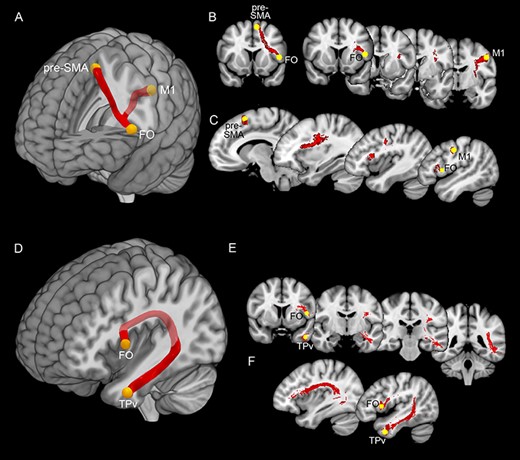
Upper part: white matter tracts connecting pre-SMA, FO, and M1. Lower part: white matter tracts connecting FO and TPv. Panels (A) and (D) showed the averaged white matter tracts connecting the pre-SMA, FO, and M1 and those connecting FO and TPv in a mesial view of 3D reconstructions. Panels (B) and (E) showed white matter tracts connecting pre-SMA, FO, and M1 and those connecting FO and TPv in a series of coronal sections ordered from rostral to caudal. Panels (C) and (F) showed white matter tracts connecting pre-SMA, FO, and M1 and those connecting FO and TPv in a series of parasagittal sections ordered from mesial to lateral.
Connectivity Fingerprint
Figure 4 shows the connectivity fingerprint of the observed connections defined as the streamlines that are present in at least the 60% of the voxel in all the subjects examined (see also Table 2). Despite the lower number of subjects examined in the HCP dataset no qualitatively differences were observed in the two datasets, with the only exception of the connectivity of FO with TPv in the right hemisphere (see above). At the “quantitative” level, it is noteworthy that the connectivity of pACC with TPv appeared even more reliable in the HCP dataset respect to our one, likely because, being this path long and devious, it is better traced using acquisition with smaller voxel size.
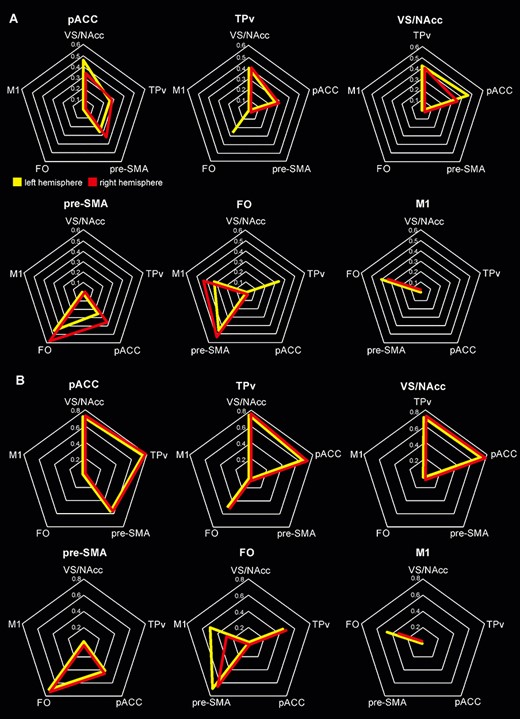
Connectivity fingerprint of each area studied, expressed via radar graphs in six individual maps for each dataset. In A and B, the averaged streamlines obtained from the subjects of our and HCP dataset, respectively. Only the tracts in which at least half of the subjects have consistent connections were shown, the left and right hemispheres were shown in yellow and red, respectively.
This analysis showed that VS/NAcc shows very robust connections with both pACC and TPv, which are also connected one with another. It is important to note that pACC and VS/NAcc did not show any connections with FO and M1, which, in contrast, are consistently connected one with another. The FO also showed very robust connections with pre-SMA that, in turn, is connected, although in a less consistent way, with pACC.
Analysis of the Observed Pathways
Our previous analysis allowed us to identify two different networks. The first consisted of pACC, VS/NAcc, and TPv, which are reciprocally interconnected, while the second one consisted of pre-SMA, FO, and M1, in which pre-SMA and M1 are connected only indirectly, throughout FO. To assess whether the observed white matter tracts go across all the seeds of each network, we tracked them by connecting the three seeds altogether with an “and” operator using the VS/NAcc and FO as waypoints, respectively. This analysis showed that the three nodes of the pACC–VS/NAcc–TPv network are connected with the same streamlines in the left hemisphere in 10 of 15 subjects of our dataset and in all HCP subjects, and in the right hemisphere in 9 of 15 subjects from our dataset and in all HCP subjects. As concerns pre-SMA–FO–M1 network, fibers passing through all the three seeds were identified only in few subjects. In particular, this was the case for 5 of 15 subjects of our dataset and in 1 of 4 subjects of HCP dataset, in the left hemisphere, and in 3 of 15 subjects of our dataset and in none of HCP dataset, in the right hemisphere. These results are in line with previous analyses showing that the pre-SMA and M1 are not directly connected in virtually all the subjects of our and HCP dataset.
The result that pACC-VS/NAcc-TPv circuit consisted of fibers which, in the majority of cases, passes throughout all the seeds composing it, supporting the hypothesis that these regions share similar functions. In contrast, the observation that the fibers connecting pre-SMA, FO, and M1 are present in only few subjects confirmed our previous data indicating that this network is constituted of two subpathways possibly involved in relatively different functions.
Identification of the White Matter Tracts
To identify to which fasciculi belong the pathways traced in the present study, we employed the white matter atlas present in the BCBToolkit software (http://toolkit.bcblab.com/;Foulon et al. 2018) and for the accumbofrontal tract the file present on the following web page: http://karlsgodtlab.org/HBM_accumbofrontal/.
The white matter tract connecting pACC and VS/NAcc overlaps with the anterior cingulate bundle (green region in Fig. 5A) up to the orbitofrontal cortex, where is replaced by a tract located adjacent to the uncinate fasciculus (blue region in Fig. 5A) and likely corresponding to the accumbofrontal bundle (Rigoard et al. 2011; Pascalau et al. 2018), recently also described as amygdalofugal pathway (Folloni et al. 2019). The white matter tract connecting the VS/NAcc with the TPv largely corresponds to the uncinate fasciculus (blue region in Fig. 5A). The white matter tract connecting pACC and TPv largely overlaps with the above described ones, thus involving the anterior cingulate bundle up to the end of the cingulate sulcus (green region in Fig. 5A) and then reaching the TPv throughout, firstly, the accumbofrontal bundle/amygdalofugal pathway and, then, to the uncinate fasciculus (blue region in Fig. 5A). The white matter tract connecting pACC and the pre-SMA corresponds to the middle part of the anterior cingulate bundle and to the frontal aslant tract (green and aquamarine region, respectively, in Fig 5A). Concerning the connections between the pACC and pre-SMA, it is noteworthy that it was recently described a novel bilateral fiber tract in the frontal region, the superoanterior fasciculus, having similar shape to the anterior part of the cingulum bundle and characterized by several U-shapes (David et al. 2019). Albeit unavailable in the atlas we used in the present study, the path of this tract is very similar to the one we traced between pACC and pre-SMA. Accordingly, we do not exclude that the connection here found correspond to this novel fascicle. The white matter tract connecting the pre-SMA and FO corresponds to the frontal aslant tract (aquamarine region in Fig. 5B). The white matter tract connecting the FO with M1 face/mouth field appears to largely overlap with the arcuate fasciculus (brown region in Fig. 5C). The white matter tract connecting the FO and TPv in the left hemisphere basically corresponds to the arcuate fasciculus up to the posterior part of the temporal lobe, to the inferior frontal occipital fasciculus in its middle part, and to the uncinate fasciculus in its anterior part (brown, pink, and blue regions, respectively, in Fig. 5D).
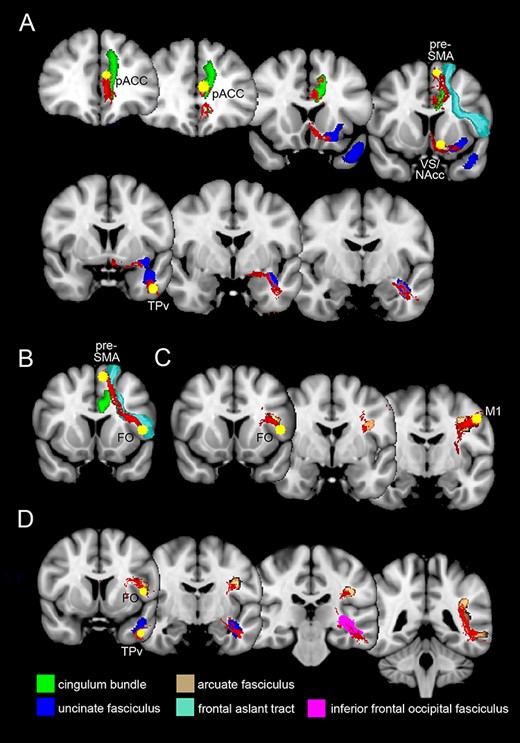
Overlapping of white matter tracts of the present study (in red) with those available from the atlas of the BCBToolkit software (Foulon et al. 2018), showed in a series of coronal sections. (A) Overlapping of the white matter tracts connecting pACC, VS/NAcc, TPv, and pre-SMA with the anterior cingulate bundle, the uncinate fasciculus, and the frontal aslant tract. (B) Overlapping of the white matter tract connecting the pre-SMA and FO with the frontal aslant tract. (C) Overlapping of the white matter tracts connecting FO and M1 with the arcuate fasciculus. (D) Overlapping between the white matter tracts connecting FO and TPv with the arcuate, inferior frontal occipital, and the uncinate fasciculus.
Descending Pathways
To describe how the cerebral territories reach the brainstem motor nuclei for controlling and producing laughter, two additional seeds were placed. One seed was placed in a region including the hypothalamus and the adjacent origin of the mamillo-tegmental tract. The other seed was placed at the level of the brainstem facial and trigeminal motor nuclei (Fig. 6A).

Descending projections of the pACC, VS/NAcc, TPv, FO, pre-SMA, and M1. (A) Coronal sections showing the location of the seeds in the hypothalamus/mamillo-tegmental tract and of the brainstem motor nuclei. (B) The averaged white matter tracts projecting to hypothalamus/mamillo-tegmental tract from the pACC, VS/NAcc, and TPv. (C) The averaged white matter tracts projecting to the brainstem motor nuclei, via internal capsule, to the pre-SMA, FO, and M1.
We traced two main descending pathways, involving especially the mamillo-tegmental tract and the internal capsule, respectively. In particular, pACC, the VS/NAcc, and the TPv project to the brainstem through, firstly, a medial bundle apparently corresponds to the accumbofrontal bundle/amygdalofugal pathway and, once reached the hypothalamus territory, the mamillo-tegmental tract (Fig. 6B). In contrast, the pre-SMA, the FO, and the primary motor cortex reach the brainstem throughout the internal capsule (Fig. 6C).
Note that, for tracing the white matter tracts located at subcortical level specific acquisition protocol are needed; nevertheless, the reliability of our results is supported by the similarity of the descending pathways here observed with those described in previous human studies (Beckmann et al. 2009; Rigoard et al. 2011, Vergani et al. 2014, 2016; Pascalau et al. 2018; Folloni et al. 2019) as well as with those found in monkeys studies by using neural-tracers. Indeed in monkeys, the M1 and the FO, and to a lesser extent the pre-SMA, project directly to the brainstem facial motor nuclei, throughout the internal capsule (Simonyan and Jürgens 2003; Morecraft et al. 2014; Holstege and Subramanian 2016) whereas pACC, TPv, and VS/NAcc appear to be connected to the brainstem mainly indirectly throughout the hypothalamus and the mamillo-tegmental tract (Veazey et al. 1982; Ongür et al. 1998; Holstege and Subramanian 2016).
Discussion
The aim of the present study was to describe the networks sustaining the production of laughter. We performed a multifiber tractography study on healthy subjects by locating seeds in all the cortical (pACC, FO, TPv, and pre-SMA) and subcortical (VS/NAcc) loci whose electrical stimulation produces laughter. Additional loci were placed in the primary motor cortex (M1), and in two subcortical sites (Hyp/MTt and brainstem motor nuclei), in order to trace the descending pathways. Results provided evidence for the existence of two relatively distinct cortical circuits (Fig. 7). The first circuit is constituted by pACC, TPv, and VS/NAcc, reciprocally interconnected through the anterior cingulate bundle and the uncinate fasciculus, and reaching the brainstem motor nuclei via the Hyp/MTt. The second network consists of FO and M1, both projecting to the brainstem facial motor nuclei through the internal capsule. The contact point between the two networks is the pre-SMA, which is connected to both pACC and FO. Here below we discuss our findings, suggesting that the two networks sustain the affiliative and the communicative/voluntary functions of laughter, respectively, with pre-SMA likely modulating the production of both types of laughter. Finally, a comparison between human and monkey connectivity will allows us to make some evolutionary considerations on the different functions of laughter.
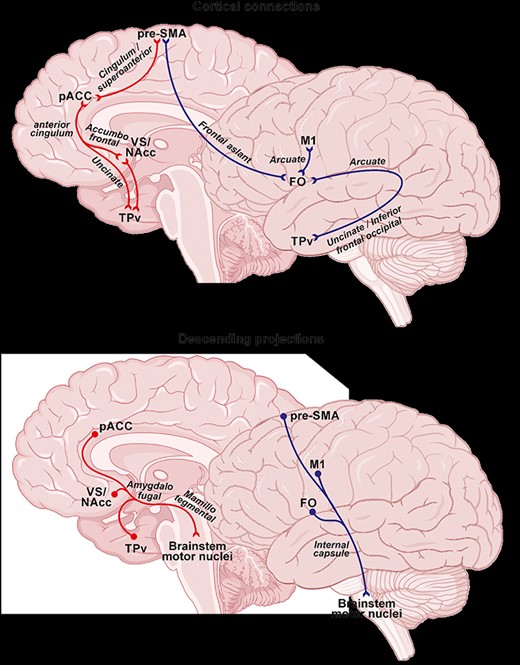
Cortico-cortical connections, upper part, and descending projections, lower part, of the laughter networks. The red and blue arrows indicate the emotional and nonemotional network, respectively. The thick arrow indicates that this white matter was found only in the left hemisphere. Note that for each region only the connections here described were indicated.
A Network for Emotional Laughter
An important finding of our study is the demonstration that, pACC, VS/NAcc, and TPv, are strongly connected to each other through the anterior cingulate bundle, the accumbofrontal bundle/amygdalofugal pathway, and the uncinate fasciculus. This network projects to the brainstem via amygdalofugal pathway and the Hyp/MTt and is not connected to FO and M1. Its connections with pre-SMA are limited to the pACC. This network is present in both hemispheres. The pACC, VS/NAcc, and TPv network is involved in the production of emotional laughter, along with the positive mood that typically accompany it. This interpretation is supported by findings showing that these areas are involved not only in laughter production but also in autonomic responses, reward, and socio-emotional regulation (see below).
The role of pACC in the production and the regulation of social behavior is well established in the literature (Devinsky et al. 1995; Hornak et al. 2003; Apps et al. 2016). Voxel-based morphometry suggests that trait-like subjective happiness correlates with gray matter density of the anterior cingulate cortex and that metabolic activity in this region increases during happy feelings induced by imagining positive events (Matsunaga et al. 2016). Other studies showed that pACC contributes to the experience of positive affects mediated by a variety of conditions, including humor and pleasant touch (Watson et al. 2007; Lindgren et al. 2012; Meletti et al. 2015). Finally, our group demonstrated that half of the pACC stimulations eliciting laughter are accompanied by mirth (Caruana et al. 2015) and that the stimulation of the surrounding region elicits interoceptive sensations and autonomic responses (Caruana et al. 2018). Strikingly, pACC is also activated by the observation of other’s individual laughing, in particular when the stimuli are presented in a dynamic fashion (Caruana et al. 2017, 2020; Rymarczyk et al. 2018).
The VS/NAcc is classically considered as a reward-processing region (Haber and Knutson 2010; Humphries and Prescott 2010; Panksepp 2011; Pauli et al. 2016). It is the classical target structure for deep brain stimulation treatment in many psychiatric disorders including OCD (Kohl et al. 2014). In these patients, the electrical stimulation of the VS/NAcc induces both smiling and laughter as well as a positive mood subjectively described in terms of clear-mindedness, relax, decreased anxiety, happiness, and euphoria (Okun et al. 2004; Gibson et al. 2016). Furthermore, the VS/NAcc is activated in narcolepsy patients during the cataplexy elicited by the view of humorous stimuli (Meletti et al. 2015).
Our finding that the pACC and the VS/NAcc are connected one to another mainly through the anterior cingulate bundle is in line with recent evidence that positive affect and anxiolysis can be enhanced by the stimulation of this bundle, not only when the patient is at rest but also during the recall of sad events (Bijanki et al. 2019).
Albeit the function of the anterior-most portion of the temporal lobe is still not well understood, this region is deemed to control socio-emotional processing (Olson et al. 2007). The contribution of this territory to these processing is supported by neuropsychological studies on temporal lesions, demonstrating that patients with atrophy or degeneration of the temporal pole show changes in socio-emotional behavior, decrease of empathy, and increased interpersonal coldness (Perry et al. 2001; Gorno-Tempini et al. 2004; Rankin et al. 2006). Mirthful laughter has been reported in a series of stimulation studies in epileptic patients (Arroyo et al. 1993; Satow et al. 2003; Yamao et al. 2015; Caruana et al. 2020). Of note, in the study conducted by Yamao and coworkers, TPv stimulation elicited only mirth at a low intensity and short duration, and laughter at a higher intensity and longer duration.
Our finding that TPv is connected with the VS/NAcc and the pACC through the uncinate fasciculus is in line with the recent hypothesis that this bundle is crucial to create associations between social stimuli, including name, face, and voice, and the feelings about the person with which one interacts (Von Der Heide et al. 2013), like when we laugh with someone.
Summing up, the data reviewed above indicate that the pACC–VS/NAcc–TPv network represents the neural basis for emotional laughter, aimed at establishing social bonding, down-regulating anxiety, and easing social tension (Strean 2009; Dunbar 2012; Caruana 2017; Manninen et al. 2017). This network subserves not only laughter production but also its observation (Caruana et al. 2017, 2020), as well as emotion regulation and the establishment of emotional memories (Olson et al. 2007; Etkin et al. 2011, 2015).
A Network for Voluntary and Conversational Laughter
It has been emphasized by several authors that laughter is not necessarily associated to mirth and merriment. Indeed, it is often employed in nonemotional contexts as a strategic tool for communicative and social purposes (e.g., Scott et al. 2014; Provine 2016; Wood and Niedenthal 2018). In agreement with this view, the second network here described, encompassing FO and M1 and reaching the brainstem nuclei via the internal capsule, appears more involved in the strategic use of laughter, rather than in its emotional counterpart.
Laughter has been reported following FO stimulation in three studies (Fernández-Baca Vaca et al. 2011; Caruana et al. 2016; Caruana et al. 2020). Albeit FO stimulation occasionally might elicit a sense of mirth and merriment (Fernández-Baca Vaca et al. 2011), the presence of a clear, positive, emotional content was rare. Compared with laughter elicited by the stimulation of pACC and TPv, laughter induced by FO stimulation is more often accompanied by speech impairments and sensations at the orofacial level (Caruana et al. 2020). Most importantly, a recent stimulation study reporting the results of stimulation in 252 sites from a group of 31 patients (Mălîia et al. 2018) showed that the most frequent effects evoked by FO stimulation are speech-related or oropharyngeal sensations. Finally, the hypothesis that the FO plays a key role in the voluntary control of facial expressions is supported by brain imaging (Leslie et al. 2004; van der Gaag et al. 2007; Lee et al. 2008; Wattendorf et al. 2013) and clinical (Salas et al. 2016) studies as well as by electrophysiology investigation of the homolog region of FO in the monkey (Coudé et al. 2011; Ferrari et al. 2017).
The vicinity of the FO with the language centers and its connectivity suggest that this area may play a role in the conversational aspects of laughter, which appears automatically during social interactions to better convey the communicative intents of the speaker. This aspect of laughter has been highlighted by many authors (see Scott et al. 2014; Wood and Niedenthal 2018) and extensively studied by Provine (2000, 2004, 2016), who concluded that the placement of laughter in speech is akin to punctuation in a written text. In line with our interpretation, Provine (2012) dubbed this type of laughter as “laughspeak,” that is “a kind of laugh/speech hybrid that is under more conscious control […] and is often used by people to defuse a sensitive point”. In line with this interpretation, our finding showed that FO is more robustly connected with the TPv in the left hemisphere and in particular through three bundles crucial for communication: the arcuate, the inferior frontal occipital and the uncinate fasciculi. Note that, while the role of the arcuate fascicle during the perception and the production of language is well-established (see Catani and Bambini 2014), lesions studies indicated that also the inferior frontal occipital and the uncinate fasciculi has a crucial role in at least two language-related functions important also during the conversational laughter: the semantic processing and the auditory working memory/sound recognition (Papagno et al. 2011; Dick and Tremblay 2012; Almairac et al. 2015; Papagno et al. 2016).
The presence of two distinct pathways, one for emotional and one for voluntary laughter, fits well the classical distinction between volitional and emotional paresis of the facial nerve (see Lauterbach et al. 2013; Cattaneo and Pavesi 2014). The volitional facial paresis, easily demonstrated during clinical testing of facial nerve movements, disappears when a patient is told a joke. In contrast the emotional paresis can be unmasked exclusively by laughter triggered by an emotion, such as when a patient is told something funny.
The deficit in the production of voluntary laughter follows the damage of motor areas and of FO, whose lesion also affects lingual muscles (Crumley 1979; Hopf et al. 1992). Our data, showing that the FO and M1 are interconnected and that both project to the brainstem motor nuclei throughout the internal capsule, are in line with these clinical observations, indicating that these two cortical regions and their descending projections form a network for the control of voluntary laughter.
The Pre-SMA and the Modulation/Inhibition of Laughter Production
In the current study, we found that pre-SMA is connected to both pACC and FO, which we interpreted as contributing to emotional and nonemotional laughter, respectively. The lack of direct connections with VS/NAcc and TPv, two emotional nodes, along with the evidence that pre-SMA reaches the brainstem nuclei through the internal capsule—similar to FO and M1—and its involvement during voluntarily mouth/face motor control (Errante et al. 2019) suggest that pre-SMA is not part of the emotional network. This consideration raises the intriguing question why pre-SMA and pACC, a core center of the emotional network, are connected. On the basis of the existing literature, we argue that pre-SMA may play a role in voluntarily modulating/inhibiting the production of laughter, acting at the interface between the two networks.
Classic studies in primates highlighted the crucial role of pre-SMA in preparing, initiating, and inhibiting intended actions (Alexander and Crutcher 1990; Rizzolatti et al. 1990; Matsuzaka et al. 1992), also modulating motor commands on the basis of contextual cues (Livi et al. 2019; Albertini et al. 2020). Indeed, single neuron recordings showed that pre-SMA neurons present different combinations of facilitation and inhibition (Rizzolatti et al. 1996). These data suggest that the main role of this area is to control whether and when an action can be executed (Rizzolatti et al. 1996; see also Nachev et al. 2008).
The role of pre-SMA in action control is also supported by human fMRI (Hikosaka et al. 1999) and clinical data. Damage to the pre-SMA produces a series of negative neurological symptoms including akinesia, arrest of speech, reduction of spontaneous motor activity, and facial palsy (Laplane et al. 1977; Nachev et al. 2007; Roberts and Husain 2015; see also Rizzolatti and Luppino 2001). These findings are congruent with brain imaging data showing that akinetic parkinsonian patients have hypoactivation of pre-SMA during execution of hand motor tasks (Sabatini et al. 2000). Imaging and TMS studies also showed that pre-SMA contributes to switch from automatic to voluntary action, and to inhibit or alter a prepotent response (Picard and Strick 1996; Ullsperger and Von Cramon 2001; Curtis and D’Esposito 2003; Nachev et al. 2007; Obeso et al. 2013).
The modulatory effect of the pre-SMA in controlling the emotional and nonemotional laughter is in line with electrical stimulation and lesion studies of the white matter tract connecting this area with pACC and FO. In particular, as concerns emotional laughter, the stimulation of the cingulate bundle at the level in which it connects pre-SMA and pACC elicited mirth and laughter associated with awareness of an internal experience of elevated mood (Bijanki et al. 2019). As concerns nonemotional laughter, the pre-SMA and FO are strongly connected one with another through the frontal aslant tract, a cortical bundle supporting the initiation and control of motor movements. The damage of this tract can result in Foix-Chavany-Marie syndrome, an impairment of voluntary control of certain facial and pharyngeal movements (e.g., laughing, coughing; Martino et al. 2012; Chernoff et al. 2019) and its stimulation provokes alteration of speech, a motor behavior sharing many motor structures with laughter (Corrivetti et al. 2019).
Since the time of Wilson (1924), there is evidence that the emotional centers are inhibited by the volitional motor pathways, and that damage to these pathways “liberates” emotional behaviors, including laughing. Modern view suggests that volitional pathway inhibits the emotional pathway mostly subcortically (see Lauterbach et al. 2013). Our results extend this view, showing that emotional and nonemotional networks interact not only at the subcortical level but also at the cortical one. In particular, we suggest that, on the basis of the peculiar anatomical position and of the aforementioned functional properties, pre-SMA contributes to regulate the production of laughter in relation to the context, that is, by releasing or inhibiting laughter based on what is subjectively perceived as convenient in a given situation. In accord to this view, Krolak-Salmon et al. (2006) reported that the electrical stimulation of pre-SMA elicited smile and laughter that sounded natural and contextually appropriate for the subject.
Further Evidence for Functional Distinctions Between the Two Networks
The anatomical distinction in two circuits here observed is also reflected in their contribution to social cognition. The emotional network, and the pACC in particular, is recruited when observing other’s laughter, also in the absence of “explicit recognition” tasks—and preferentially when stimuli are dynamic (Caruana et al. 2020; 2017; Rymarczyk et al. 2018a, 2018b; Pillay et al. 2007). There is evidence that disrupting either pre-SMA or FO impairs the recognition of other happiness during tasks requiring an explicit recognition of emotional displays (Rochas et al. 2013; Paracampo et al. 2017). Of note, the explicit recognition of emotions, including happiness, is also impaired by blocking facial mimicry at the motor level (Borgomaneri et al. 2020; Ponari et al. 2012; Stel and van Knippenberg 2008; Oberman et al. 2007). Thus, it is tempting to speculate that the emotional network is involved in “emotional contagion” through observation which, in turn, is crucial for establishing social bonding and affiliation (Palagi et al. 2020). In contrast, the frontal motor areas, including the pre-SMA, are likely involved in recognition tasks through a “voluntary” motor simulation of the observed expression (Niedenthal et al. 2010).
A Comparison with Tract-Tracing Monkey Studies
While tractography represents a reliable technique to identify the tracts connecting distant regions in humans, yet the golden standard technique to understand whether two regions are connected to each other is the neural tract-tracing technique used in non-primate models. Thus, a useful approach to complement and reinforce the reliability of human data is to compare them with the available neural tract-tracing data of the connectivity of the homologous brain territories of the monkeys. The tractography connectivity here described is largely in agreement with the connectional architecture previously described in the homologous macaque monkey’s brain regions. Note that differences between monkey and human connectivity allow one to make some interesting evolutionary considerations.
The emotional circuit we traced here in humans appears to be largely present in monkeys. Indeed, the Macaque homolog of pACC, whose stimulation evokes affective vocal calls (Jürgens 2009), is connected, as in humans, with the TPv (Morecraft et al. 2012) and the pre-SMA (Luppino et al. 1993; Morecraft et al. 2012; Albertini et al. 2020). Furthermore, in the Macaque, both the pACC and the TPv directly project to the VS/NAcc (Choi et al. 2017), suggesting that the pACC–TPv–VS/NAcc emotional network is an evolutionary old circuit, basically conserved among primates (a similar network in both species was described also in Dum et al. 2019). These data are in line with the hypothesis that emotional laughter is a peculiar strategy developed in humans to serve an evolutionary ancient goal, that is, to create affiliation and social bonding within a group (Dunbar 2012). In addition, in agreement with our tractography study, the pACC, TPv, and the VS/NAcc of the Macaque are very poorly connected or not connected at all to the main nodes of the nonemotional network, that is FO and M1 (Gerbella, Borra, Mangiaracina, et al. 2016a; Gerbella, Borra, Rozzi, et al. 2016b; Ferrari et al. 2017).
In contrast to the emotional network, the nonemotional one shows significant differences in humans relative to monkeys. First, in the monkey the FO and the TPv have negligible connections (Gerbella, Borra, Rozzi, et al. 2016b). This evidence marks a difference between monkeys and humans, as in the present study we found mostly in the left hemisphere connections between FO and TPv, which we interpreted in the light of the language-related functions of conversational laughter. Such difference between monkeys and humans is in line with the notion that the arcuate fascicle has developed mainly in our species for language-based communication (Thiebaut de Schotten et al. 2012; Catani and Bambini 2014; Eichert et al. 2019) and with recent structural cross-species comparison, suggesting that from monkey to human the white matter expanded from more conserved limbic cortical and subcortical areas to later include more developed associative networks for higher cognitive functions (Croxson et al. 2018).
Another difference between human FO and the monkey homologous region concerns its connections with the pre-SMA and M1. Indeed, in the monkey, pre-SMA and M1 project to two distinct and nonoverlapping sectors of FO. The rostral part of the FO (macaque area GrFO) is connected to the pre-SMA (Luppino et al. 1993; Gerbella, Borra, Rozzi, et al. 2016b; Ferrari et al. 2017; Albertini et al. 2020) while only its caudalmost part (macaque area DO) to a face/mouth region neighboring between the caudal premotor cortex and M1 (Gerbella et al. 2011; Gerbella, Borra, Rozzi, et al. 2016b; Ferrari et al. 2017). Albeit a possible explanation can be related to the higher resolution of neural tract-tracing technique, an intriguing, but most likely alternative is that such difference could be due to the phylogenetic development of the arcuate in our species for linguistic communication, as showed by Thiebaut de Schotten and collegues (2012) and Catani and Bambini (2014). To support this interpretation, Papinutto et al. (2016), using a high angular resolution diffusion imaging acquisition, showed that also the left inferior frontal gyrus, and not the right, is connected to the anterior temporal pole through the arcuate, the inferior frontal occipital and the uncinate fasciculus (Papinutto et al. 2016).
In conclusion, albeit the comparison between human and monkey connectivity should be taken with a grain of salt, nevertheless it is tempting to speculate that the emotional network—involving pACC, VS/NAcc, and TPv—is largely present in the monkey, possibly for implementing behaviors aimed at establishing social-bonding and affiliative purposes in both species. In contrast, the nonemotional network—anchored to the FO and M1—appears to be peculiar human network, contributing to the strategic use of laughter in conversation and linguistic communication.
Notes
We thank Luca Fornia for his valuable comments on an early version of the manuscript. Conflict of Interest: None declared.
Funding
Fondazione Cariparma (to G.R.).
References
Author notes
M. Gerbella and C. Pinardi have contributed equally to this work