


Abstract
Decades of electrophysiological research on top–down control converge on the role of the lateral frontal cortex in facilitating attention to behaviorally relevant external inputs. However, the involvement of frontal cortex in the top–down control of attention directed to the external versus internal environment remains poorly understood. To address this, we recorded intracranial electrocorticography while subjects directed their attention externally to tones and responded to infrequent target tones, or internally to their own thoughts while ignoring the tones. Our analyses focused on frontal and temporal cortices. We first computed the target effect, as indexed by the difference in high frequency activity (70–150 Hz) between target and standard tones. Importantly, we then compared the target effect between external and internal attention, reflecting a top–down attentional effect elicited by task demands, in each region of interest. Both frontal and temporal cortices showed target effects during external and internal attention, suggesting this effect is present irrespective of attention states. However, only the frontal cortex showed an enhanced target effect during external relative to internal attention. These findings provide electrophysiological evidence for top–down attentional modulation in the lateral frontal cortex, revealing preferential engagement with external attention.
Humans often attend internally to engage in a train of thoughts. Although this internal state can occupy up to half of our awake hours, dominant accounts of top–down attentional control implicating the frontal cortex have traditionally focused on attention to behaviorally relevant stimulus in the external environment (Hopfinger et al. 2000; Corbetta and Shulman 2002; Buschman and Miller 2007; Bressler et al. 2008). In particular, the prefrontal cortex has long been shown to modulate sensory responses in favor of selectively attended features in our surrounding environment (Zanto et al. 2011; Gregoriou et al. 2014; Bidet-Caulet et al. 2015). Less is known concerning the involvement of lateral frontal cortex in the top–down control of external attention (EA) versus internal attention (IA).
Scalp electrocorticography (EEG) evidence documented several changes in the magnitude of stimulus-evoked activity, including event-related potential components and theta power, during IA compared to EA. In previous studies wherein attention was not experimentally manipulated, IA dampened the sensory response in both the visual and auditory modalities (Braboszcz and Delorme 2011; Kam et al. 2011; Xu et al. 2018), and disrupts target detection capacity as indexed by scalp EEG measures (Smallwood et al. 2008; O’Connell et al. 2009; Baird et al. 2014). These results collectively suggest that in tasks where attention was allowed to naturally vacillate between EA and IA, IA reduced the magnitude of stimulus-evoked responses (Schooler et al. 2011; Kam and Handy 2013). In contrast, in tasks that experimentally manipulated attention states, IA reduced cognitive but not sensory level response (Kam et al. 2018a). While these past studies have focused on low-frequency activity, higher frequency activity (HFA: 70–200 Hz) is more suited to index cortical activity of local neuronal populations (Mukamel et al. 2005a; Miller 2010; Ray and Maunsell 2011; Rich and Wallis 2017). Accordingly, we examined how this attentional modulation is electrophysiologically manifested via HFA in the frontal cortex.
This study aimed to delineate the spatiotemporal characteristics of neural activity in lateral frontal and temporal cortices during attention directed to the external or internal environment using intracranial electroencephalography (iEEG). We obtained iEEG recordings from neurosurgical subjects to address this question, as this method offers simultaneous recording from distributed regions with subcentimeter spatial resolution, millisecond temporal resolution, and high signal-to-noise ratio. Importantly, iEEG provides access to HFA, which is linked to the BOLD signal of functional magnetic resonance imaging (fMRI) (Logothetis et al. 2001; Nir et al. 2007; Hermes et al. 2012), as well as neuronal firing rate (Mukamel et al. 2005; Miller 2010; Ray and Maunsell 2011; Rich and Wallis 2017), providing a powerful tool to assess the magnitude and timing of local neuronal population response during EA and IA.
We recorded iEEG from subjects as they performed an auditory target detection task that required them to direct their attention either to the external or internal environment. Subjects were included based on their electrode coverage in relevant regions, including the lateral frontal cortex given its well-known role in top–down attentional control (Corbetta and Shulman 2002), as well as the temporal cortex given its role in auditory processing and deviance detection (Näätänen et al. 2007). We established the target effect using HFA and compared the target effect between EA and IA for each cortical region.
We hypothesized that both the frontal and temporal cortices would show target effects. We further predicted that the frontal cortex would show attentional modulations for two reasons. First, the frontal cortex plays an important role in top–down processes such as control of selective attention (Barceló et al. 2000; Hopfinger et al. 2000; Corbetta and Shulman 2002). Given our experimental design required the instantiation of EA and IA focus, the frontal cortex would presumably be more engaged when exerting top–down influence of these task demands. Second, neuroimaging and lesions studies have shown that the frontal cortex is involved in modulating external and IA (Stern et al. 2015; Kam et al. 2018b). Therefore, when comparing between attention states, we predicted that only the frontal cortex would elicit a larger target effect for EA relative to IA.
Methods
Subjects
Intracranial EEG (iEEG) recordings were obtained from 12 subjects (mean age = 36.4 years, age range = 18–69; 5 females; 10 right-handed) undergoing presurgical monitoring for intractable epilepsy. There is considerable overlap in the subjects between the current study and an earlier study, which also employed the same attention task (Kam et al. 2019). Supplementary Table 1 presents clinical and demographic information for each subject. Subjects were implanted with electrodes to localize the seizure onset zone for subsequent surgical resection. These electrodes included 12, 24, or 64-channel grids or 4 channel strips of subdural electrodes (with 1 cm spacing) placed on the cortical surface over lateral frontal or temporal cortex, as well as 8–12 channel tracts of depth electrodes (with 5 mm spacing) covering extensive portions of lateral frontal and temporal cortex. The placement of these electrodes was solely based on clinical needs. Patients were recruited from the University of California, Irvine, California Pacific Medical Center Hospital and the Oslo University Hospital. All patients provided written informed consent as part of the research protocol approved by the Institutional Review Board at each hospital.
Target Detection Task
Subjects performed an auditory target detection task, consisting of high probability standard tones (P = 0.8, 800 Hz) and low probability target tones (P = 0.2, 1000 Hz) presented in randomized order. All stimuli were pure tones presented through stereo speakers at a comfortable hearing level. Each tone lasted 200 ms, and the inter-trial interval was randomly jittered between 800–1200 ms. Subjects were asked to fixate their eyes on the cross in the center of the screen during each block of trials. Figure 1A illustrates the experimental paradigm.
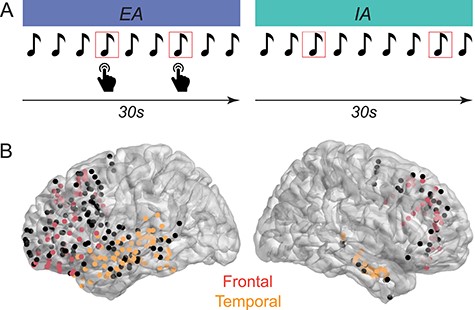
Experimental task and electrode locations. A) Subjects performed a target detection task, in which they were instructed to direct their attention externally (EA) and respond to target tones (shown in red square outline), or direct their attention internally (IA) toward their own thoughts and ignore the tones. B) Implanted electrodes across all subjects in the lateral frontal and temporal cortices shown on a Montreal Neurological Institute template brain, in lateral perspectives. Responsive electrodes included in the analyses in the frontal cortex are shown in red. Responsive electrodes included in the analyses in the temporal cortex are shown in orange. Electrodes shown in black were nonresponsive electrodes that were excluded from analyses (as described in Methods). The saturation of electrode colors reflects the location of electrodes along the gyrus (brighter) and sulcus (less bright) surfaces.
To inform subjects of the upcoming condition, they were visually presented with “External Attention” or “Internal Attention” on the computer monitor prior to starting the EA or IA block, respectively. In the EA condition, subjects were instructed to focus their attention on the tones throughout the entire block and press a key when they heard a target tone as quickly and accurately as possible. Mean accuracy measures, including hit rate and correct rejection rate, were computed. In the IA condition, they were instructed to ignore the tones and focus their attention on any thoughts that come to mind throughout the block. In other words, the stimulus set is identical across both conditions, with the exception that attention is directed externally requiring a button press for target tones in the EA condition whereas attention is directed internally in the IA condition with no requirement of a button press. This task was successfully used in past studies to elicit sustained periods of EA and IA (Kam et al. 2018b, 2019).
Each block lasted 60 s, and began with 25 tones in the EA condition (lasting 30 s) followed by 25 tones in the IA condition (lasting 30 s), or vice versa. The order of these two conditions was counterbalanced within subjects. Subjects completed up to 28 blocks of EA and IA conditions (mean = 20.92, standard deviation [SD] = 3.33), consisting of a maximum of 280 standard and 70 target tones in each condition. Stimuli presentation was operated by Eprime 2.0 (Psychology Software Tools, Inc., USA).
Control Measures: Behavior and Attention Ratings
To ensure subjects were attending to the tones in the EA condition and ignoring the tones in the IA condition, we assessed several measures. We first examined their accuracy to confirm that they were attending to the tones and responding to target tones during the EA condition. Since the IA condition did not require behavioral responses, subjects were asked to rate how frequently they attended to their own thoughts immediately after each block on a Likert scale that ranged from 1 = not at all, to 5 = all the time.
Electrode Localization
The anatomical location of these electrodes was determined by the coregistration of preoperative or postoperative structural magnetic resonance imaging (MRI) scan with postimplantation computed tomography (CT) imaging, using an electrode localization pipeline within the Fieldtrip toolbox (Stolk et al. 2018). For six subjects, both pre and postoperative structural MRI scans were available, in which case the CT image was coregistered to the postoperative structural MRI scan. Electrodes were visualized in the native space using the iElectrodes toolbox (Blenkmann et al. 2017). They were categorized as frontal and temporal electrodes based on their coordinates according to the Destrieux Atlas (Destrieux et al. 2010), and confirmed by visual inspection by a neurologist. Electrode locations were transformed into Montreal Neurological Institute space across subjects and presented on a template brain in Figure 1B.
Intracranial EEG Preprocessing
Data Acquisition
Electrophysiological data were recorded at the University of California, Irvine at 5000 Hz digitization and at the California Pacific Medical Center Hospital at 1000 Hz digitization using a 128/256-channel Nihon Kohden recording system (Nihon Kohden Corporation) and at the Oslo University Hospital at 1024 Hz digitization, using a Nicolet C64 recording system (Natus Medical Incorporated).
Data Preprocessing
A neurologist manually inspected all EEG channels to identify those with interictal epileptiform activity and artifacts. Electrodes that contained epileptic activity or other types of artifacts were excluded from further analyses. Further, electrodes that showed poor contact, line noise interference, or excessive noise throughout the recording were also excluded. Raw, continuous data were subsequently down-sampled to 1000 Hz, low-pass filtered at 160 Hz, and notch-filtered at 60 Hz (for Irvine and Children’s Hospital) or 50 Hz (for Oslo) and their harmonics to remove line noise interference. Continuous EEG data were then segmented into 3000 ms epochs, beginning at 1000 ms prior to stimulus onset. Each trial was then visually inspected for any remaining artifacts. Trials containing artifacts, such as line noise, movement, and spread of the primary epileptic source, were further excluded from subsequent analyses. Both electrocorticographic electrodes (including grids and strips) and stereotactic electrodes were subjected to bipolar reference to an adjacent electrode. For grid electrodes, each electrode was referenced to its neighboring electrode on a row-by-row basis. All data processing and analysis was performed using custom functions, the EEGLAB toolbox (Delorme and Makeig 2004) and the Fieldtrip toolbox (Oostenveld et al. 2011) in MATLAB (Mathworks).
Electrodes within the regions of interest, including the lateral frontal and temporal cortex, were considered for subsequent analyses. For each electrode, only correct trials in the EA condition and all trials in the IA condition were included in subsequent analyses. To ensure that attentional effects in EEG measures were not simply due to differences in signal-to-noise ratio resulting from a mismatched number of trials across conditions, the number of correct trials with standard or target tones between EA and IA conditions were matched (by random sampling) within subjects.
HFA Analyses
As mentioned, HFA not only reflects neuronal firing rate (Mukamel et al. 2005; Ray and Maunsell 2011; Rich and Wallis 2017), but it also tracks the BOLD signal of fMRI (Logothetis et al. 2001; Nir et al. 2007; Hermes et al. 2012). In particular, this metric significantly correlated with the BOLD response on a trial-by-trial basis in a simultaneous recording of both types of signals. In studies that have examined HFA and the BOLD signal in the same patients, they found a parametric relationship between the magnitude of change in BOLD signal and the extent of change in HFA (Hermes et al. 2012). Moreover, intracortical recording in nonhuman primates indicates that local epicortical HFA consists of both infragranular single-unit activity and supragranular calcium dependent dendritic processes (Leszczynski et al. 2020).
Motor Electrodes
Any electrodes showing clear motor activity was excluded from further analyses. This was determined by two criteria: an electrode 1) was in the motor cortex and 2) showed a significant correlation between its HFA and reaction time. This assured that the observed conditional differences were not driven by motor responses to the targets. Only one electrode fulfilled these criteria and was excluded from subsequent analyses.
Responsive Electrodes
Electrodes were considered as “responsive” if HFA within the poststimulus window of 0–600 ms was above threshold (z = 1.96, equivalent to P < 0.05, two-tailed) for a minimum of 80 consecutive milliseconds. This duration threshold exceeds the minimum number of consecutive time points necessary for a time series to be considered as significantly different from zero (Guthrie and Buchwald 1991; Haller et al. 2018). To compute HFA, for center frequencies from 75 to 145 Hz in 10 Hz steps, data were filtered in each frequency range, after which a Hilbert transform was applied resulting in a complex-valued time series from which we extracted the analytic amplitude of HFA. These values were then averaged across all high frequency bands (70–150 Hz) for each electrode. For data normalization, a bootstrapped distribution of baseline values was created by averaging across 200 randomly chosen baseline values (from the pool of baseline time points of −250 to −50 ms for all trials) for 1000 iterations. For each epoch, the time-frequency representation was then normalized per frequency range by subtracting the mean of the baseline distribution and dividing by the standard deviation of the baseline distribution, yielding z score values. The mean HFA was computed across all artifact-free trials. Electrodes with mean HFA z scores above 1.96 sustained for over 80 ms anywhere within the time window of 0–600 ms following stimulus onset qualified as responsive electrodes (Flinker et al. 2015; Haller et al. 2018). Only responsive electrodes in the frontal and temporal cortices were included in subsequent analyses. Across hemispheres, 43% (91 of 211) of frontal electrodes were responsive, whereas 70% (121 of 174) of temporal electrodes were responsive. The locations of these electrodes are shown in Figure 1B.
Target Effect in HFA
For each responsive electrode, HFA power time course was extracted across the poststimulus interval (0–600 ms), and averaged separately for each tone type (i.e., standard and target). The HFA time series used for computing the effect size traces of the target effect as described below are shown for an exemplar electrode in Figure 2B, and averaged across electrodes in the frontal and temporal cortex in Figure 2C. The time-frequency plots of HFA are shown in Supplementary Figure 1. The target effect size traces were then submitted to statistical analyses, which we described in detail in the following section. We first established the target effect irrespective of attention states separately for frontal and temporal electrodes. This initial step provided an experimental check that target tones elicited a larger response than standard tones. Further, this step reduced dimensions in the data by yielding one time series per electrode that captures tone differences used for statistical analyses. For each electrode, we computed the effect size of the target effect using Cohen’s d at each time point to capture the difference in HFA between target and standard tones. Cohen’s d was computed using the following equation: |$({\overline{\mathrm{X}}}_1-{\overline{\mathrm{X}}}_2)$|/SDpooled, where |${\overline{\mathrm{X}}}_1$|is the mean of the first condition, and |${\overline{\mathrm{X}}}_2$|is the mean of the second condition, and SDpooled is the pooled standard deviation across both conditions. We took the absolute value of Cohen’s d in order to account for the differing amount and pattern of information (e.g., conditional differences) captured in each electrode. Across all responsive electrodes for each region, we performed a principal component analysis (PCA) on the effect size time series of the target effect in order to identify a temporally consistent pattern that accounts for the most variance within the responsive electrodes across subjects. We extracted electrodes that highly loaded onto the first principal component, and set the inclusion criteria to electrodes that reached the 75th percentile of the loadings. Figure 2A displays the locations of these electrodes. All subsequent analyses were performed on these electrodes only. These procedures are consistent with an intracranial EEG study using a similar task paradigm (c.f., Dürschmid et al. 2016; Durschmid et al. 2019).
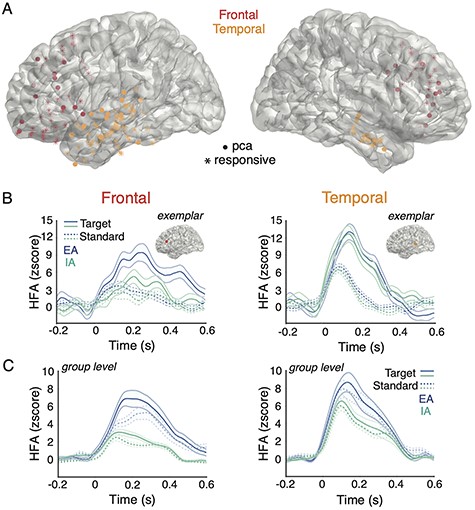
Responsive electrodes and HFA for all experimental conditions. A) Responsive electrodes recorded across all subjects are denoted by asterisks (i.e., responsive) shown on a template brain, color coded by cortical area (red = frontal, orange = temporal). Electrodes plotted in filled circles (i.e., pca) are those highly loaded onto the first principal component within each region. The saturation of electrode colors reflects the location of electrodes along the gyrus (brighter) and sulcus (less bright) surfaces. B) For both frontal cortex (left panels) and temporal cortex (right panels), the mean HFA z-score traces for target (solid line) and standard (dotted line) tones during EA (blue line) and IA (green line) are shown at the single subject level with exemplar electrodes. C) Similar to the above, mean HFA z-score traces are shown at the group level averaged across electrodes.
Regional Differences in the Target Effect
Among the electrodes that highly loaded onto the principal component from the above analyses, we first established the spatiotemporal characteristics of the target effect. In particular, we used the cluster-based permutation test to determine whether the target effect differed as a function of region (i.e., frontal and temporal cortices), and if so, depict the time course of the differences. Electrodes that belonged to the same subject were averaged together, yielding one time series per subject representing the mean target effect for that subject averaged across electrodes and each region (c.f., Helfrich et al. 2018). This approach avoids biasing the results to subjects with a higher number of electrodes. The subjects’ time series for frontal and temporal electrodes were then submitted to a cluster-based permutation test to examine for differences between regions, which were identified by means of independent samples t-tests thresholded at an alpha of 0.05. A null distribution was estimated by randomly shuffling trials 1000 times between conditions before averaging, followed by the same clustering procedure. Using the Monte Carlo method with 1000 random permutations, P-values of the observed clusters were calculated as the proportion of random partitions that yielded a larger effect than the observed experimental effect (Maris and Oostenveld 2007). This P-value of the cluster-based test approach corrects for the multiple comparisons of time points.
To further identify the subregions within frontal and temporal cortex that showed the target effect, we implemented the cluster-based permutation test at the single electrode level. For each electrode, the effect size time series of the target effect was compared to a null distribution that was estimated by randomly shuffling trials of HFA power 1000 times between standard and target tones and computing the target effect size. The P-values of the observed clusters were calculated as the proportion of random partitions that yielded a larger effect than the observed experimental effect thresholded at an alpha of 0.05. To correct for multiple testing of each electrode, we applied the false discovery rate correction on the resultant P-values (Benjamini and Hochberg 1995). We computed the percentage of electrodes within each subregion that showed significant target effects, and statistically compared the proportion of significant electrodes between regions using the z score test of proportion. In the frontal cortex, we categorized electrodes into the following subregions: superior frontal cortex, middle frontal cortex, and inferior frontal cortex. In the temporal cortex, we categorized electrodes into the following subregions: superior temporal cortex, middle temporal cortex, and inferior temporal cortex.
Further, we assessed whether the peak latency of the target effect differed as a function of region (i.e., frontal and temporal cortices). We extracted the latency corresponding to the maximum amplitude on the mean effect size time series for each electrode. To test the peak latency as a function of region across electrodes and subjects, we performed linear mixed-effects model analyses using the lmer4 package (Bates et al. 2014) in R (R Core Team, 2013). The omnibus model included region (frontal and temporal cortices) as a fixed effect. To account for shared variance in electrodes within a subject and the differing number of electrodes within a subject, subjects were considered as random effects in the model (Baayen et al. 2008). This statistical approach has been used in past studies involving intracranial EEG (Piai et al. 2016; Johnson et al. 2018). Visual inspection of residual plots did not reveal deviations from homoscedasticity or normality. The resulting P-values of the fixed effect were obtained by likelihood ratio tests (i.e., Chi square) testing the full model with the fixed effect of interest (i.e., region) against the model without them.
Attentional Modulation of the Target Effect
To address our primary question, we examined whether attention state modulated the target effect separately for each region. For this analysis, HFA power time course was averaged for each tone type (i.e., standard and target) and attention state (i.e., EA and IA), and the target effect size time series were computed separately for each attention state. Similar to the above analyses, electrodes in the same subject were averaged together, resulting in two time series per subject representing the mean target effect for EA and IA for that subject. The subjects’ time series for EA and IA were then submitted to a cluster-based permutation test to examine for differences between attention states, which were identified by means of dependent samples t-tests thresholded at an alpha of 0.05 using the Monte Carlo method with 1000 random permutations. This was performed separately for frontal and temporal electrodes. To adjust for multiple testing of the two regions, we adopted the conservative approach of Bonferroni correction and set the critical alpha to 0.05/2 = 0.025.
Similar to the above-mentioned analyses, we further identified subregions within frontal and temporal cortex that showed attentional modulation of the target effect by implementing the cluster-based permutation test at the single electrode level. For each electrode, the difference between EA and IA in the target effect size time series was compared to a null distribution that was estimated by randomly shuffling trials of HFA power 1000 times between tones separately for EA and IA and computing the attentional difference in target effect. The P-values of the observed clusters were calculated as the proportion of random partitions that yielded a larger effect than the observed experimental effect thresholded at an alpha of 0.05. To control Type I error for multiple testing of each electrode, we applied the false discovery rate correction on the resultant P-values (Benjamini and Hochberg 1995). We computed the percentage of electrodes within each subregion that showed significant attention effects, and statistically compared the proportion of significant electrodes between regions using the z score test of proportion. Frontal and temporal electrodes were categorized into subregions as mentioned above.
Further, we assessed whether the peak latency of the target effect differed as a function of attention state (i.e., EA and IA) separately for each region. Similar to the above analyses, we extracted the latency corresponding to the maximum amplitude on the mean effect size time series for each electrode. To examine peak latency as a function of attention state across electrodes and subjects, we performed linear mixed-effects model analyses, with area (frontal and temporal cortices) and attention states (EA and IA) as fixed effects and subjects as random effects in the omnibus model. Visual inspection of residual plots did not show deviations from homoscedasticity or normality. The resulting P-values of the fixed effect were obtained by likelihood ratio tests (i.e., Chi square) testing the full model with the fixed effect of interest (i.e., attention) against the model without them.
Association between Target Effect and Behavioral Measures
We examined whether the electrophysiological patterns were associated with behavioral measures or subjective ratings, using Pearson’s correlation to quantify these relationships. In particular, we extracted the mean target effect (computed between 0 and 600 ms) as our main analyses revealed attentional modulations of this effect. For the EA condition, we used accuracy as a proxy for attention directed to the external environment, whereas for the IA condition, we used the attention ratings (ranging from 1 to 5) at the end of an IA block as a proxy for their attention, with larger values indicating more time spent with attention directed toward the internal environment during the 30-s block. One subject reported the same rating for all IA blocks. As correlations cannot be computed on measures with no variance, electrodes for this subject were excluded from the correlation analysis. For each block, we extracted the target effect for each electrode, as well as the attention ratings for IA and accuracy measures for EA. Subsequently, we correlated target effect during IA with the IA ratings across blocks, and target effect during EA with accuracy during EA across blocks within each electrode, and statistically tested these values across subjects at the group level. We performed a permutation test to determine whether the correlation values across electrodes were significantly different from zero. A separate permutation test was performed for accuracy during EA and attention ratings during IA for both frontal and temporal electrodes. To adjust for multiple testing of the two regions and conditions, we set the critical alpha to 0.05/4 = 0.0125.
Control Analyses
In addition to removing electrodes showing motor activity, we implemented two control analyses to ensure that any observed attentional differences cannot be attributed to a motor response to targets only present in the EA condition. First, if the target effect in the EA condition was only driven by a motor response to target tones, we would expect to see an enhanced target effect in the frontal cortex over the hemisphere contralateral to the responding hand. To address this issue, we compared the target effect between frontal electrodes over the hemisphere contralateral and ipsilateral to the responding hand during the EA condition. In essence, we separated the data used in our main analyses into “contralateral” and “ipsilateral” electrodes, and implemented a cluster-based permutation test using the same parameters as the main analyses to determine whether the frontal target effect was increased in contralateral electrodes.
Second, another way to determine whether the target effect in the EA condition only reflects a motor response is to assess the relationship between reaction times and the target effect in the frontal cortex over the hemisphere contralateral to the responding hand. To that end, we implemented the same analyses as above, and correlated the frontal target effect in “contralateral” electrodes with reaction times during the EA condition. We extracted the data used in our main analyses from “contralateral” electrodes. Following this, we ran correlations between the target effect in frontal “contralateral” electrodes with reaction times within each electrode, and statistically tested these values across subjects at the group level.
Results
Behavioral Performance and Attention Ratings
We recorded several measures to ensure subjects were following instructions for each attention state. Accuracy was used as a proxy for EA. Mean accuracy metrics across subjects were high (hits: target tones = 89% ± 2%, correct rejections: standard tones = 99% ± 0.3%), indicating they were performing the task during the EA condition. As no overt behavior was required during IA, we used postblock attention ratings as a proxy for IA. Attention ratings at the end of each block reflected the amount of time their attention was directed toward the internal environment during IA (1 = not at all and 5 = all the time). The mean rating (3.51 ± 0.24) averaged across subjects indicates they were generally attending to their own thoughts in the IA condition (Kam et al. 2018b). These measures collectively indicate that subjects followed task instructions, and were attending to the tones during the EA and to their own thoughts during IA.
Target Effect Was Larger and Peaked Later in the Frontal Cortex
We first compared the target effect irrespective of attention states between the frontal and temporal cortex, by extracting the target effect time series for each responsive electrode in each region. This target effect was elicited by infrequent target tones deviating from the local context of standard tones. In order to account for the most variance across responsive electrodes within each region, we performed a PCA on the target effect, and extracted electrodes that highly loaded onto the first principal component (c.f., Dürschmid et al. 2016). This approach yielded 23 frontal electrodes and 30 temporal electrodes, as shown in Figure 2A. For each region, we then computed the mean target effect size time series irrespective of attention states across these PCA-derived electrodes as shown in Figure 3A. We compared the magnitude of the target effect between regions using a cluster-based permutation test to identify the time points of statistical significance. A larger target effect was observed in the frontal cortex relative to temporal cortex between 390 and 600 ms (P = 0.013).
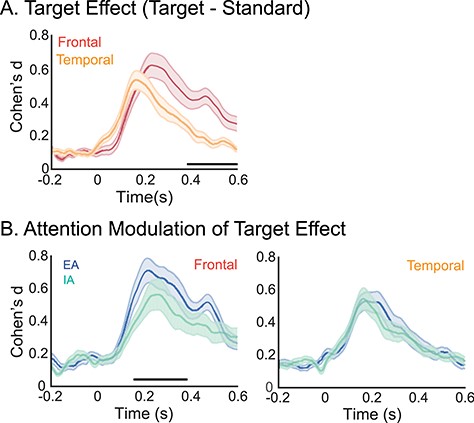
Attentional modulation of target effects. A) Mean effect size traces of the target effect (indexing difference between target and standard tones, irrespective of attention states) of the channels that loaded highly onto the first principal component are shown separately for each region (with SE shown in shaded area). Frontal electrodes showed a larger target effect than temporal electrodes. Black horizontal line indicates time points of significance. B) Target effects are also shown separately for frontal electrodes (left), and temporal electrodes (right). Mean target effect size traces (and SE shown in shaded area) averaged separately across frontal and temporal electrodes are shown for EA (blue) and IA (green). Frontal electrodes showed a larger target effect during EA relative to IA, with time points of significance denoted by the black horizontal line. Temporal channels did not show attentional differences.
We determined next whether the target effect selectively manifests itself in certain subregions by implementing the cluster-based permutation test for each PCA-derived electrode in the frontal and temporal cortices. Table 1 reports the number of significant electrodes and the total number of PCA-derived electrodes in each subregion. In the lateral frontal cortex, every electrode within the middle frontal cortex showed a significant target effect, as did all but one electrode within inferior frontal gyrus. In the temporal cortex, while most electrodes in the superior temporal cortex showed the target effect, only about half of middle and inferior temporal cortex electrodes showed the effect. The proportion of significant electrodes in the frontal regions was higher than the proportion in temporal regions, but the effect only approached significance (z = 1.839, P = 0.057).
Significant experimental effects in subregions of frontal and temporal cortices
| Target effect | Attentional modulation of target effect | |
|---|---|---|
| Frontal (n = 23) | ||
| SFC | 1/2 (50%) | 0/2 (0%) |
| MFC | 10/10 (100%) | 7/10 (70%) |
| IFC | 10/11 (90.90%) | 6/11 (54.54%) |
| Temporal (n = 30) | ||
| STC | 15/18 (83.33%) | 5/18 (27.78%) |
| MTC | 3/5 (60%) | 0/5 (0%) |
| ITC | 3/7 (42.86%) | 0/7 (0%) |
Note: The number of significant electrodes, total number of PCA-derived electrodes, and percentage of significant electrodes are shown for each subregion and separately for each experimental effect. SFC = superior frontal cortex, MFC = middle frontal cortex, IFC = inferior frontal cortex; STC = superior temporal cortex, MTC = middle temporal cortex, ITC = inferior temporal cortex.
We then examined whether the timing of the target response differed between the frontal and temporal cortex, by comparing their peak latency in target effect using linear mixed-effects model analysis. Peak latency occurred later in the frontal cortex (|$\overline{\mathrm{X}}$|: 288 ms, standard error [SE]: 22 ms) relative to the temporal cortex (|$\overline{\mathrm{X}}$|: 203 ms, SE: 14 ms; |$\chi$|(1) = 10.765, P = 0.001; β = 86.32, P < 0.001, 95% confidence interval [CI] = 36–135).
Larger Target Effect during External Relative to IA in Frontal Cortex
To address our primary question, the target effect was examined as a function of attention state (EA vs. IA). We first extracted the effect size time series of the target effect separately for each attention state and region (as illustrated in Fig. 3B). We then assessed whether the target effect varied between attention states using cluster-based permutation tests, separately for each region. This comparison captures a top–down attentional effect elicited by task demands, instantiating attention toward the external versus internal environment. For frontal electrodes, the target effect was larger during EA relative to IA between 159 and 381 ms (P = 0.001). Temporal electrodes did not show any differences between external and IA.
Next, we determined which subregions showed attentional differences in the target effects by implementing the cluster-based permutation test for each electrode in each subregion. Table 1 reports the number of significant electrodes and the total number of electrodes in each subregion. The effect size time series of the target effect as a function of attention state for each subregion are shown in Supplementary Figure 3, and the location of significant electrodes are shown in Supplementary Figure 4. In the frontal cortex, middle frontal cortex had the most significant electrodes, followed by inferior frontal cortex, whereas no electrodes in the superior frontal cortex showed attentional differences. In the temporal cortex, superior temporal cortex had a small proportion of significant electrodes, in contrast to middle and inferior temporal cortex with no electrodes showing attentional modulations. We then compared the proportion of significant electrodes between regions, and found a higher proportion of frontal electrodes relative to temporal electrodes showed attentional differences in the target effect (z = 3.037, P = 0.002). These findings indicate that not only is the attention effect uniquely significant in frontal cortex at the group level, but also that more frontal electrodes showed a significant attention effect than temporal electrodes at the single electrode level of analyses.
Finally, we examined the timing of the target effect separately for the frontal and temporal cortex by comparing the peak latency of target effect between EA and IA using linear mixed-effects model analyses. Across frontal and temporal electrodes, the main effect of attention was not significant (χ2(2) = 0.170, P = 0.918; β = 13.70, P = 0.696, 95% CI = −83–56), suggesting peak latencies were comparable between EA and IA. Separate analyses within each region revealed similar results for frontal channels (P = 0.657) and temporal channels (P = 0.903).
Target Effect Differentially Correlated with Accuracy and Attention Ratings as a Function of Region
Our correlation analyses focused on accuracy as a proxy for EA and attention ratings as a proxy for IA. Using permutation tests, we tested the relationship between the target effect in HFA and accuracy during EA and attention ratings during IA (as shown in Supplementary Fig. 5). For frontal electrodes, the target effect did not correlate with accuracy or ratings (P > 0.350). For temporal electrodes, the mean correlation between accuracy and target effect during EA averaged across electrodes was greater than zero (|$\overline{\mathrm{X}}$|: 0.223, SE: 0.012, P < 0.001). This indicates that larger temporal response may facilitate target detection, with larger target effects tracking higher accuracy during EA. In contrast, attention ratings indicating amount of time spent in IA were negatively associated with target effect during IA (|$\overline{\mathrm{X}}$|: −0.203, SE: 0.016; P = 0.003), suggesting that the smaller the target effect during IA, the more time the subjects rated having attended internally to their own thoughts during that block.
Observed Attention Effects Cannot Be Attributed to Motor Confound
Two control analyses were implemented to ensure the larger target effect during EA could not be attributed to a motor response to targets only present in the EA condition. First, we compared the target effect between frontal electrodes over the hemisphere contralateral and ipsilateral to the responding hand during the EA condition. If the larger target effect in the EA condition was driven by a motor response to target tones, we would expect to see an enhanced target effect in the frontal cortex over the hemisphere contralateral to the responding hand. As shown in Supplementary Figure 2, the frontal target effect was not enhanced in contralateral electrodes. Consistent with this observation, no significant clusters emerged, indicating that the two groups of electrodes did not significantly differ from each other. This suggests that the larger target attention effect in the EA condition was not merely a motor response. Second, we examined the relationship between reaction times and the target effect in the frontal cortex over the hemisphere contralateral to the responding hand. There were no significant correlations between the frontal target effect in contralateral electrodes and reaction time (|$\overline{\mathrm{X}}$|: 0.100, SE: 0.140, P = 0.197). Taken together, these two analyses revealed that the frontal target effect was not enhanced in electrodes contralateral to the responding hand, and the frontal target effect in contralateral electrodes did not correlate with reaction time. These findings suggest that the enhanced frontal target effect during EA does not simply reflect a motor response. Rather, the frontal target effect reflects a cognitive level processing of a target stimulus deviating from the standard tones.
Discussion
We delineated the spatiotemporal characteristics of neural activity in the frontal and temporal cortices during EA and IA using iEEG recordings. Our results indicate that both frontal and temporal cortices showed a target effect across both attention states. As hypothesized, the frontal cortex showed a larger target effect during EA relative to IA, whereas the temporal cortex showed comparable response in both attention states with no evidence of differential attentional modulation. Taken together, this study provides direct electrophysiological evidence for top–down attentional modulation of neuronal activity in the frontal cortex, revealing enhanced engagement with EA.
The frontal cortex showed differential neural activity during EA versus IA, with preferential engagement with EA. Ample research has established that the frontal cortex is a core member of the externally oriented attentional network (Corbetta and Shulman 2002) and plays a key role in the top–down control of selective attention to facilitate goal-directed behavior (Barcelo et al. 2000; Hopfinger et al. 2000; Bressler et al. 2008). In the context of auditory selective attention, the frontal target effect observed in our data is reminiscent of the processing negativity, an event-related potential (ERP) component with a late frontal distribution involved in the control of selective attention (Näätänen 1982; Giard et al. 2000). Consistent with these reports, our findings demonstrate that the frontal cortex is also engaged in the modulation of EA and IA via the top–down influence of task demands. Our analyses identified the middle and inferior frontal cortex as subregions that are most involved in this top–down attentional modulation, corroborating neuroimaging reports implicating the lateral prefrontal cortex in external and internal attentional modulations (Esterman et al. 2013; Mittner et al. 2014; Stern et al. 2015).
Our results established a reduced frontal target effect during IA relative to EA. Importantly, this attentional difference could not be attributed to a motor confound in the EA condition; rather it reflects reduced cognitive level target processing during IA. This finding is in line with previous reports of reduced stimulus-evoked activity when attention is directed away from the external task (as reviewed in (Kam and Handy 2013). Past studies have primarily examined event-related potentials (Braboszcz and Delorme 2011; Kam et al. 2014) or low-frequency power as electrophysiological markers of attention (O’Connell et al. 2009; Braboszcz and Delorme 2011; Baird et al. 2014). Given that HFA reflects different neural mechanisms than the P3 event-related potential (Kam et al. 2018c) and low-frequency power (Scheeringa et al. 2011), these results suggest that modulation of neural activity by EA and IA is not a unitary electrophysiological phenomenon. Rather, it manifests in multiple neural markers. Our findings support the decoupling model proposing that attending internally to an ongoing thought unrelated to one’s immediate surroundings requires some degree of decoupling from the external environment (Smallwood and Schooler 2015). Specifically, our brain supports IA by withdrawing from the external environment, as reflected in the dampened response to external inputs, and allocating attention to our inner thoughts instead.
Given the auditory modality of the task, a large percentage of electrodes in the temporal cortex were task responsive. Among task responsive electrodes, the target effect peaked earlier in the temporal cortex relative to the frontal cortex. The peak latency of the temporal cortex (mean = 203 ms) coincides with the latency of the auditory deviance detection response commonly reported in the scalp EEG mismatch negativity literature (ca., 200–250 ms; Näätänen et al. 2007). Notably, this observed pattern reflects a sensory-driven response elicited by infrequent target tones deviating from the local context of standard tones. This target effect in the temporal cortex was associated with behavior and attention ratings: the larger the target effect, the higher the accuracy during EA, and the smaller the target effect, the more time subjects rated having spent attending internally to their own thoughts during IA.
In contrast, even though frontal activity revealed more attention-relevant electrophysiological information, attentional differences in the electrophysiological measures did not correlate with task performance or attention ratings. Although temporal electrodes showed a smaller target effect compared to frontal electrodes, the earlier peak in the temporal response may be more behaviorally relevant for optimal performance in the task. Further, the trial-by-trial response in the temporal cortex versus the frontal cortex is evidently more closely linked to one’s subjective evaluation of their attentional focus provided at the block level. Another possibility is that the simple target detection task we employed was very easy, and thus it was not particularly taxing of frontal resources. Accordingly, although we observed a sensory level response and postsensory level target effect in the frontal cortex, suggesting the frontal cortex was engaged during the task, this electrophysiological response may not be necessary to impact accuracy in nondemanding cognitive tasks. This is consistent with the absence of behavioral deficits observed in patients with large unilateral frontal lobe lesions (Knight 1997; Lovstad et al. 2012; Kam et al. 2018b).
The magnitude of the target effect in the temporal cortex did not differ between attention states, with comparable magnitude during EA and IA. This appears to contrast with previous reports of attenuated sensory evoked responses to auditory stimuli during IA (Braboszcz and Delorme 2011; Kam et al. 2011). Notably, these past studies adopted an experimental approach that placed no control over the subjects’ attention state. Subjects were free to attend externally to the task or internally to their thoughts as they wished. In contrast, we instructed our subjects to direct their attention externally and internally as part of the experimental manipulation, necessitating top–down attentional control to fulfill task demands. Another marked difference between the current study and past studies lies in the frequency and nature of the EEG measure. Our study examined the target effect (i.e., the difference between target and standard tones) whereas past studies have exclusively examined single condition effects (i.e., standard or target stimuli). While our study used HFA, past studies have primarily used low-frequency measures, such as ERPs and theta power, which capture a different underlying mechanism (Scheeringa et al. 2011; Kam et al. 2018a). For example, HFA positively correlated with the BOLD response in a simultaneous recording of both signals (Logothetis et al. 2001; Mukamel et al. 2005), whereas low-frequency activity showed a negative correlation (Scheeringa et al. 2011). Notably, HFA accounted for more variance in the BOLD signal, and showed a parametric relationship with the BOLD signal (Hermes et al. 2012). HFA also reliably tracks the firing of neuronal population close to the recording electrode (Ray and Maunsell 2011; Rich and Wallis 2017). Unlike the spatially distributed signal of low-frequency activity, HFA is a spatially focal signal allowing one to infer the cortical issue from which it originates with anatomical precision (Flinker et al. 2011; Hermes et al. 2012; Daitch and Parvizi 2018).
Of relevance, a previous study that used the same experimental paradigm as the current study found that the N1 sensory evoked response did not show attentional modulation (Kam et al. 2018a). Studies of selective attention have also reported that attention effects are absent or reduced at early latencies in sensory regions under low perceptual and cognitive loads (Giard et al. 2000; Lavie et al. 2014), as is the case in our task. Both results are in line with our observation of a lack of attentional differences in temporal HFA. Critically, our findings are consistent with an intracranial EEG study that showed similar temporal profile and morphology of the HFA response across the frontal and temporal cortices (Dürschmid et al. 2016). This study manipulated the predictability of auditory inputs, and found HFA in the temporal cortex was not modulated by the predictability of tones whereas frontal cortex showed larger HFA responses to unpredictable target tones. Their findings and ours both highlight the important role of the frontal cortex in top–down processes. Taken together, our results provide evidence from direct cortical recordings demonstrating that top–down attentional modulation in the frontal cortex shows preferential activation during EA.
Notes
We thank our patients who have dedicated their time and effort, and whose participation was instrumental in this study. We also thank Alejandro Blenkmann, Assaf Breska, Athina Tzovara, Julian Führer, Matt Dixon, Yulian Oganian for insightful discussions.
Funding
The Natural Sciences and Engineering Research Council of Canada; the James S. McDonnell Foundation (for J.W.Y.K.); Research Council of Norway (240 389/F20); the University of Oslo (Internal Funding for A.K.S., T.E., and P.G.L.); the National Institute of Neurological Disorders and Stroke (NINDS, R3721135); and National Institute of Mental Health (NIMH, Conte Center 1 PO MH109429 to R.T.K.). The funding sources have no involvement in the conduct of the research and preparation of the article.