


Abstract
Our ability to calculate implies more than the sole retrieval of the correct solution. Essential processes for simple calculation are related to the spreading of activation through arithmetic memory networks. There is behavioral and electrophysiological evidence for these mechanisms. Their brain location is, however, still uncertain. Here, we measured magnetoencephalographic brain activity during the verification of simple multiplication problems. Following the operands, the solutions to verify could be preactivated correct solutions, preactivated table-related incorrect solutions, or unrelated incorrect solutions. Brain source estimation, based on these event-related fields, revealed 3 main brain networks involved in simple calculation: 1) bilateral inferior frontal areas mainly activated in response to correct, matching solutions; 2) a left-lateralized frontoparietal network activated in response to incorrect table-related solutions; and (3) a strikingly similar frontoparietal network in the opposite hemisphere activated in response to unrelated solutions. Directional functional connectivity analyses revealed a bidirectional causal loop between left parietal and frontal areas for table-related solutions, with frontal areas explaining the resolution of arithmetic competition behaviorally. Hence, this study isolated at least 3 neurofunctional networks orchestrated between hemispheres during calculation.
Introduction
One-digit multiplication is one of the most common mathematical operations used in everyday life. Extensive research has shown the involvement of several brain areas (Arsalidou and Taylor 2011). Mapping of relevant areas has been attempted with different tasks (i.e., verification vs. production), different experimental manipulations (i.e., use of procedures vs. retrieval), or different analyses contrasts (i.e., contrast between arithmetic operations, brain responses to correct vs. incorrect problems, contrast between calculation and numerical comparison, etc.). This wide variety of approaches and paradigms, however, contributes, to various degrees, to the present state of uncertainty in accounting for the series of events underlying simple calculation processes.
Indeed, past findings in this domain seem to be in apparent contradiction with each other and/or with previous literature. An example is the finding that simple multiplication requires a higher activation in the right hemisphere, rather than in the left hemisphere (Arsalidou and Taylor 2011). In fact, left hemisphere predominance is expected on the basis of traditional neuropsychological and neuroimaging literature (Dehaene and Cohen 1997). What determines activation in the right rather than in the left? In a previous study (Salillas et al. 2012), using transcranial magnetic stimulation (TMS), we showed a causal relationship between the temporary impairment in the right parietal lobe and a specific delay in single digit multiplication. It has also been shown that the permanent (Benavides-Varela et al. 2017) or temporary (Semenza et al. 2017) impairment of either the left or right hemisphere may lead to errors in simple multiplication. This would not be possible if the 2 hemispheres do the same thing—the healthy hemisphere would be able to complete the task alone. Besides, errors found with direct cortical electrostimulation are site specific for different operations (Della Puppa et al. 2015; Semenza et al. 2017); thus, they cannot be attributed to generic processing difficulties either. The only remaining possibility (Semenza and Benavides-Varela 2018) is that each hemisphere contributes individually at a specific point, with a specific role that cannot be fully compensated by the spared, contralateral hemisphere.
Thus, 1-digit multiplication may require the orchestration of both hemispheres. In fact, the qualitative analysis of the errors committed upon transient disruption to the left or right parietal sites suggested which hemisphere does what (Semenza et al. 2017). We showed that, after inhibition of the parietal lobe during awake surgery, the type of errors differed depending on whether electrostimulation was applied to left or right parietal areas. Specifically, inhibition of right parietal sites, imbalancing processing in favor of the spared left hemisphere, mostly induced “retrieval errors.” In these errors, the result belongs to the same table of one of the operands (e.g., 7 × 3 = 28 or 14). In contrast, inhibition of left parietal sites, imbalancing processing in favor of the right hemisphere, provoked “approximation” errors, whereby the result is close to the target (e.g., 7 × 3 = 19). This observation is consistent with the idea of a simultaneous action of 2 different systems (described as independent in Dehaene and Cohen 1995). The first, located in the left hemisphere, based on retrieving solutions from a devoted store, and the other, mainly located in the right hemisphere, based on approximation. Although this idea is widely accepted, further studies emphasize the complexity of simple multiplication, implying the independent role of different components and suggesting how it may be sustained by a relatively extended network (see the meta-analysis of Arsalidou and Taylor 2011 and, for a review, Menon 2015), including occipitotemporal visual regions and parietal, frontal, and prefrontal cortices (Arsalidou and Taylor 2011). A recent study further stressed the plasticity of frontoparietal networks through resting-state functional connectivity during arithmetic learning (Zhao et al. 2019).
The next step is to determine the sequence of activation of these areas. Time is a crucial factor because different areas might dominate different processing steps in each calculation task at different times. For example, retrieving the oral form of the result in a production task might require different areas at different moments, than in a verification task, in which the answer is “yes” or “no.” However, it is still unclear how, exactly, information processing is handled by such a distributed network (Menon 2015). Furthermore, with regard to retrieval processes within multiplication, different studies have suggested that the left angular gyrus (ANG) may change its activity during an automated multiplication task (Delazer et al. 2003; Ischebeck et al. 2007; Zamarian et al. 2009). Studies using verification tasks (vs. number detection) have shown activation in the fusiform gyri, the superior and inferior parietal lobes, and the left inferior frontal gyrus (IFG) (Brodmann areas [BA] 44) (Rickard et al. 2000).
Almost all neuroimaging studies concerning calculation have used functional magnetic resonance imaging (fMRI), which lacks temporal resolution, merging different processes in 1 image. In contrast, magnetoencephalography (MEG) and electroencephalography (EEG) can uncover how functions unfold over time with millisecond precision. Unlike in EEG, the magnetic signal does not interact with biologic tissues. Hence, the MEG brain signal is inherently more accurate and less subject to distortion. Moreover, the MEG technique is sensitive to the intracellular, primary currents (Leahy et al. 1998; Baillet et al. 2001), which ultimately impacts the forward model, essential for source estimation. Finally, the coregistration of sensors with the structural images of participants is easier in MEG with location error reduction. In turn, EEG and MEG are not equivalent or opposed, but instead, complementary. Here, processes are defined by magnetic event-related fields (ERFs), which can be functionally related to previously reported electric event-related potentials (ERPs) literature. However, one can also accurately estimate where in the brain those functions originated through ERF-based source estimation.
Several studies using EEG have robustly evidenced ERP components that respond to the associativity inherent to fact retrieval (Niedeggen and Rösler 1999; Niedeggen et al. 1999; Domahs et al. 2007). These components, in turn, are modulated by long-term stored arithmetic memory networks. These networks become active even when the arithmetic task is not explicit, such as in numerical matching tasks (Galfano et al. 2004, 2009). Overall, these studies suggest that we automatically activate not only the correct solution but also solutions that are related to the operands (e.g., 9 after 2 × 3). These automatic activations and associative interference also occur between operations (i.e., 8 after 2 + 4) (Lefevre et al. 1988; Megías and Macizo 2016). The incorrect, yet related solutions elicit N400–LPC components that differ in amplitude from other solutions that are not mnemonically associated with the operands (i.e., 7 after 2 × 4 or after 2 + 4) (Niedeggen and Rösler 1999; Niedeggen et al. 1999). Given its robustness, the N400–LPC complex can be a marker when testing the strength and quality of arithmetic networks for each of the 2 languages in bilinguals (e.g., Salillas and Wicha 2012) or contrasting retrieval between adults and children (Prieto-Corona et al. 2010). The so-called arithmetic N400 is also sensitive to expectancies, based on arithmetic knowledge, and on the overall task-dependent probability of encountering an incorrect solution (Shaul and Nesher 2014). However, not all of these studies have manipulated the relatedness effect, which is crucial for the present investigation.
On the other hand, the time course of brain sources responding to arithmetic fact retrieval has not yet been reported. Only 1 study recently measured the electromagnetic signal for arithmetic processes (Strauss and Dehaene 2019) in the study of sleep cognition. These data were restricted to scalp topographies of the elicited ERPs/ERF, that is, to the sensor level. Hence, a concurrent study describing magnetic activity at the sensor and brain source levels is lacking. Such a study would help enormously in filling the gap within the literature on arithmetic processing, which has accumulated information on where, but lacking concurrent data about when, different calculation processes occur in the brain.
We measured MEG activity during the verification of solutions to simple multiplication problems (e.g., is 7 × 3 = 21 correct?). In this context, we also addressed the question of brain lateralization. We relied on the observation of brain responses to correct solutions (e.g., 7 × 3 = 21), table-related incorrect solutions (e.g., 7 × 3 = 28), and table-unrelated incorrect solutions (e.g., 7 × 3 = 19). The ERFs time locked to the presentation of the solution, which differ in the correct versus incorrect solutions contrast or in the incorrect related versus unrelated contrast, is described. Then the brain sources associated with the significant ERFs were estimated. The use of MEG allowed for the identification of brain areas with more transient activations, which fMRI could be blind to. To fully understand the functional meaning of the resulting sources, we related them to reaction times and accuracy. Finally, to understand how the detected sources work jointly, we calculated the directional functional connectivity between significant processes during simple calculation. When verifying multiplication problems, the N400–LPC components are clearly modulated by the links between the given solution and the operands sources for each solution condition.
We contrasted our data with what is known from electrophysiological studies in a similar paradigm (Niedeggen and Rösler 1999; Niedeggen et al. 1999). Specifically, ERP literature has revealed that modulations of the N400–LPC complex amplitudes depend on the degree of preactivation, due to the preceding arithmetic context. This preactivation is a consequence of the spreading activation from the operands—correct solutions are primed before their presentation, in contrast to incorrect solutions. Hence, correct and incorrect solutions differ in the amplitudes of the elicited N400–LPC. Moreover, according to these studies, related incorrect solutions are also preactivated before they are presented, in contrast to unrelated incorrect solutions. These also exhibit differing ERP complex amplitudes, meaning that the preceding context has also preactivated the incorrect, related solution. This interference or competition has to be solved before a response can be given (Niedeggen et al. 1999; Galfano et al. 2003; Rusconi et al. 2006). Neuroimaging studies have not yet considered these distinctions. Hence, despite being crucial parts of simple calculation, the brain sources for these processes have not been described.
Importantly, the analysis of errors conducted in Semenza et al. (2017) allows for the prediction of a different relative lateralization pattern for related versus unrelated solutions. Table-related solutions, more than unrelated solutions, result from the action of a left-lateralized network, because the interference is a consequence of arithmetic-stored knowledge, which is left lateralized. Additionally, the brain response to correct solutions will provide information about selection processes in arithmetic. The contingent sequence of brain events for selection, for the resolution of arithmetic competition, and for the processing of unexpected solutions, can be optimally described with MEG. Most importantly, through the observation of the temporal dynamics of those areas, their interrelations, and their link to behavior, we aim to refine our understanding of the functionality of such brain networks.
Materials and Methods
Participants
After being informed about the study, 16 volunteers (4 males; age range: 24–30 years old, mean age: 26) signed the informed consent and participated in the study. All of the participants were Caucasian Italian speakers. All except one participant were right handed according to the Edinburgh Handedness Inventory (Oldfield 1971; Bryden 1977). Two right-handed participants had 1 close relative who was left handed (sister and mother). Participants had completed their graduate studies or were Psychology students. Participants had no auditory, neurological, or psychiatric conditions or history of drug abuse. None of the participants had studied for a specialized mathematics degree. The study was approved by the pertinent Ethical Committee of the IRCCS San Camillo Hospital (Venice, Italy) and was performed under the approved guidelines. All methods were in accordance with the Declaration of Helsinki.
Stimuli
Forty-eight multiplication problems together with a solution were randomly repeated twice for each of the 2 experimental blocks. Half of them implied a correct solution (i.e., 2 × 3 = 6; 96 items in total; hereafter “Correct Solutions”) and half implied an incorrect solution (96 items in total; “Incorrect Solutions”). Half of the incorrect solutions were table related with one of the operands (i.e., 2 × 3 = 8; 48 items in total; “Incorrect Related Solutions”), the other half were nonrelated to any of the operands (i.e., 2 × 3 = 7; 48 items in total; “Incorrect Unrelated Solutions”). The product size did not differ between correct and incorrect solutions (t1,23) = 1.44; P = 0.2) or between related and unrelated solutions (t1,11 = 0.08; P = 0.94). The distance between correct and given solutions for related versus unrelated did not differ either (t1,11 = −0.07; P = 0.94). Tie problems were not included. The problem size effect was controlled for: the same operands were used for correct and incorrect problems, and the same operands were used for related and unrelated problems. The experimental conditions were determined by the selected solution.
Experimental Procedure
The experiment was implemented in Psychopy software (version 2.8.4, Peirce 2007). The session began with the explanation of the task and several training items, until the participant understood the procedure. After a 3-s initial fixation, the trials began. The sequence of each trial was as follows: first operand (350 ms), followed by a blank screen (250 ms), after which the second operand was shown (350 ms), followed by a blank screen (150 ms), and then the solution appeared (350 ms). The participant judged the correctness of the solution from the appearance of the solution, during a maximum of 1400 ms, while the fixation point remained.
During the first block, the participant responded with the right hand, using the index finger when judging the solution as correct and the middle finger when judging the solution as incorrect. In the second block, the left hand was used, with the same finger–response combination.
Data Acquisition
Structural Data (MRI) Acquisition
A T1-weighted magnetic resonance image (MRI) was available for 11 of the 16 participants. When a T1 was not available, an adult ICBM 152 template was used, as suggested in Gross et al. (2013). The template was individually warped according to digitized head-points. MRIs were acquired with a 3 T Ingenia CX Philips scanner (Philips Medical Systems). A 3D sagittal T1-weighted-3D-TFE scan was acquired with the following parameters: repetition time = 8.3 ms, echo time = 4.1 ms, flip angle = 8, acquired matrix resolution = 288 Å ~ 288, slice thickness = 0.87 mm.
MEG Data Acquisition
MEG recordings were acquired with a 275 gradiometer CTF-MEG system in a quiet magnetically shielded room with a CTF-MEG-system (MISL, Vancouver, Canada). Before entering the magnetically shielded room, participants underwent initial preparation. Three head coils were placed to monitor head position during MEG recording. Six electrodes were placed to record vertical electrooculogram (VEOG) (left and right), horizontal electrooculogram (HEOG), and electrocardiogram (bipolar montage) to detect and correct blinks and heartbeats in the magnetic signal. We then used Fast-Track Polhemus hardware connected to Brainstorm digitization software (http://neuroimage.usc.edu/brainstorm), to digitize between 60 and 70 head-points, delineating the shape of the head, nose, and eyebrows.
The participant remained seated during the experimental session. The head was stabilized within the MEG system helmet with 2 pieces of foam. Head position was continuously monitored during recording with the CTF Continuous Head Localization system (head movements never exceeded 5 mm). A screen located 40 cm from the participant’s face received the images of the stimuli through a projector, such that stimuli approximately subtended a visual angle of 2.5°. Together with the events related to each condition that were sent to the MEG continuous signal, possible delays in the actual visual presentation of the stimuli were controlled through a photodiode. This photodiode was triggered by a white rectangle cooccurring with the solutions and invisible to the participant. Behavioral and MEG data were analyzed attending to the timing of the photodiode codes. Continuous MEG signal was acquired using a whole head 275-channel system (CTF-MEG) and sampled at 1200 Hz. with an online antialiasing filter at 400 Hz. MEG data were initially recorded as a series of concatenated, 1-s epochs merged as a single continuous file before data analysis, and then transformed to continuous signal for analyses. Third-order gradient correction was applied in real-time to increase the MEG detectors’ sensitivity to weak signals and allow environmental noise cancellation. This correction has been applied in previous studies focusing on similar ERF components (e.g., Ghosh Hajra et al. 2018; Shin et al. 2019). The CTF system was located inside a shielded room for enhanced noise reduction. The MEG recording sessions lasted approximately 9 min.
Data Analysis Procedure
Behavioral Analyses
Response times to the solution were averaged by condition and participant. A correct–related–unrelated contrast would have considered averages on different number of trials, something unavoidable in order to maintain a 1:1 ratio between correct and incorrect responses. Contrasting averages based on the very different number of trials would especially affect MEG sensor/source averages with incomparable signal-to-noise ratio. Thus, only for behavioral responses, we ran a 1-way analysis of variance (ANOVA) with 3 levels (correct–related–unrelated). In both behavioral and MEG analyses, t-tests were performed on correct versus incorrect problems and on related versus unrelated. Only correct responses were considered for MEG analyses.
Sensor Space
Raw data were band-pass filtered (0.1–30 Hz). Blinks and cardiac artifact topographies were identified through signal-space projection (SSP) and corrected. The SSP was applied in a time window of ±40 ms, with a frequency band between 13 and 40 Hz for cardiac artifacts, and a time window of ±200 ms, with a frequency band between 1.5 and 15 Hz for ocular artifacts. Simultaneous artifacts of different kinds (i.e., cardiac and ocular) were removed before artifact correction. These epochs were submitted to a trial rejection procedure based on visual inspection, and epochs that still contained artifacts were discarded. After artifact rejection, an average of 78.25 trials for correct (SE: 3.74), 38.9 for incorrect related (SE: 1.9), and 41.4 for incorrect unrelated (SE: 1.6) solutions were included in the final analysis (incorrect total: 80.3). The events of interest (correct, related, and unrelated solutions) were time adjusted according to the photodiode trigger. The signal was then segmented −100 ms (baseline) and 1000 ms after the time-corrected events, and averaged for each condition, obtaining 4 averaged ERFs for each participant: correct–incorrect and related–unrelated.
The ERF analyses were focused on different clusters of sensors, allowing for the homogenization of sensor location across participants. These clusters were determined by a visual inspection of the difference maps (sensors × time) for each of the 2 contrasts. This inspection was constrained by the requirement that any effect was present in at least 6 adjacent sensors and that the effect was sustained in time. In this way, 3 windows were delimited, which reflected similar components in each contrast: an early component, a N400-like component, and a late positive component (LPC).
For the correct versus incorrect contrast, effects in a 170–290-ms latency band were localized in 3 main clusters: a left anterior temporal (L-ATc) cluster, a cluster involving left frontal, central, and parietal sensors (L-CPc), and a right cluster in central and parietal sensors (R-CPc). Effects at the 300–500-ms latency band were localized in a left posterior temporal cluster (L-PTc), the L-ATc, a right anterior temporal cluster (R-ATc), and in a right occipitotemporal cluster (R-OTc). Effects at the 700–800-ms latency band were localized again in the L-CPc cluster.
For the related versus unrelated contrast, the effects were smaller and less distributed, yet they occurred throughout 3 comparable latency bands. Effects at the 190–220-ms latency band were localized in a right parieto-central cluster (R-PCr). Effects at the 250–450-ms latency band were localized in a left fronto-central cluster (L-FCr). Finally, in the 700–800 ms latency band, the effects were localized in a right fronto-central cluster (R-FCr).
The averaged ERF clusters were entered into an ANOVA for each latency band, with cluster and correctness or relatedness as factors. Bonferroni corrected 2-sided t-tests were run for each cluster after the ANOVA.
Correct > incorrect (corrected P < 0.001; minimum cluster size: 100 voxels)
| Cluster size | P value (peak) | MNI coordinates | Brain area | BA | |||
|---|---|---|---|---|---|---|---|
| x | y | z | |||||
| 170–290 | 2049 | 0.000 | −45 | 20 | 4 | IFG/STG/insular/Tri/Operc | BA46/BA47/BA44 |
| 252 | 0.000 | −9 | 53 | 48 | SFG | BA8/BA9 | |
| 122 | 0.000 | −17 | 52 | 34 | SFG | BA8/BA9 | |
| 107 | 0.000 | −66 | −8 | 34 | Precentral | BA4/BA6 | |
| 136 | 0.000 | 8 | 73 | 2 | MedFG/SFG | BA10 | |
| 300–500 | 280 | 0.000 | −50 | 19 | 15 | Temporal pole/IFG orbital | BA38/BA47 |
| 199 | 0.000 | −58 | 11 | 34 | IFG/Operc/insula | BA45/BA44 | |
| 632 | 0.000 | −46 | 21 | 8 | IFG/precentral | BA44, BA13/BA45 | |
| 700–800 | 1261 | 0.000 | −53 | −19 | 60 | IPL (SMG)/postcentral/precentral | BA40/BA2/BA6 |
| 966 | 0.000 | −65 | −10 | −7 | MTG | BA21 | |
| 4045 | 0.000 | 53 | 12 | −3 | IFG/insula/STG/Operc/Temp pole/Tri/Orb | BA13/BA38/BA45/BA44/BA9 | |
| 1708 | 0.000 | 17 | 10 | −21 | IFG/Orb/parahippocampal G/insula | BA25/BA47/BA34, | |
Note: IFG: Inferior Frontal Gyrus; Tri: Pars triangularis; Operc: Pars Opercularis; Orb: Pars Orbitalis; SFG: Superior Frontal Gyrus; MedFG: Medial FG; IPL: Inferior Parietal Lobule; SMG: Supramarginal Gyrus; MTG: Middle Temporal Gyrus; STG: Superior Temporal Gyrus.
Source Space
The cortical surface geometry from the structural MRI was obtained using Freesurfer software (Fischl 2012) and reduced to a value close to 15 000 vertices (depending on the participant’s anatomy) to facilitate analyses. These cortical surfaces were aligned with the sensors attending to the digitized head-points.
The method used to estimate the dipoles distributed in the cortex was a depth-weighted minimum norm estimate (M. Hämäläinen, software MNE). The dw-MNE inverse method was chosen over adaptive spatial filters to optimize the detection of the expected contributions of different synchronous sources. The function used involved depth weighting, which corrects the MNE bias for superficial sources (Lin et al. 2006; Hämäläinen, software manual). Before calculating the dw-MNE solution for each participant and condition average, a noise covariance matrix was obtained with respect to the baseline based on those averages. An overlapping spheres method was used to estimate the forward model. The dw-MNE solution was then calculated for each millisecond (−100 to 1000 ms) on the cortical surface. The source maps were then normalized (Z-score minus baseline) and registered to a standard anatomy (ICBM152). Normalized source maps were spatially smoothed (5 mm) and used for group analyses. Statistical analyses were performed using SPM8 second-level t-tests on the averaged absolute value for each condition (congruent vs. incongruent and related vs. unrelated) and time band. The latency bands deduced from the ERFs were used as the time windows of interest for the source analyses, restricting in this way, the possible 1000 source configurations.
Functional Connectivity Analysis
We used the Granger causal connectivity analysis toolbox (http://www.anilseth.com) implemented in MATLAB (Mathworks) (Seth 2010; Barnett and Seth 2014). The time series of the 16 participants for each condition (related or unrelated) and regions of interest (ROI) (parietal and frontal source clusters obtained in the SPM contrasts) were entered in the analyses, after a resampling to 300 Hz. Source time series did not violate the assumption of covariance stationarity. Multivariate autoregressive (MVAR) models were used to determine if the time series of a region (R1) “Granger caused” the time series of a region (R2) in the time domain. That is, if R1 predicts R2 better than R1 predicts itself (Granger F value significantly different from zero). The model order for the MVAR model was determined according to the Bayesian Information Criterion with an optimal order of 2. Granger F values with an associated false discovery rate (FDR)-corrected α value <0.05 were considered significantly different from zero.
Results
Behavioral
The average accuracy across participants was 0.95 (maximum 0.99; minimum 0.85). For accuracy, the ANOVA contrasting correct (0.94; SE: 0.009), related (0.93; SE: 0.018), and unrelated solutions (0.96; standard error [SE]: 0.008), did not show a main effect (F2,30 = 2.46, P = 0.100). However, unrelated solutions tended to be responded to with higher accuracy than correct solutions (t1,15 = 2.04, P = 0.059). The pattern of effects was stronger for the reaction times (RTs), with a main effect of type of solution (F2,30 = 36.13; P < 0.001; correct: 528.6; SE: 23.32; related: 603.1; SE: 26.06; unrelated: 579.3; SE: 23.76). As expected, there were slower reaction times for the related solutions than for the unrelated solutions (t1,15 = 3.36; P = 0.004), and they were also slower than for correct solutions (t1,15 = 8.7; P < 0.001). Unrelated solutions were slower than correct solutions, as well (t1,15 = 4.68; P < 0.001). In turn, incorrect solutions were generally slower than correct solutions (t1,15 = 6.87; P < 0.001). These results indicate that participants showed the expected interference from table-related solutions, needing more time to judge those solutions as incorrect.
Sensor Space
The contrast of correct and incorrect solutions yielded significant effects in a first early ERF window, between 170 and 290 ms, distributed in 3 clusters (see Fig. 1): L-ATc: t1,15 =3.39, P = 0.004; L-CPc: t1,15 = −5.87, P < 0.001; R-CPc: t = 3.52, P = 0.003; and cluster × correctness interaction: F5,75 = 7.48, P < 0.001. Four different clusters showed significant differences in the following N400-like component, between 300 and 500 ms. In the left hemisphere, L-ATc and L-PTc showed t1,15 = 3.102, P = 0.007 and t1,15 = −3.84, P = 0.002, respectively. In the right hemisphere, 2 clusters showed significant effects, R-ATc: t = −4.03, P = 0.001 and R-OTc: t = 3.52, P = 0.003 (cluster × correctness interaction: F5,75 = 11.38, P < 0.001). One cluster showed significant differences in the final, LPC component, between 700 and 800 ms, the L-CPc: t = −4.08, P < 0.001.
Related > unrelated. (Clusters with P < 0.001 are in bold. Minimum cluster size: 20 voxels)
| Cluster size | P value (peak) | MNI coordinates | Brain area | BA | |||
|---|---|---|---|---|---|---|---|
| x | y | z | |||||
| 120–220 | 380 | <0.001 | −48 | 49 | −3 | MFG/Tri/Orb DLPFC—frontopolar | BA10, BA46 |
| 406 | <0.001 | −52 | −77 | 0 | Occipitotemporal | BA37, BA19 | |
| 39 | 0.001 | −48 | 22 | 40 | MFG | BA8, BA9 | |
| 250–450 | 1055 | <0.001 | −65 | −56 | 24 | SMG/STG | BA40 |
| −63 | −58 | 36 | ANG/SMG | BA40/39 | |||
| −55 | −64 | 26 | STG | BA39 | |||
| 142 | 0.002 | −53 | −76 | 0 | Occipitotemporal | BA19 | |
| 107 | 0.002 | −29 | −91 | 24 | Superior occipital | BA19 | |
| 48 | 0.002 | −51 | −80 | −9 | MOG | BA19 | |
| 33 | 0.003 | 12 | −8 | 77 | SFG/SMA | BA6 | |
| 700–800 | 78 | <0.001 | −39 | 41 | 11 | MFG_IFG (DLPFC—frontopolar) | BA10, BA46 |
| 23 | 0.001 | −58 | −41 | 48 | SMG | BA40 | |
| Unrelated > related. (Clusters with P < 0.001 are in bold. Minimum cluster size: 20 voxels) | |||||||
| 120–220 | 341 | <0.001 | 41 | 48 | 6 | IFG/MFG (DLPFC/OFC) | BA10/BA46 |
| 250–450 | 687 | <0.001 | 4 | 60 | 40 | SFG | BA8 |
| <0.001 | 15 | 52 | 43 | ||||
| <0.001 | 4 | 47 | 35 | ||||
| 122 | <0.001 | 49 | −59 | 50 | ANG/SMG | BA39/BA40/BA39 | |
| 123 | 0.001 | 41 | 41 | 36 | MFG | BA9 | |
| 60 | 0.001 | 68 | −39 | −16 | ITG/MTG | BA21/BA20 | |
| 23 | 0.004 | −18 | 33 | 61 | SFG/SMA | BA6 | |
| 700–800 | 146 | <0.001 | 49 | −63 | 54 | ANG | BA39 |
| 147 | 0.002 | 58 | −14 | 35 | PC/SMG | BA2/BA40 | |
Note: MFG: Middle Frontal Gyrus; DLPFC: Dorsolateral Prefrontal Cortex; Tri: Pars Triangularis; Orb: Pars Orbitalis; MOG: Middle Occipital Gyrus; SMG: Supramarginal Gyrus; STG: Superior Temporal Gyrus; ANG: Angular Gyrus; STG: Superior Temporal Gyrus; SFG: Superior Frontal Gyrus; SMA: Supplementary Motor Area: SMA; IFG: Inferior Frontal Gyrus; OFC: Orbito-Frontal Cortex; ITG: Inferior Temporal Gyrus; MTG: Middle Temporal Gyrus; PC: Precentral Gyrus.
The contrast between related and unrelated solutions yielded smaller and less distributed effects than the previous contrast (see Fig. 2). Significant differences were found in 3 clusters over time: R-PCr, during the early window, between 120 and 220 ms (t1,15 = 2.86, P = 0.012, cluster × relatedness interaction: F2,30 = 4.67, P = 0.017), L-FCr during the N400-like component, between 250 and 450 ms (t1,15 = 2.86, P = 0.012, cluster × relatedness interaction: F2,30 = 4.45, P = 0.02), and a R-FCr during the LPC component, between 700 and 800 ms (t1,15 = 3.35, P = 0.004; cluster × relatedness interaction: F2,30 = 5.22, P = 0.01). The timing of interest was determined at the sensor level. Estimated sources based on these ERFs were analyzed for the latency bands shown as relevant for each contrast.
Source Space
Correctness Effect and the IFG
The t-tests performed for each window revealed significant activations for the correct > incorrect comparison (Table 1, Fig. 3A). The incorrect > correct comparison did not yield any significant effects at P < 0.005. During the first 170–290 ms, a large activation cluster in the left IFG was shown, including BAs 44, 45, 47, and the inferior part of BA 46. Additionally, the anterior part of the left superior frontal gyrus (SFG) also showed greater activation for correct solutions. This SFG effect corresponded to the upper part of BA 8 and BA 9. In comparison with these left frontal activations (4843 voxels in total), a smaller, yet significant, activation (136 voxels) appeared in the right SFG (BA 10). During the second window of analyses, between 300 and 500 ms, activations remained in the left IFG (BA 44, BA 45, BA 47) and extended to the left temporal pole (superior temporal gyrus [STG], BA 38). Significant activations also involved the left insula in its anterior part. In the final window of analyses, between 700 and 800 ms, stronger activations to correct solutions were bilaterally distributed, involving the right IFG and right STG (temporal pole), as well as the left middle temporal gyrus (MTG) and the upper part of the left supramarginal gyrus (SMG), colliding with the postcentral gyrus.
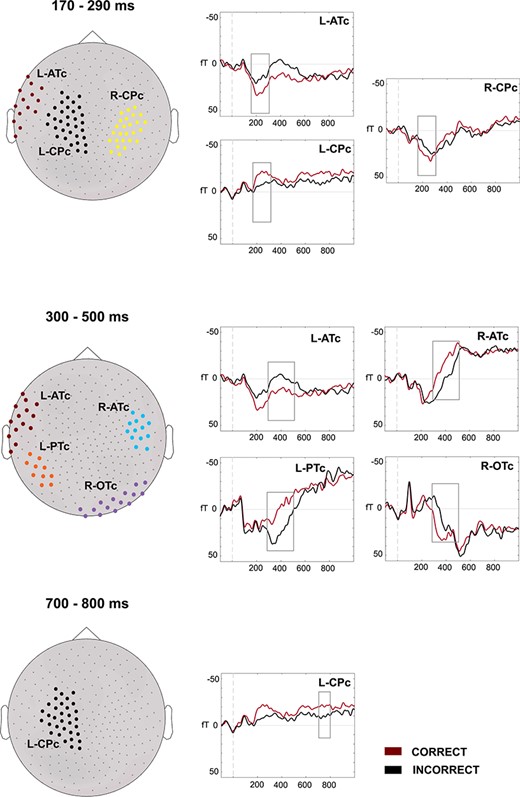
Results at the sensor space (ERFs) for the correct–incorrect contrast. The ERFs for the correct and incorrect solutions are depicted for the different sensor clusters (left). Clusters are differentiated by different colors. During the first latency band (170–290 ms), effects for correctness were shown in the L-ATc, L-CPc, and R-CPc clusters. During the second latency band (300–500 ms.), correctness effects again appeared in the L-ATc cluster, in a left cluster: L-PTc and in 2 right clusters: R-ATc and R-OTc. During the last latency band (700–800 ms.), the L-CPc cluster again showed effects of correctness. Sources were estimated on those latency bands.

Results at the sensor space (ERFs) for the related–unrelated contrast. The ERFs for the related and unrelated incorrect solutions are depicted for the different sensor clusters (left). Clusters are again differentiated by different colors. Relatedness effects appeared on cluster R-PCr in the first latency band, in L-FCr during the second latency band (250–450 ms) and in R-FCr during the last latency band (700–800 ms). Sources were estimated on those latency bands.
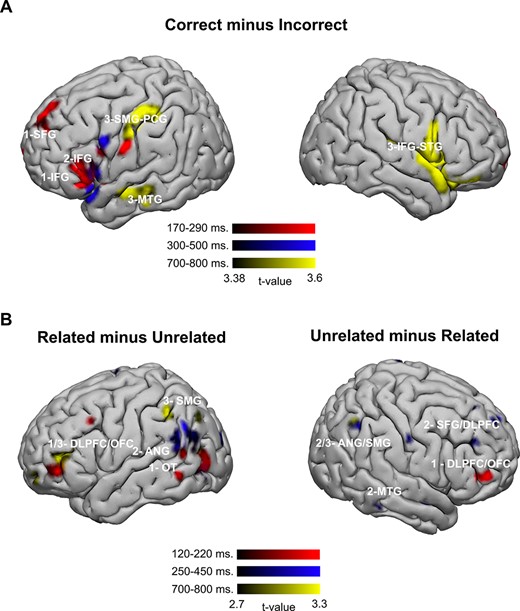
Results at the source space. (A) Correct–incorrect contrast (source amplitudes that were larger for correct than for incorrect solutions). (B) Related–unrelated contrast. Source amplitudes that were larger for the related solutions are on the left (a left-lateralized network) and source amplitudes that were larger for the unrelated solutions are on the right (a right lateralized network). OT: occipitotemporal.
Relatedness Effect: Interhemispheric Opposed Activations for Related and Unrelated Incorrect Solutions
As predicted, related more than unrelated solutions activated a group of left hemisphere areas involving the dorsolateral prefrontal cortex (DLPFC, BA 46), orbitofrontal cortex (OFC, BA 10), and left occipitotemporal areas (BA 19, BA 37, fusiform gyrus) during the initial 120–220 ms. During the 250–450-ms window, related more than unrelated solutions extensively activated the left inferior parietal lobule (IPL) including the ANG (BA 39) and the SMG (BA 40). Occipitotemporal activations continued during this window (BA 19). Only an activation in the right supplemental motor area (BA 6) was shown in the right hemisphere. In the final temporal window of analysis, 700–800 ms, activation of the left SMG (BA 40) continued, yet more dorsally. The left DLPFC and the OFC reactivated in this final window for related solutions (BA 10, BA 46) (see Table 2, Fig. 3B).
Remarkably, unrelated more than related solutions (Table 2, Fig. 3B) activated a set of right hemisphere areas that closely resembled the aforementioned left hemisphere network but contralaterally. During the initial 120–220 ms, the right DLPFC and OFC (BA10, BA46) showed the most extensive cluster. During the 250–450-ms window, a right hemisphere network arose, involving the right superior DLPFC (BA 8 and BA 9). Following in clusters size, the right ANG and the left SMG showed significant activations (BA 39 and BA 40). The contralateral right supplementary motor area (SMA) (BA 6) showed activation, similar to the network described for the related solutions, but again, with mirrored lateralization. Finally, the right MTG showed an effect for unrelated solutions. The right ANG and SMG remained activated during the last window, 700–800 ms.
In summary, the relative activations for incorrect related solutions and incorrect unrelated solutions follow mirror functional networks, in contrary hemispheres and with slightly different temporal transitions and duration of activations. However, related solutions, more than unrelated solutions, involve a left-lateralized network including the left DLPFC–OFC, the left IPL, and the right SMA. Unrelated solutions, more than related solutions, involve right lateralized network comprised of the right DLPFC–OFC, the right IPL, and the left SMA. In terms of the timing of activation, the sequence for related solutions is: left DLPFC–OFC → left IPL → left DLPFC–OFC and for unrelated solutions: right DLPFC–OFC → right IPL-DLPFC–OFC → right IPL.
Correlations Between Sources and Behavior
Correct Versus Incorrect Contrast
Averaged source activations were extracted for each significant source cluster, condition, and participant. A series of correlation analyses were performed on the difference in source activation between correct and incorrect solutions at significant source clusters and behavioral measures. For all of the sites, the coordinates for the maxima were enlarged to ROIs of 10 mm2 of extension. The difference in source activation, for each window of analysis was correlated with the behavioral difference between correct and incorrect solutions, and with overall accuracy and RT.
Two effects were found in this analysis, both related to the right hemisphere. Overall accuracy correlated with the correctness effect (r = 0.58; P = 0.019) in the right IFG (MNI: 53, 12, −3) during the final latency band (700–800 ms). This suggests that the more accurate a participant was, the greater was the involvement of the right IFG. Secondly, overall RTs negatively correlated with the other right frontotemporal cluster (MNI: 17, 10, −21) during the second latency band, meaning that faster participants showed larger activations in this brain location (r = −0.55; P = 0.029). The speed of responses was additionally correlated with activations in this brain location for correct responses, during the same time window (r = −0.54, P = 0.03). Accuracy also correlated with single activations for correct (r = 0.58; P = 0.018) or incorrect solutions (r = 0.498; P = 0.05) at this location.
Granger causality F values for the related condition
| Frontal | DLPFC/OFC (w1) | 0.0004 | 0.0081 | 0.0015 | |
| DLPFC/OFC (w3) | 0.0002 | 0.0004 | 0.0029 | ||
| Parietal | SMG/ANG (w2) | 0.0098 | 0.0014 | 0.0009 | |
| SMG (w3) | 0.0042 | 0.006 | 0.0029 | ||
| TO: FROM: | DLPFC/OFC (w1) Frontal | DLPFC/OFC (w3) | SMG/ANG (w2) Parietal | SMG (w3) |
| Frontal | DLPFC/OFC (w1) | 0.0004 | 0.0081 | 0.0015 | |
| DLPFC/OFC (w3) | 0.0002 | 0.0004 | 0.0029 | ||
| Parietal | SMG/ANG (w2) | 0.0098 | 0.0014 | 0.0009 | |
| SMG (w3) | 0.0042 | 0.006 | 0.0029 | ||
| TO: FROM: | DLPFC/OFC (w1) Frontal | DLPFC/OFC (w3) | SMG/ANG (w2) Parietal | SMG (w3) |
Note: FDR-corrected P < 0.05 are highlighted. In dark gray: F > 0.005 ([w#]: first to third time window, where the region was detected at the source level—as in Table 2).
Granger causality F values for the unrelated condition
| Frontal | IFG/DLPFC (w1) | 0.0003 | 0.0091 | 0.0076 | |
| SFG (w2) | 0.001 | 0.0043 | 0.0065 | ||
| Parietal | SMG/ANG (w2) | 0.0028 | 0.0033 | 0.0134 | |
| SMG/ANG (w3) | 0.0001 | 0.0077 | 0.0163 | ||
| TO: FROM: | IFG/DLPFC (w1) | SFG (w2) | SMG/ANG (w2) | SMG/ANG (w3) | |
| Frontal | Parietal | ||||
Note: FDR-corrected P < 0.05 are highlighted. In dark gray: F > 0.005.
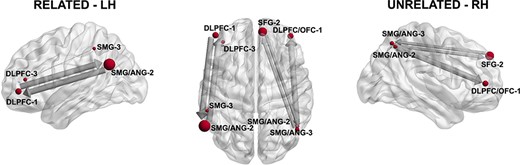
Results of the Granger Causality connectivity analysis. Only those connections whose Granger Causality values (F) were >0.005 are depicted. The size of the nodes corresponds to the extension of each cluster and is averaged in its coordinates on those cluster involving several adjacent points. Left: left hemisphere analysis for the related solutions. Right: right hemisphere analysis for the unrelated solutions.
Related Versus Unrelated Contrasts
For each significant source cluster and participant, the difference between source activations for related minus unrelated (left hemisphere) or unrelated minus related (right hemisphere) were computed. Correlations were performed with the difference in accuracy and with the difference in reaction times (related minus unrelated).
For the left hemisphere sites, the source difference (related minus unrelated) correlated with accuracy for related solutions in all of the frontal sites (left frontal DLPFC–OFC [MNI: −48, 49, −3]: r = 0.49, P = 0.05 and left frontal [MNI: −39, 41, 11]: r = 0.51, P = 0.04). The merged ROI of these 2 sites showed the same effect (r = 0.54; P = 0.03). These positive correlations suggest that the greater activation found in the DLPFC–OFC for related solutions than for unrelated solutions, the better the participant was at disregarding the related solution as incorrect. Thus, these left frontal areas might solve the competition among table candidates.
Functional Connectivity Analyses
We then analyzed how the nodes within the contralateral networks corresponding to related or unrelated solutions were functionally connected. That is, the nodes composing the 2 networks can be similar, albeit contralateral. However, how are their functional dynamics similar or different?
The 2 main parietal source clusters and the 2 main frontal source clusters in each network (Table 2) were explored as per Granger causal connectivity (Tables 3–4 and Fig. 4) in the time domain, during the whole interval, 120–800 ms. Connectivity was computed on the direct source time for related or unrelated solutions. In the left hemisphere, a bidirectional causality loop was revealed between the DLPFC (first latency band) and the ANG (second latency band). Then, DLPFC (second latency band) had a weaker link toward the SMG (third latency band). Hence, the most remarkable pattern was a strong bidirectional interdependence between the DLPFC–OFC and IPL.
For unrelated solutions, parietal nodes mostly Granger caused the activity of both frontal sites. The SFL/DLPFC (second latency band) and the SMG/ANG (third latency band) were bidirectionally connected, albeit with less strength than in the loop in the related condition, the strongest link here was a unidirectional link from SMG/ANG to the DLPFC. Therefore, what is most remarkable for the unrelated condition, is the relevance of the IPL Granger-causing activity in the 2 frontal sites, more strongly in the DLPFC/OFC.
Discussion
The current study addressed the neurofunctional networks behind calculation, through the analysis of brain magnetic activity during a verification task. Our manipulation of correctness and relatedness allowed us to observe 3 central processing states explicitly and to uncover their neural correlates and dynamics over time. For correct solutions, the participants find a perfect match and no interference. In table-related incorrect solutions, a process of interference must occur and has to be resolved. In table unrelated incorrect solutions, preinhibition from the operands and a faster disregard of this solution occurs, with no table-related competition.
Consistent with previous literature (Ashcraft 1992; Campbell 1995; Niedeggen and Rösler 1999; Niedeggen et al. 1999), at the behavioral level the fastest responses were found in matching correct solutions. Responses on incorrect related solutions were slower than on unrelated solutions, reflecting the presence of interference and competition. Thus, our findings replicated the effects observed in similar designs. What are the neurofunctional bases of these effects?
Significant differences in the ERFs for correct versus incorrect items appeared as soon as 170 ms after the presentation of the solution, in bilateral parieto-central and left temporal sensors. This early component was followed by a M400-like effect (but see Dickson and Federmeier 2017) between 300 and 500 ms in bilateral sensors. Finally, an LPC was shown, localized in a left parieto-central cluster. Hence, over time, differences between incorrect and correct solutions were localized, at the sensor level, in both hemispheres. ERFs varied in terms of the polarity of components due to reversed field directions. However, their succession matched, as expected, with those found by other studies using ERPs for the N400–LPC complex (Niedeggen and Rösler 1999; Niedeggen et al. 1999; Salillas and Wicha 2012). The early effects have been interpreted as reflecting estimation mainly in comparison tasks (Dehaene 1996; Temple and Posner 1998; Libertus et al. 2007), where the distance between 2 numerosities is computed. Therefore, estimation processes might be implied during verification. The arithmetic N400 and the LPC have been interpreted, respectively, reflecting automatic activation spread from the operands, and a more controlled plausibility checking (Johnson 1986; Donchin and Coles 1988). These components, to some extent, respond to similar mechanisms to those found in priming language tasks (Kutas and Hillyard 1989; Friederici 1995).
The ERFs to related and unrelated solutions differed in a similar succession of components, albeit in a more reduced number of sensors and in different clusters. The early component started at 120 ms and was localized in a right parieto-central cluster and occipital sensors. Estimation processes then differed between related and unrelated solutions, even when the distance between the given solution and the retrieved solution was equivalent. A left fronto-central cluster then showed an M400-like effect, with a larger amplitude for unrelated solutions. Finally, the LPC appeared localized in a right fronto-central cluster, with a larger amplitude for unrelated solutions. The amplitude of the M400 varies as a function of the associative distance between retrieved and given solutions. Related solutions carry more interference, due to associative links with the operands. The LPC, however, was larger for unrelated solutions. Again, this should be interpreted as a reflection of the plausibility judgment on the presented solution, which differs between related and unrelated solutions.
All of these effects have been previously studied using other online measures. Crucially, MEG allowed us to map activations over time. Three clearly functionally and anatomically differing networks emerged in the source analysis.
The IFG and Selection Processes During Verification
A perfect match of correct solutions to the precedent arithmetic context, as compared with mismatching solutions, elicited large activations in the left IFG, across the first 2 temporal windows. This suggests that spreading activation from the operands has occurred, and that, for correct solutions, the final selection among candidates might be solved in a frontal control hub (IFG) (Chiou et al. 2018). Similarly to the language domain (Thompson-Schill et al. 1997, 1998), when the degree of selection effort is experimentally manipulated, its resolution relies on the IFG. This effect extended to pars orbitalis and the left temporal pole, which is also frequently found for semantic networks (Jackson et al. 2016; Chiou et al. 2018). The role of the left IFG has been emphasized before in arithmetic verification tasks. De Visscher and collaborators (De Visscher et al. 2018) showed how its activation was related to higher proactive interference and linked to individual differences in arithmetic fluency. The left IFG might thus handle selection processes towards a correct matching item.
There is an additional component detected in our data, highly related to final behavior—the role of the right IFG at later stages of processing. The interpretation of this component comes from its relation to behavior. These activations correlated with speed and accuracy—the more accurate a participant was, the greater was the involvement of the right frontoinsular cortex, both for correct and incorrect items. Moreover, the faster the participant, especially with correct responses, the greater the involvement of the right IFG. The right IFG has been related to attentional control response to relevant stimuli, including inhibition needed for correct responses (Hampshire et al. 2010; Houdé et al. 2010; Raccah et al. 2018). In our study, the resolution of competition occurred in the left IFG in a fast, and possibly, automatic manner, and the right frontal areas might supplement the left IFG in the acknowledgment of implausibility of the solutions, speeding up the response.
A Left Frontoparietal Network for the Resolution of Interference
The most interesting findings were seen in the contrast between related and unrelated solutions. Initial processes triggered by the presentation of (preactivated) high interfering related solutions relied first on the left DLPFC-OFC and the left occipitotemporal cortex. They were followed by the left IPL, with a final reactivation of the left DLPFC-OFC. Thus related, more than unrelated, solutions activate a network residing in the left hemisphere.
The sequence of events might be the following: spreading activation to related and correct solutions would begin with the presentation of the operands. When related solutions are encountered, they would be already partly activated, and this activation would have to be overcome. This preactivation explains the involvement of the left DLPFC-OFC and the left IPL, the store for arithmetic facts, as has been previously shown (Dehaene et al. 2003; Delazer et al. 2003; Ischebeck et al. 2007). The resolution of the competition needs the frontal areas. As the correlations with behavior suggest, the greater the use of left DLPFC-OFC, the more accurate the participant is in overcoming the arithmetic competition and correctly disregarding preactivated incorrect solutions. The involvement of the DLPFC in arithmetic processes has also been previously reported (Menon 2015). Here, its time course and functional relevance are clarified, and an interplay with the ipsilateral IPL is highlighted.
Interestingly, functional connectivity analyses show that brain activations for related solutions responded to a strong bidirectional loop between left IPL and left DLPFC-OFC. In turn, the DLPFC-OFC would solve the competition among candidates sustained by the IPL. Through this loop, arithmetic competition would be resolved dynamically. This explains why the activations of DLPFC-OFC relates to successful arithmetic behavior—without the involvement of the DLPFC, and an isolated action of the left IPL, the competition likely could not be resolved.
A Right Frontoparietal Network for Mismatching Solutions
The previously discussed system differs from the network responsive for disregarding unrelated solutions, which would be sustained by the right hemisphere. In some respect, it resembles the one located in the left hemisphere for related solutions. In contrast, unrelated solutions do not match an organized set of stored table-related solutions. They are unexpected given the preceding arithmetic context. A different system must process them. Interhemispheric differences for the DLPFC are a question of debate, however, and the role of a right frontoparietal network has been previously linked to unexpected events (Shulman et al. 2009). Indeed, a predominance of the left visual field—right brain hemisphere for incorrect unrelated items has been recently suggested (Dickson and Federmeier 2017). Functional connectivity data showed that in contrast to the left-lateralized network, the brain dynamics of the right frontoparietal system are dominated by right parietal areas.
A final comment must concern the fact that the majority of participants were female. A few neuroimaging studies (Keller and Menon 2009; Pletzer 2016) have shown that, despite an overall overlap, there are also differences in the brain bases for simple and complex multiplication, which contrast with similar behavior between genders. This mismatch between behavior and brain signatures has been attributed to more efficient use of cognitive resources by females. In our data, if gender differences had fundamentally affected the present simple calculation task (Pletzer 2016), then the prevalent role of the IPL should not have appeared; yet, it might have extended further with more male participants. Moreover, neuroimaging data contrasting gender, focusing on the relatedness effect, are lacking. Thus restricting analysis to this specific contrast might have neutralized a possible impact of gender, given the specificity of the measured process. On the other hand, a detailed evaluation of gender differences for math (Gallagher and Kaufman 2005) shows that despite the fact that many studies have addressed its effects in math performance, they are attributed to a complex interplay of factors (ethnicity, socialization, math anxiety, etc.) and not to actual math system differences between genders. Indeed, individual differences in ability and achievement within gender are probably much larger than the differences between the genders.
Conclusion
The study sheds light on the neural bases of simple multiplication, targeting the spread of activation within arithmetic memory networks. Three brain mechanisms that likely act together in spontaneous, simple calculation were detected. The left hemisphere handles arithmetic competition between automatically activated table-related and correct responses, based on the interaction between the left DLPFC-OFC and IPL. Through a mirror network and a pivotal role of the right IPL, the right hemisphere serves the processing of unexpected solutions. Which concurs with our awake surgery data (Semenza et al. 2017), showing differential involvement of the 2 hemispheres in calculation. We also showed the overall importance of the left IFG in selection processes and of the right IFG on executive processes facilitating the ultimate response. The study further clarifies the neural dynamics of these networks, uncovering a left-lateralized frontoparietal loop, crucial for a process inherent to a simple calculation, namely, the resolution of interference.
Notes
Conception and design of the work: E.S. and C.S.; acquisition of data: E.S., G.A., S.Z., S.T., F.P.; analysis of data: E.S.; interpretation of data: E.S. and C.S.; drafted the work: E.S. and C.S; revision of the draft: E.S., C.S., G.A. The datasets generated or analyzed during the current study are available from the corresponding author on reasonable request. Conflict of Interest: None declared.
Funding
The European Union’s Horizon 2020 research and innovation programme under the Marie Skłodowska-Curie grant agreement No. 793071 to E.S.; Italian Ministry of Health grant number GR-2018-12366092 to G.A. The Italian Ministry of Health to F.P., S.D.T., and S.Z.
References
Author notes
Giorgio Arcara and Carlo Semenza share the senior authorship.