


Abstract
The superior temporal sulcus (STS) is a crucial hub for speech perception and can be studied with high spatiotemporal resolution using electrodes targeting mesial temporal structures in epilepsy patients. Goals of the current study were to clarify functional distinctions between the upper (STSU) and the lower (STSL) bank, hemispheric asymmetries, and activity during self-initiated speech. Electrophysiologic properties were characterized using semantic categorization and dialog-based tasks. Gamma-band activity and alpha-band suppression were used as complementary measures of STS activation. Gamma responses to auditory stimuli were weaker in STSL compared with STSU and had longer onset latencies. Activity in anterior STS was larger during speaking than listening; the opposite pattern was observed more posteriorly. Opposite hemispheric asymmetries were found for alpha suppression in STSU and STSL. Alpha suppression in the STS emerged earlier than in core auditory cortex, suggesting feedback signaling within the auditory cortical hierarchy. STSL was the only region where gamma responses to words presented in the semantic categorization tasks were larger in subjects with superior task performance. More pronounced alpha suppression was associated with better task performance in Heschl’s gyrus, superior temporal gyrus, and STS. Functional differences between STSU and STSL warrant their separate assessment in future studies.
Introduction
Recent advances in neuroscience have emphasized the importance of the superior temporal gyrus (STG) and the subjacent superior temporal sulcus (STS) in speech and language processing, functions previously attributed to the classically defined Wernicke’s area at the temporo-parietal junction (Hickok 2009; Price 2012; Beauchamp 2015; Chang et al. 2015; Venezia et al. 2017; Abrams et al. 2020). In the current scheme, acoustic attributes of speech are represented in core auditory cortex (posteromedial portion of Heschl’s gyrus, HG) (Steinschneider et al. 2013, 2014), phonemic attributes are extracted in nonprimary auditory cortex on the lateral STG (Mesgarani et al. 2014; Yi et al. 2019), and acoustically invariant representations of speech are maintained in auditory-related cortex in the STS (Okada et al. 2010).
Activation by speech is not uniform throughout the STS. Results consistently define its auditory responsive area as bounded by the anterior and posterior extent of HG. This region has variously been called central STS (Belin et al. 2000), middle STS (Okada et al. 2010; Deen et al. 2015), middle portion of the STS stem (Liebenthal et al. 2014), and STS1 and STS2 (Zachlod et al. 2020). More anterior regions have been proposed to mediate higher spoken and written language functions (Hickok 2009; Deen et al. 2015). More posterior regions are considered functionally diverse, contributing to auditory–visual integration, semantic processing, auditory short-term memory, and perception of facial expressions, graphemes, and biological motion (Leff et al. 2009; Liebenthal et al. 2014; Venezia et al. 2017).
Within the auditory responsive area of the STS, the roles of the upper and the lower bank (henceforth referred as STSU and STSL, respectively) in speech processing are unclear. One methodological reason limiting a clearer understanding of their respective roles is the fundal location of draining veins in the sulcus, which are major contributors to the blood oxygenation level-dependent (BOLD) response as measured by functional magnetic resonance imaging (fMRI) (Wilson et al. 2018). In the few studies that have distinguished STSU from STSL, listening to speech primarily activated STSU (Belin et al. 2000; Leaver and Rauschecker 2010; Deen et al. 2015; Zachlod et al. 2020). However, Wilson et al. (2018) reported the activation of STSU by both intelligible and unintelligible speech and STSL only when speech was intelligible.
The degree of hemispheric asymmetry in the STS during speech processing is likewise debated. Many studies have identified the preferential activation of the left STS during sublexical auditory speech processing (e.g., Spitsyna et al. 2006; Lindenberg and Scheef 2007; Leaver and Rauschecker 2010; Turkeltaub and Coslett 2010; Liebenthal et al. 2014; Zachlod et al. 2020). Other studies stress that STS activation is bilateral (Warburton et al. 1996; Hein and Knight 2008; Huth et al. 2016) or that speech processing in the two hemispheres occurs but using different windows of integration (Hickok and Poeppel 2007; Obleser et al. 2008; Hickok 2009; Price 2012; Hurschler et al. 2015). Finally, greater activation of the right STS by intelligible speech has also been reported (Belin et al. 2000; Okada et al. 2010).
The STS is also activated during both self-initiated speech production and repetition (Tremblay and Small 2011; Hickok 2012; Price 2012). Activation during speaking and listening can occur in overlapping regions in the STS (Papathanassiou et al. 2000). Outstanding questions include whether the STS is bilaterally active during speaking (Warburton et al. 1996; Hickok 2012), bilaterally active but strongly biased toward the language-dominant hemisphere (Papathanassiou et al. 2000; Price 2012), or solely active in the dominant hemisphere (Paus, Marrett, et al. 1996a; Paus, Perry, et al. 1996b; Fridriksson et al. 2018). The respective roles of STSU and STSL during speech production also remain an open question.
These unresolved issues emphasize the need for investigations using invasive electrophysiology. Intracranial electroencephalography (iEEG) recordings have a higher spatial concordance with language mapping results obtained from electrical stimulation than fMRI (Roux et al. 2003; Sinai et al. 2005, 2009; Spena et al. 2010; Wang et al. 2016). Furthermore, iEEG has better temporal resolution to resolve the sequential activation of critical areas involved in speech processing. This approach has already provided invaluable insights into speech processing at the level of HG and the lateral STG (e.g., Mesgarani et al. 2014; Steinschneider et al. 2014; Berezutskaya et al. 2017; Nourski et al. 2017; Patel et al. 2018). The current study builds upon this foundation and provides the first detailed investigation of the STS in a large cohort of adult subjects.
There have only been a handful of iEEG studies of the STS. Lachaux et al. (2007) described speech-related responses at a single STSU recording site. Perrone-Bertolotti et al. (2012) described four sites in STSU that exhibited selective responses to speech regardless of its intelligibility. Uno et al. (2015) described increased responses to mismatched auditory and visual speech cues using subdural grid electrodes placed over the STS. However, cytoarchitectonically defined STS does not extend onto the lateral surface of the temporal lobe (Zachlod et al. 2020). To date, the most extensive STS electrode coverage has been reported by Blenkmann et al. (2019). This study utilized a passive deviance detection paradigm using only pure tones and did not provide information on the location of recording sites along the posterior–anterior (PA) and medial-lateral (ML) axes of the STS, or their location in either STSU or STSL.
Thus, the goals of the present study were to provide a detailed examination of human STS using language-related paradigms, and with special reference to comparing activity in its upper and lower banks, along its PA and ML axes, and between the two hemispheres. This examination was made possible by the use of multicontact depth electrodes that traversed STSU or STSL en route to clinically relevant mesial temporal lobe locations (Supplementary Fig. 1). Response patterns in the STS were compared with those in canonical auditory cortex, including core auditory cortex in the posteromedial portion of HG (HGPM) and noncore auditory cortex in the anterolateral portion of HG and STG. This study took advantage of two complementary experimental paradigms—a semantic target detection task and a dialog-based protocol—to study the STS. Both paradigms had been successfully used to characterize speech-related activity within the earlier processing stages in auditory cortex (Steinschneider et al. 2014; Nourski et al. 2016, 2017). Finally, this study utilized the analysis of gamma-band activity (30–150 Hz) and alpha-band suppression (8–14 Hz) as complementary measures of STS activation during speech processing (Crone et al. 2001; Billig et al. 2019; Nourski et al. 2020).
Methods
Subjects
Experimental subjects were 29 neurosurgical patients (16 male, 13 female, age 18–59 years old, median age 34 years old) diagnosed with medically refractory epilepsy undergoing chronic iEEG monitoring to identify potentially resectable temporal lobe seizure foci. Demographic data for each subject are presented in Supplementary Table 1. The hemisphere with predominant electrode coverage is indicated by the prefix of the subject code: L for left (N = 11 subjects), R for right (N = 14), and B for bilateral (N = 4).
All subjects were native English speakers. Intracranial recordings revealed that auditory cortical areas within HG, STG, or STS were not epileptic foci in any subject. Research protocols were approved by the University of Iowa Institutional Review Board and the National Institutes of Health. Written informed consent was obtained from all subjects. Research participation did not interfere with acquisition of clinically required data, and subjects could rescind consent at any time without interrupting their clinical evaluation.
All subjects underwent audiometric evaluation before the study, and none were found to have hearing deficits that should impact the findings presented in this study. Out of 29 subjects, 19 had pure-tone thresholds within 25 dB HL between 250 Hz and 4 kHz (Supplementary Table 2). Word recognition scores, as evaluated by spondees presented via monitored live voice, were 96/88% (left/right ear) in subject R334, 96/92% in R369, 88/100% in R399, 92/92% in L423, 88/96% in L439, and ≥96% in all other tested subjects. Speech reception thresholds were within 20 dB HL in all tested subjects, including those with tone audiometry thresholds outside the 25 dB HL criterion.
Stimuli and Procedure
Experimental stimuli were speech and nonspeech sounds, presented in target detection and passive listening tasks. Stimuli were delivered via insert earphones (ER4B, Etymotic Research, Elk Grove Village, IL) that were integrated into custom-fit earmolds. Stimuli were presented with an interstimulus interval chosen randomly within a Gaussian distribution (mean interval 2 s; standard deviation [SD] = 10 ms). Prior to each experiment, the subjects were presented with a random-sequence preview of stimuli to ensure that volume was at a comfortable level (typically, 55–65 dB SPL) and that they understood task requirements. Additional data were acquired during a dialog-based task based on the Mini-Mental State Exam (Folstein et al. 1975; Nourski et al. 2016). Experiments were carried out in a dedicated electrically shielded suite in the University of Iowa Clinical Research Unit. The subjects were comfortably reclining in a hospital bed or an armchair. Not all subjects participated in all paradigms due to clinical constraints (see Supplementary Table 1).
Stimuli used in target detection tasks were monosyllabic words and complex tones (Steinschneider et al. 2014; Nourski et al. 2017). The words were “cat,” “dog,” “five,” “ten,” “red,” and “white”, obtained from TIMIT (Garofolo et al. 1993) and LibriVox (http://librivox.org/) databases. A total of 20 unique exemplars of each word were presented in each task: 14 spoken by different male and 6 by different female talkers. Each task also included 5 novel target and 5 novel nontarget monosyllabic words, presented to maximize the subjects’ reliance on semantic cues and minimize reliance on phonemic cues (i.e., initial consonants unique to a semantic category). Responses to these novel words are beyond the scope of this study. Additionally, the stimulus set included complex tones with fundamental frequencies of 125 (28 trials) and 250 Hz (12 trials). All stimuli had a duration of 300 ms and were presented in random order in target detection tasks. Targets were either complex tones or words belonging to specific semantic categories (animals or numbers). The subjects’ task was to push a response button on a Microsoft SideWinder game controller (Microsoft) whenever they heard a target sound. The subjects were instructed to use the hand ipsilateral to the hemisphere in which the majority of electrodes were implanted. This was done to reduce the contributions of preparatory, motor, and somatosensory responses associated with the button press to recorded neural activity.
A passive listening paradigm was used as a control for comparison with neural activity associated with the active target detection tasks. Stimuli used in passive listening task were consonant-vowel (CV) syllables, used previously by Steinschneider et al. (1999, 2005, 2011) and Nourski et al. (2015). Speech syllables /ba/, /da/, /ga/, /pa/, /ta/, and /ka/ were constructed using KLSYN88a speech synthesizer (Klatt and Klatt 1990), contained 4 formants, and were 175 ms in duration. The unvoiced CV syllables (/pa/, /ta/, and /ka/) were identical to their voiced counterparts (/ba/, /da/, and /ga/) except for an increase in the voice onset time from 5 to 40 ms. Stimuli were presented in a random order, and a total of 50 trials was collected for each CV syllable.
Finally, subjects participated in a conversation-based paradigm, which included the portions of the Mini-Mental State Exam (Folstein et al. 1975) and additional tasks (digit span, spelling, rhyming, abstract naming, verbal analogies, sentence comprehension, fund of knowledge, and naming of favorite items) (Nourski et al. 2016). Utterances spoken by the interviewer and the subject generally followed a question-answer format and were parsed using Praat software version 5.4.16 (Boersma 2001) based upon specific phrases and natural breaks in the conversation. This paradigm was typically completed within 15–20 min.
Recording
Analysis of intracranial electrophysiology data focused on iEEG recordings made from HG, the lateral STG, and STS. Details of electrode implantation, recording, and iEEG data analysis have been previously described in depth (Howard et al. 1996; Howard et al. 2000; Reddy et al. 2010; Nourski and Howard 2015). In brief, depth electrode arrays (4 or 8 macro contacts, spaced 5 mm apart) were implanted in each subject stereotactically into HG, along its anterolateral-to-posteromedial axis. Electrodes implanted in HG provided valuable diagnostic and prognostic data characterizing the seizure focus within the temporal lobe (see Nagahama et al. 2018, for details). Subdural grid arrays were implanted over the lateral surface of the cerebral hemisphere, including the auditory cortex on the lateral STG. The grid arrays consisted of platinum-iridium disc electrodes (2.3-mm exposed diameter) embedded in a silicon membrane and arranged in a 2 × 8, 4 × 8, or 8 × 12 configuration with 5- or 10-mm center-to-center interelectrode distance. Finally, depth electrodes targeting mesial temporal lobe structures contained 4–8 recording contacts along the shaft, permitting sampling of the STS (see Supplementary Fig. 1).
A subgaleal contact was used as a reference in all subjects. The extent of electrode coverage varied across the subject population based on patient-specific clinically determined electrode implantation plans (see Supplementary Table 1). The choice of insertion points for depth electrodes was in part limited by the presence of subdural arrays overlying temporal cortex, and thus, posterior regions of the STS were typically not accessible. Electrodes remained in place under the direction of the patients’ treating neurologists.
In subjects L282 through L357, data acquisition was controlled by a TDT RZ2 real-time processor (Tucker-Davis Technologies); in subjects R369 through L477, data acquisition was performed using a Neuralynx Atlas System (Neuralynx). Recorded data were amplified, filtered (0.1–500 Hz bandpass, 5 dB/octave rolloff for TDT-recorded data; 0.7–800 Hz bandpass, 12 dB/octave rolloff for Neuralynx-recorded data), digitized at a sampling rate of 2034.5 Hz (TDT) or 2000 Hz (Neuralynx), and stored for subsequent offline analysis. The conversation between the interviewer and subject during the dialog-based experiment was recorded simultaneously using an in-room Behringer ECM 8000 microphone (Behringer, Willich, Germany) and digitized at a sampling rate of 12 207 Hz in subjects R316, R320, R322, R334, B335, L357, B362, and 16 000 Hz in all other subjects (see Supplementary Table 1).
Data Analysis
Reconstruction of the anatomical locations of the implanted electrodes and their mapping onto a standardized set of coordinates across subjects was performed using FreeSurfer image analysis suite (https://surfer.nmr.mgh.harvard.edu) and in-house software. Subjects underwent whole-brain high-resolution T1-weighted structural MRI scans (resolution 0.78 × 0.78 mm, slice thickness 1.0 mm) before electrode implantation and again immediately after implantation. Subjects additionally underwent thin-sliced volumetric computerized tomography scans (resolution 0.51 × 0.51 mm, slice thickness 1.0 mm) postimplantation. Locations of recording sites were determined within postimplantation MR image space according to electrode-induced susceptibility artifacts and through a comparison with intraoperative photographs and co-registered postimplant CT images. Contact locations were then transferred from the postoperative image space to the preoperative MRI image space using a manually guided thin-plane spline warping, for which control points were selected according to the visible correspondence between pre and postimplant imaging, as needed, to correct for nonlinear postoperative tissue distortion. For group analyses, locations of recording sites were projected into standard Montreal Neurological Institute (MNI) space through a 12-parameter affine linear co-registration of the pre-operative T1-weighted image with the ICBM152 6th generation nonlinear template brain, using the FIRST pipeline, implemented in the FSL toolbox (Jenkinson and Smith 2001). Left hemisphere MNI x-axis coordinates (xMNI) were multiplied by (−1) to map them onto the right-hemisphere common space. Distributions of recording sites along the ML and PA axes were characterized in terms of mean MNI coordinates and their SDs. Comparisons between the two hemispheres and pairwise comparisons across regions of interest (ROIs) were made using two-sample two-tailed t-tests. The five ROIs examined in this study were HGPM, HGAL, STG, STSU and STSL.
Data analysis was performed using custom software written in MATLAB Version 2020a programming environment (MathWorks). Recordings were downsampled to 1000 Hz for computational efficiency and denoised using a demodulated band transform-based procedure (Kovach and Gander 2016). Voltage deflections exceeding 5 SDs from the across-block mean for each recording site were considered artifacts, and trials containing such deflections were excluded from further analysis. To ensure that canonical auditory cortex did not exhibit aberrant responses in any of the subjects, a series of standard protocols was performed to confirm that data from each subject conformed to the previously published corpora (Brugge et al. 2009; Nourski et al. 2013, 2014, 2015).
Time–frequency analysis was implemented using the demodulated band transform-based algorithm (Kovach and Gander 2016). This was done by computing the discrete Fourier transform over the entire duration of the recording, segmenting the discrete Fourier transform into overlapping windows of 1-, 2-, 4-, 10-, and 20-Hz bandwidth for theta (4–8 Hz), alpha (8–14 Hz), beta (14–30 Hz), low gamma (30–70 Hz), and high gamma (70–150 Hz) bands, respectively. Event-related band power (ERBP) was calculated by log-transforming power for each center frequency and normalizing it to a baseline value measured as the mean power in the prestimulus reference interval (100–200 ms before stimulus onset) for data obtained in target detection and passive listening tasks, and as the mean power in the entire recording block in the dialog-based experiment.
ERBP spectral profiles were examined by averaging ERBP values for each center frequency between 4 and 150 Hz within 50–350 ms after stimulus onset. To determine gamma iEEG frequencies associated with largest ERBP values, time–frequency analysis of responses to words in all target detection tasks (complex tone, animal and number target conditions) was carried out for center frequencies from 30 to 150 Hz in 1 Hz steps. For each recording site, ERBP values for each center frequency were averaged within the 50–350 ms poststimulus window, and an inverse quadratic function was fit to the iEEG frequency versus ERBP data using the MATLAB polyfit function. Gamma ERBP peak frequencies were measured as the peak of the quadratic fit at sites where the leading coefficient of the fit was smaller than −0.0001, as less negative coefficients were indicative of an absence of a discernable peak in the gamma ERBP spectral profile.
Subsequent quantitative analyses of cortical activity focused on gamma and alpha ERBP, averaged within the 50–350 and 350–650 ms poststimulus windows, respectively. For each recording site, significance of gamma responses and alpha suppression was established using one-tailed one-sample t-tests on single-trial ERBP values. Prevalence of responses was defined as the percentage of sites within each ROI that exhibited significant responses and compared between ROIs using Fisher exact tests.
Stimulus and target effects were defined as differences in ERBP between responses to nontarget words versus complex tones and between target versus nontarget words, respectively. For each recording site, significance of these effects was established using one-tailed two-sample t-tests on single-trial ERBP values. Prevalence of stimulus and target effects was defined as the percentage of sites within each ROI that exhibited significant effects and compared between ROIs using Fisher exact tests.
Performance in the tone detection and semantic categorization tasks was described in terms of hit rate sensitivity index (d′) and reaction times (RTs); differences in performance were examined using Wilcoxon rank sum tests. Statistical significance of differences in gamma and alpha ERBP between subjects who had above-average (>82% hit rate) and below-average (<82% hit rate) performance in the semantic categorization tasks was established using Wilcoxon rank sum tests.
Gamma ERBP onset latencies were measured within 350 ms after stimulus onset as the time at which the lower limit of gamma ERBP 95% confidence interval exceeded 0 dB relative to the prestimulus mean and remained positive for at least 30 ms, following the approach of Nourski et al. (2014). Onset latencies of alpha ERBP suppression were measured within 650 ms after stimulus onset as the time at which the upper limit of alpha ERBP 95% confidence interval was below 0 dB relative to the prestimulus mean and remained negative for at least 30 ms.
Hemispheric asymmetries were examined by adding hemisphere as a fixed effect to the model and comparing the model fit using theoretical likelihood ratio tests. Adding hemisphere did not significantly improve model fits for either STSU or STSL (P > 0.05), with the exception alpha suppression within STSL. Accordingly, the LME models that described alpha suppression in STSL in the semantic categorization task and alpha suppression talker bias in the dialog-based paradigm were modified to include the fixed effect of hemisphere, modeled as a two-level contrast (left vs. right). Adding interactions between main effects did not improve the quality of the models (P > 0.05).
The fixed effects of stimulus and target were modeled as two-level contrasts (stimulus effect: nontarget tones vs. nontarget words; target effect: nontarget words vs. target words). In all LME model-based analyses, subject was included as a random effect to minimize the possibility that significant fixed effects were biased by single-subject contributions. The quality of models was evaluated using Akaike Information Criterion (AIC).
To control for multiple comparisons between multiple ROI pairs, positive false discovery rate for multiple hypothesis testing was estimated using the approach of Benjamini and Hochberg (1995), and P-values were adjusted as the measures of hypothesis testing error.
Results
Electrode Coverage
Results are based upon analysis of data from 29 subjects who had electrode coverage of the STS. Typically, concurrent recordings were available from HG or the lateral STG (see Supplementary Table 1). Nineteen subjects contributed a total of 64 and 63 sites in STSU and STSL, respectively. Twenty-four subjects had depth electrodes within core auditory cortex (HGPM, 118 sites), and 20 subjects had coverage of adjacent non-core auditory cortex (HGAL, 95 sites). In 25 subjects, subdural grid arrays provided the coverage of posterior and middle portions of the lateral STG (395 sites in total); the anterior boundary of which approximated the anterior extent of HG.
The distribution of recording sites in all five ROIs across all subjects is plotted in standard MNI coordinate space in Figure 1A. Distributions of recording sites within the STS along the |xMNI| (ML) axis and distributions of all recording sites along the yMNI (PA) axis are shown in Figure 1B. There was no systematic bias in depth within the sulcus between STSU and STSL (mean |xMNI| values and their SDs 53 ± 7 and 53 ± 5 mm for STSU and STSL, respectively; P = 0.88) (Fig. 1B, left panel), nor was there difference between hemispheres (left STSU: 53 ± 6 mm, right STSU: 53 ± 8 mm, P = 0.22; left STSL: 52 ± 4 mm, right STSL: 53 ± 6 mm, P = 0.77). The PA extent of coverage was also comparable between the two banks (mean yMNI values and their SDs −10 ± 14 and −7 ± 10 mm for STSU and STSL, respectively; P = 0.24) (Fig. 1B, right panel). Coverage of STSU along the yMNI axis was comparable between the two hemispheres (left: −9 ± 13 mm; right: −12 ± 15 mm; P = 0.32). There was a bias toward more posterior coverage of the left STSL (−12 ± 11 mm) compared with the right (−5 ± 8 mm) (P = 0.0023). The PA distribution of sites within STSU and STSL was overall more anterior compared with that of HG (−17 ± 9 mm) and STG (−23 ± 14 mm) (P < 0.0001 for all four comparisons).

Electrode coverage of HG, STG, and STS in all 29 subjects. (A) Locations of recording sites, color-coded according to the ROI, are projected onto sagittal, coronal, and axial planes in MNI coordinate space. Lateral, front and bottom-up views of the average Freesurfer brain are shown for reference. (B) Distribution of STS recording sites in the left (L) and right (R) hemisphere along the ML axis (|xMNI|) and all sites along PA axis (yMNI) (left and right panel, respectively). In each violin plot, colored circles represent individual recording sites, white circle denotes the median, horizontal line denotes the mean, bar denotes Q1 and Q3, and whiskers show the range of lower and higher adjacent values (i.e., values within 1.5 interquartile ranges below Q1 or above Q3, respectively). Shaded rectangles denote the two cytoarchitectonic areas within the STS (olive: STS1, teal: STS2), defined by Zachlod et al. (2020). Green symbols with error bars depict coordinates (mean and SD) of the two functional clusters within the STS as defined by Hein and Knight (2008). Vertical bars on the far right denote the three functional subdivisions of the left STS (middle, posterior and terminal STS: fmSTS, fpSTS, ftSTS) defined by Liebenthal et al. (2014).
Electrode coverage of the STS was depicted with reference to STS subdivisions as defined by Hein and Knight (2008), Liebenthal et al. (2014) and Zachlod et al. (2020) (see Fig. 1B). The latter study is notable for defining the auditory-related cortex of STSU and STSL based on cytoarchitectonic criteria (as areas STS1 and STS2, respectively). STS coverage depth in the present study, defined by |xMNI| values, was comparable to the two STS activation clusters as previously defined by Hein and Knight (2008). The distribution of recording sites along the yMNI axis overlapped with fmSTS, a region whose primary functionality includes auditory processing, speech perception, and production (Liebenthal et al. 2014). Electrode coverage extended beyond the anterior border of functional subdivisions defined by Hein and Knight (2008) and Liebenthal et al. (2014) into a region involved in semantic processing (Price 2012). The PA extent of electrode coverage in the present study largely overlapped with the two cytoarchitectonically defined auditory-related STS areas (Zachlod et al. 2020; https://jubrain.humanbrainproject.eu). In summary, the electrode coverage of the STS was appropriate for studying iEEG signatures of speech processing.
Spectral Profiles of Responses
Differences in cytoarchitectonic organization between the STS and HGPM, HGAL and STG may result in different degrees of activation within low- and high-gamma iEEG frequency bands when each region is activated by sound (Crone et al. 2011). Arbitrary and exclusive use of high gamma as a metric for STS activation without first empirically testing the adequacy of this measure might lead to biased conclusions regarding speech-related activity in this brain region. Thus, spectral profiles of ERBP were evaluated by examining iEEG power changes in response to monosyllabic words presented during target detection tasks (Supplementary Fig. 2A).
A shift toward the low-gamma band (γlow; 30–70 Hz) characterized activity in STSU and STSL when compared with the canonical auditory areas (Supplementary Fig. 2B). Mean peak frequencies (±SD) were 101 ± 18 Hz in HGPM, 85 ± 19 Hz in HGAL, 95 ± 14 Hz in STG, 82 ± 17 Hz in STSU, and 90 ± 12 Hz in STSL. ERBP peak frequencies within STSU and STSL were significantly lower than in HGPM and STG (STSU vs. HGPM: P < 0.0001; STSU vs. STG: P = 0.0011; STSL vs. HGPM: P < 0.0001; STSL vs. STG: P = 0.0014), and comparable to those measured in HGAL (P = 0.63 and P = 0.50 for STSU and STSL, respectively) (see Supplementary Table 3 for results of LME model analysis). There was no significant difference in gamma ERBP peak frequencies between the two banks of the STS (P = 0.74). Thus, to account for the gamma frequency shift, low-gamma and high-gamma power were combined into a single band (30–150 Hz) for all subsequent analyses.
Activity in Auditory Cortex and STS during Target Detection Tasks
Subjects participated in tasks that required detection of either specific word categories or complex tones embedded in sequences of monosyllabic words (Steinschneider et al. 2014; Nourski et al. 2017). Most subjects exhibited near-perfect performance in the tone detection task (Supplementary Table 4). Performance in the semantic categorization task was generally inferior to tone detection (hit rate: P = 0.00023, d′: P = 0.00034). RTs in the semantic categorization task were longer than those in the tone detection task (median RTs 811 and 604 ms, respectively; P < 0.0001), consistent with the additional time required for speech processing compared with the detection of tones.
Responses to monosyllabic words in all ROIs were characterized by increases in gamma activity, followed by decreases in lower frequency power centered in the alpha band (Fig. 2A) that persisted for several hundred milliseconds following stimulus offset. Thus, quantitative analyses of high- and low-frequency ERBP required different averaging time windows to capture maximal power changes in the two bands. Accordingly, gamma and alpha ERBP were averaged within consecutive 300-ms windows.
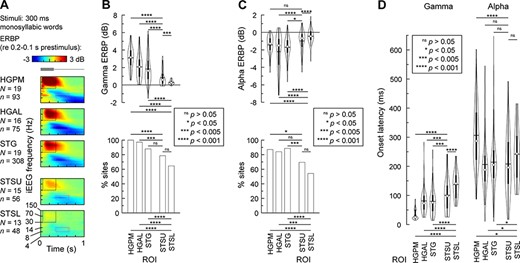
Activity in auditory cortex and STS during auditory target detection tasks. (A) Time–frequency plots of responses to monosyllabic words “cat,” “dog,” “five,” “ten,” “red,” and “white”, averaged across all recording sites in each of the five ROIs (top to bottom). Stimulus schematic is shown on top in gray. Dotted rectangles denote the time windows used for quantitative analyses of gamma and alpha ERBP (black: 50–350 ms, 30–150 Hz; cyan: 350–650 ms, 8–14 Hz). (B) Distribution of gamma ERBP values across sites and percentages of sites with significant (P < 0.05, t-test) gamma responses in each ROI (top and bottom panel, respectively). (C) Distribution of alpha ERBP values across sites and percentages of sites with significant (P < 0.05, t-test) alpha suppression in each ROI (top and bottom panel, respectively). (D) Distribution of gamma and alpha ERBP onset latencies (left and right panel, respectively) across sites in each ROI. In each violin plot, circle denotes the median, horizontal line denotes the mean, bar denotes Q1 and Q3, and whiskers show the range of lower and higher adjacent values. Statistical significance of ERBP and onset latency differences was established using LME models with ROI as the fixed effect and subject as the random effect. Statistical significance of response prevalence differences was established using Fisher exact tests.
Gamma response magnitude and prevalence (percentage of sites with significant responses) within STSU and STSL were less than in all auditory cortex ROIs (P < 0.05) with the exception of comparable prevalence in STSU and STG (P = 0.10) (Fig. 2B; see Supplementary Table 5 for results of LME model analysis). Gamma response magnitude was larger in STSU than STSL (P = 0.0016), though the prevalence of significant responses was similar (P = 0.13) and greater than 60% in both ROIs. Similar patterns were seen in alpha suppression with the following exceptions: comparable alpha suppression magnitude in STSU and HGPM (P = 0.091) and comparable prevalence between STSU and HGAL (P = 0.11) (Fig. 2C).
Onset latencies of gamma activity within STSU and STSL were significantly longer than in auditory cortex (P < 0.005 for all comparisons), consistent with sequential activation along the auditory processing hierarchy (Fig. 2D). Furthermore, gamma onset latencies in STSU were shorter than in STSL (P = 0.00039), suggesting sequential activation of the upper and lower bank to speech. Mean gamma onset latencies (±SD) were 35 ± 18 ms in HGPM, 81 ± 43 ms in HGAL, 80 ± 43 ms in STG, 101 ± 57 ms in STSU, and 137 ± 46 ms in STSL.
Onset latencies of alpha ERBP suppression did not parallel a likely feedforward activation sequence observed for gamma ERBP. Specifically, the onset of alpha suppression in the STSU was significantly earlier compared with HGPM (P < 0.0001) yet was comparable with the other two auditory regions and STSL (P > 0.05). In STSL, the onset of alpha suppression occurred earlier than in HGPM and later than in HGAL and STG (P < 0.05). Mean alpha suppression onset latencies (±SD) were 307 ± 103 ms in HGPM, 207 ± 101 ms in HGAL, 214 ± 98 ms in STG, 208 ± 104 ms in STSU, and 242 ± 94 ms in STSL. Thus, alpha suppression first emerged in noncore auditory cortex and STSU, followed by STSL, and, finally, HGPM.
Spatial Distribution of Responses to Monosyllabic Words
The functional heterogeneity of the STS warranted the analysis of whether responses to speech would be organized along ML or PA axes or by hemisphere (Fig. 3). Gamma responses in STSU were of greater magnitude at more superficial sites within the sulcus (P = 0.017), while differences along the PA axis did not reach significance (P = 0.052) (Fig. 3A; see Supplementary Table 6 for results of LME model analysis). STSL did not exhibit significant gradients of gamma ERBP distribution along either axis. There was a progression of gamma ERBP onset latencies from posterior to anterior sites within the STSU (P = 0.0073), but no significant effect of depth within the sulcus (P = 0.12) (Fig. 3B). One potential explanation for the discrepancy between ERBP magnitude and latency gradients in STSU is that while all sites were included in the analysis of gamma power, latency distribution analysis only considered those sites where response latencies could be reliably estimated (see Materials and Methods). Consequently, sites with the weakest responses (small open circles in Fig. 3B) did not contribute data to the model of latency distribution within STSU.
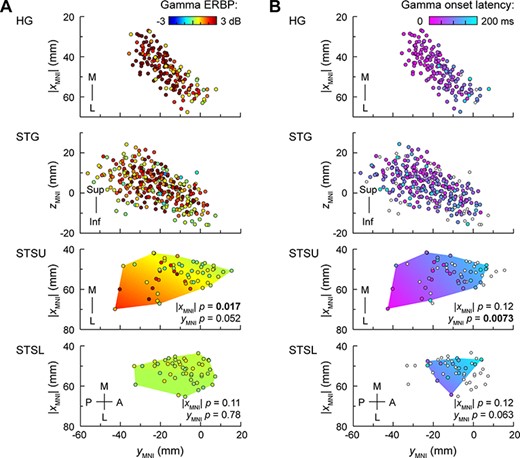
Spatial distribution of gamma ERBP and its onset latency elicited by monosyllabic words presented in target detection tasks within STS, with reference to activity in HG and STG plotted in the same coordinate space. (A) Gamma ERBP. Locations of recording sites from all subjects are plotted in MNI coordinate space, color-coded by gamma ERBP magnitude. Distributions of sites are shown in top-down views for HG, STSU, and STSL, and lateral views for STG. For STSU and STSL, LME model predictions are plotted as color gradient areas, bound by the convex envelopes of the sites’ locations. P-values correspond to the fixed effects of |XMNI| and YMNI coordinates. XMNI coordinates of sites in the left hemisphere were multiplied by (−1) to map them onto the right-hemisphere common space, as adding hemisphere as a fixed effect did not improve the model fits for either STSU or STSL. (B) Gamma onset latency. Sites where onset latency could not be measured due to gamma ERBP not exceeding the threshold (see Materials and Methods) are depicted as small white circles.
In STSL, significant relationships between response latency and location within or along the sulcus were not identified (P = 0.12 and P = 0.063, respectively). Gamma activity measured in the later window of 350–650 ms exhibited the same gradients as observed in the early (50–350 ms) window (data not shown). Adding hemisphere as a fixed effect did not improve the fit of the models that examined gamma ERBP magnitude and latency in either STSU or STSL. Likewise, there were no significant hemispheric differences in prevalence of gamma responses in either STSU (left: 18/27 sites; right: 26/29 sites; P = 0.052) or STSL (left: 9/15 sites; right: 22/33 sites, P = 0.75).
Alpha ERBP and its onset latency did not exhibit a significant ML or PA gradients in STSU (Supplementary Fig. 3). Although adding hemisphere as a fixed effect did not improve the fit of the models, there was a strong hemispheric asymmetry in the prevalence of alpha suppression in STSU. In the left hemisphere, 25 out of 27 sites (93%) had significant alpha suppression versus 14 out of 29 sites (48%) in the right hemisphere (P = 0.00037).
STSL exhibited properties distinct from STSU. Alpha suppression had longer onset latencies deeper in the sulcus (P = 0.032), and there was functional asymmetry wherein greater alpha suppression was present in the right hemisphere (P = 0.0070). As there was a bias in STSL electrode coverage, wherein recording sites in the right hemisphere were distributed more anteriorly compared with those in the left (see Fig. 1B), the LME model was tested with an additional interaction term between yMNI coordinate and hemisphere. Adding the interaction did not improve the fit of the model (ΔAIC = 1, P = 0.075). The asymmetry of alpha ERBP was paralleled by a difference in the prevalence of alpha suppression (right: 21/33 sites, left: 5/15 sites), although this difference did not reach significance (P = 0.058). Thus, iEEG indicates complex patterns of STS activation between the two hemispheres, wherein gamma activity is equivalent between the two hemispheres, while alpha suppression exhibits distinct and opposite asymmetries in STSU and STSL.
Stimulus and Target Effects in the Semantic Categorization Task
Analysis of activity elicited by nontarget words and nontarget tones presented in the same semantic categorization task provided an opportunity to compare responses to stimuli that did and did not require phonologic and semantic processing (stimulus effect). Similarly, comparisons between responses to nontarget and target words permitted an evaluation of responses associated with correct identification of the targets (target effect). For these analyses, only correct rejection nontarget trials and target trials with correct hits were included in comparisons. The stimulus effect was examined by comparing early (50–350 ms) gamma and late (350–650 ms) alpha ERBP responses to nontarget words and tones.
Examination of the target effect required a slightly different approach. In a previous study using the same semantic classification task, target effects in the gamma frequency range occurred in only a small minority of sites (<10%) within auditory cortex, middle temporal gyrus, and supramarginal gyrus (Nourski et al. 2017). Furthermore, a gamma band target effect occurred late in the response (>300 ms after stimulus onset). Consideration of these findings led to the conclusion that gamma ERBP would not be an optimal measure for examining target effects, especially with a relatively limited data sample of STSU and STSL. In contrast, the robust nature of alpha suppression observed during speech processing and deviance detection tasks in auditory cortex (Billig et al. 2019; Nourski et al. 2020) suggested that this measure would provide a sensitive probe of possible target effects in the STS. Thus, target effect was examined in the present study by measuring differences in alpha suppression associated with nontarget and target words.
Results of these analyses are depicted in Figure 4. Responses to tones and words presented in the semantic categorization task are shown in Figure 4A, averaged across recording sites within each ROI. In STSU and auditory cortex, significant gamma and alpha stimulus effects were observed (P < 0.001; Fig. 4B; see Supplementary Table 7 for results of LME model analysis). While there was a significant (P = 0.00038) alpha stimulus effect in STSL, gamma ERBP to tones and words was not significantly different (P = 0.66). Greater alpha suppression was associated with target words in STSU and all auditory cortex ROIs (P = 0.023 in HGAL; P < 0.0001 in HGPM, STG and STSU), though not in STSL (P = 0.46). In summary, activity within STSU was sensitive to both stimulus (gamma and alpha) and target (alpha). Within STSL, ERBP modulation was limited to an alpha stimulus effect.
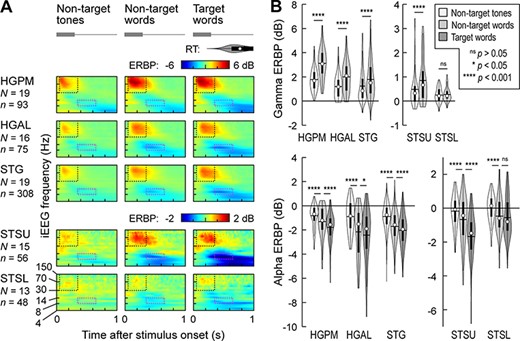
Stimulus and target effects in the semantic categorization task. (A) Time–frequency plots of responses to complex tones (left column), monosyllabic words “cat,” “dog,” “five,” and “ten,” presented as nontarget and target stimuli (middle and right column, respectively), averaged across all recording sites in each of the five ROIs (top to bottom). Responses were only included into the averages if they were correct rejections for nontarget trials and correct hits for target trials (i.e., missed target trials and false alarm responses were excluded). Stimulus schematic is shown on top in gray; distribution of RTs for target hits is shown as a violin plot. Dotted rectangles denote the time windows used for the quantitative analyses of gamma and alpha ERBP (black: 50–350 ms, 30–150 Hz; magenta: 350–650 ms, 8–14 Hz). Different ERBP scales are used for auditory cortex and STS to better visualize the smaller responses in STSU and STSL. (B) Distribution of gamma and alpha ERBP (top and bottom rows) across sites in each ROI, grouped by condition (nontarget tones, nontarget words, and target words). In each violin plot, circle denotes the median, horizontal line denotes the mean, bar denotes Q1 and Q3, and whiskers show the range of lower and higher adjacent values. Statistical significance of differences was established using LME models with ROI as the fixed effect and subject as the random effect. Gamma ERBP in response to target words is not shown in the top panels, as target effect was not examined in early gamma activity (see text for details). Different y-scales are used for auditory cortex and STS to better visualize the smaller responses in STSU and STSL.
Stimulus and target effects were also characterized in terms of their prevalence, wherein the percentage of sites that exhibited a significantly larger response to words versus tones (stimulus effect) and target versus nontarget words (target effect) were calculated (Fig. 5). Prevalence of gamma stimulus effect decreased along the auditory hierarchy (HGPM: 79%, HGAL: 62%, STG: 47%; STSU: 29%; STSL: 8.3%) and was less common in STSU and STSL compared with canonical auditory cortex (P < 0.05 for all comparisons). Prevalence in STSL was less than in STSU (P = 0.013).
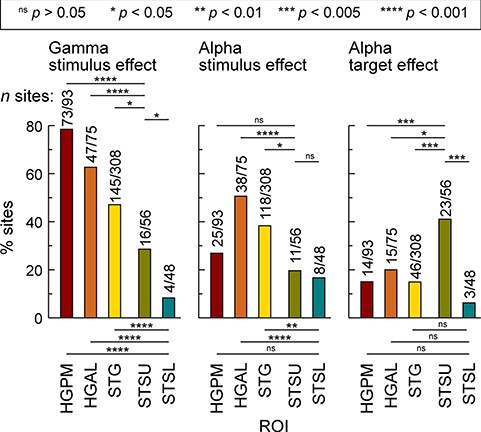
Prevalence of gamma and alpha stimulus effect (left and middle column, respectively) and alpha target effect (right column) across the five ROIs. Bar heights indicate the proportion of sites within each ROI that exhibited a significantly greater gamma response or alpha suppression to nontarget words versus complex tones (stimulus effect) or a significantly greater alpha suppression to target versus nontarget words (target effect). Numbers above the bars present the site counts (number of sites with significant effect/total number of sites in the ROI). Statistical significance of differences between ROIs was established using Fisher exact tests.
Alpha stimulus and target effects were distinct from those observed for gamma band activity. First, alpha stimulus effect was most prevalent in noncore auditory cortex (HGAL: 51% sites; STG: 38% sites) instead of HGPM. Second, prevalence of the alpha target effect was even more distinct from that seen for gamma, with the highest prevalence observed in STSU (41% sites). This effect was more common than in all other ROIs (P < 0.05 for all comparisons). Highlighting functional differences between STSU and STSL, the prevalence of alpha target effect in STSL was still the lowest of all ROIs (6.3% sites).
In summary, gamma and alpha stimulus effect and alpha target effect had distinct prevalence profiles along the auditory processing hierarchy. Gamma stimulus effect became progressively less common from the auditory cortex to the STS in a pattern suggestive of bottom-up processing mechanisms. In contrast, the highest prevalence of alpha stimulus effect in noncore auditory cortex and alpha target effect in STSU suggest mediation by top-down mechanisms.
Relationships between Physiology and Behavioral Performance
The wide variability of subjects’ task performance in the semantic classification task provided an opportunity to examine whether the magnitudes of gamma activity and alpha suppression were related to the behavioral performance of the subject cohort. This possibility was examined by comparing ERBP in response to all word stimuli in the semantic categorization task between subjects with above-average (target hit rate >82%; N = 11) versus below-average (target hit rate <82%; N = 11) task performance (Fig. 6). The only ROI where gamma ERBP was significantly larger in subjects who did better on the task was STSL (P = 0.034). Alpha suppression, on the other hand, was consistently greater in subjects who did better on the task in all ROIs (P < 0.05). This illustrates the utility of alpha suppression as a sensitive measure of neural activity related to speech processing tasks in auditory cortex and both banks of the STS.
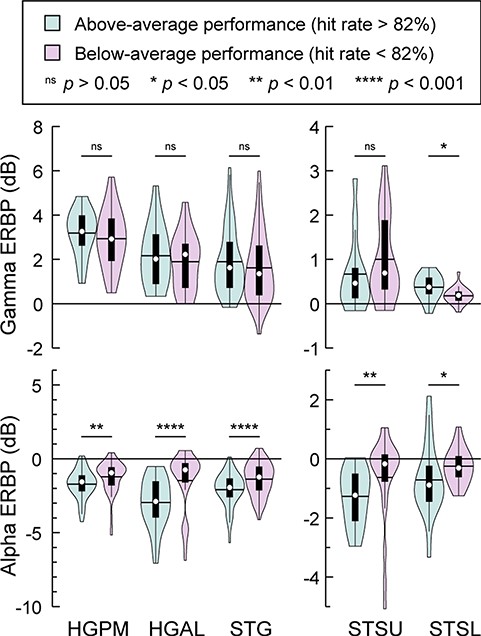
Relationship between iEEG responses to word stimuli and performance in the semantic categorization task. Distribution of gamma and alpha ERBP (top and bottom panels, respectively) in response to monosyllabic words across sites in all ROIs, plotted separately for subjects with above-average (target hit rate >82%; N = 11) and below-average (target hit rate <82%; N = 11) performance in the semantic categorization task (teal and magenta, respectively). In each violin plot, circle denotes the median, horizontal line denotes the mean, bar denotes Q1 and Q3, and whiskers show the range of lower and higher adjacent values. Statistical significance of differences was established using Wilcoxon rank sum tests. Different y-scales are used for auditory cortex and STS to better visualize the smaller responses in STSU and STSL.
Passive Listening
Up to this point, gamma and alpha activity have been examined using words presented during target detection tasks. STS is also activated, however, during passive listening of speech (Spitsyna et al. 2006; Obleser et al. 2007; Zachlod et al. 2020). In order to examine whether gamma responses and alpha suppression would generalize to passive presentation of speech, CV syllables were presented to subjects without task instruction (Fig. 7A). Regional distribution of gamma activity during passive listening paralleled that seen during the active task and was characterized by a progressive decrease in response magnitude through auditory cortex, and into STSU and STSL (Fig. 7B; see Supplementary Table 8 for results of LME model analysis).
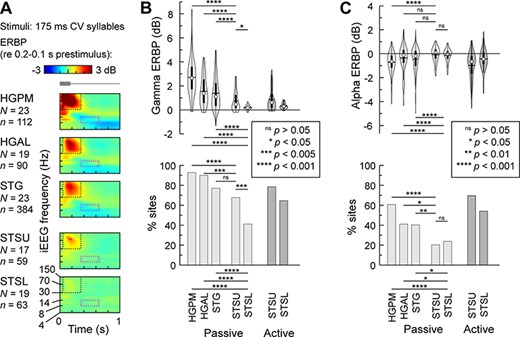
Activity in auditory cortex and STS during passive listening. (A) Time–frequency plots of responses to CV syllables /ba/, /da/, /ga/, /pa/, /ta/, and /ka/, averaged across all recording sites in each of the five ROIs (rows). Stimulus schematic is shown on top in gray. Dotted rectangles denote the time window used for the quantitative analyses of gamma and alpha ERBP (black: 50–350 ms, 30–150 Hz; magenta: 350–650 ms, 8–14 Hz). (B) Distribution of gamma ERBP values across sites and percentages of sites with significant (P < 0.05) gamma responses in each ROI (top and bottom panel, respectively). Magnitude and prevalence of gamma responses in the STS during the active task is replotted from Figure 4 in a darker shade of gray for comparison. (C) Distribution of alpha ERBP values across sites and percentages of sites with significant (P < 0.05) alpha suppression in each ROI (top and bottom panel, respectively). Magnitude and prevalence of alpha suppression in the STS during the active task is replotted from Figure 4 in a darker shade of gray for comparison. In each violin plot, circle denotes the median, horizontal line denotes the mean, bar denotes Q1 and Q3, and whiskers show the range of lower and higher adjacent values. Statistical significance of differences was established using LME models with ROI as the fixed effect and subject as the random effect. Statistical significance of response prevalence differences was established using Fisher exact tests.
For illustrative purposes, magnitude and prevalence of gamma and alpha ERBP in the STS measured during the active task were replotted from Figure 2 (darker gray plots in Fig. 7B,C). While stimulus differences between the active and the passive tasks precluded formal statistical comparison, it can be noted that the magnitude of gamma ERBP in STSU was similar between passive and active task conditions and prevalence was only slightly less than that seen in the active task (68% vs. 79%). A more substantial decrease of prevalence from active to passive task was present in STSL (active: 65%, passive: 41%).
In the active condition, the dominance of alpha stimulus effect in noncore auditory cortex and alpha target effect in STSU suggested that these effects reflected top-down processing mechanisms. Except for HGPM, decreases in alpha power were not a prominent component of responses elicited during passive listening (see Fig. 7A). This was especially evident in both banks of the STS, wherein both median and mean values across recording sites were near-zero (Fig. 7C). Furthermore, the prevalence of alpha suppression within both banks of the STS was markedly different between the two conditions (STSU passive: 20%; active: 70%; STSL passive: 24%; active: 54%) (Fig. 7C, bottom panel). Thus, while gamma activity in STSU was similar between the passive and the active conditions, alpha suppression, hypothesized to be a manifestation of top-down processing, was markedly diminished in the passive paradigm.
Responses during Dialog-Based Language and Cognitive Testing
A dialog-based experimental paradigm, wherein subjects engaged in a structured conversation with an interviewer, was used to compare responses associated with listening to the interviewer’s questions with those associated with subjects’ answers (Fig. 8A). Both gamma increases and alpha supression associated with listening to the interviewer were very similar to patterns seen when listening to words during the target detection tasks (see Fig. 2A). Gamma ERBP progressively decreased from HGPM to the other ROIs, while alpha suppression remained robust.
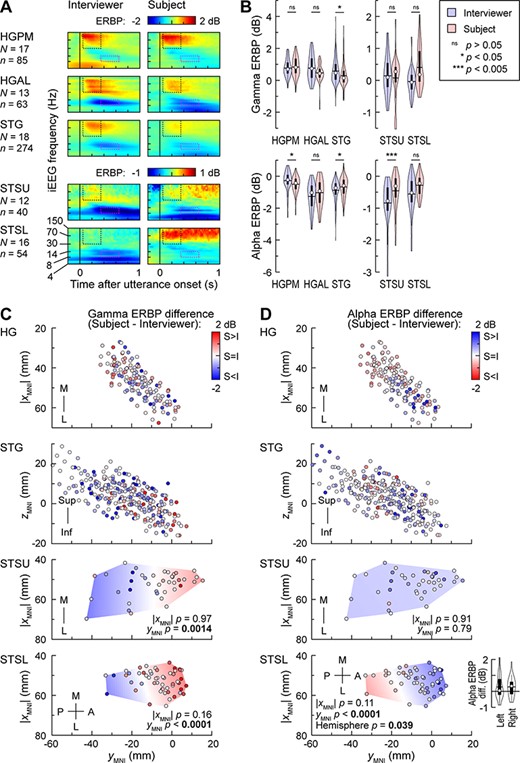
Activity in auditory cortex and STS during dialog-based testing. (A) Time–frequency plots of responses to the initial portions of the interviewer’s and subject’s utterances, averaged across all recording sites in each of the five ROIs. Dotted rectangles denote the time window used for the quantitative analyses of gamma and alpha ERBP (black: 50–350 ms, 30–150 Hz; magenta: 350–650 ms, 8–14 Hz). Different ERBP scales are used for auditory cortex and STS to better visualize the smaller responses in STSU and STSL. (B) Distribution of response magnitudes across sites in each ROI, elicited by interviewer’s and subject’s utterances (blue and red violin plots, respectively). Statistical significance of differences was established using LME models with utterance type (interviewer or subject) or ROI as the fixed effect and subject as the random effect. Different y-scales are used for auditory cortex and STS to better visualize the smaller responses in STSU and STSL. (C) Distribution of gamma talker bias values (difference between ERBP responses to subject’s and interviewer’s utterances) across HG, STG, STSU, and STSL. Locations of recording sites from all subjects are plotted in MNI coordinate space, color-coded by gamma ERBP difference (red indicates larger responses to subject’s own speech over the interviewer’s). LME model predictions for STSU and STSL are plotted as color gradient areas. P-values correspond to the fixed effects of |XMNI| and YMNI coordinates. XMNI coordinates of sites in the left hemisphere were multiplied by (−1) to map them onto the right-hemisphere common space. (D) Distribution of gamma talker bias values (difference between ERBP responses to subject’s and interviewer’s utterances) across HG, STG, STSU, and STSL. Violin plot inset in the bottom panel compares alpha talker bias between left and right STSL sites (circle denotes the median, horizontal line denotes the mean, bar denotes Q1 and Q3, and whiskers show the range of lower and higher adjacent values).
The emerging preference for heard versus self-initiated speech, progressing from core to noncore auditory cortex, might lead to the prediction that the STS would exhibit an even more pronounced bias favoring the interviewer’s speech. This was not the case for gamma responses in either STSU or STSL, as there was no significant bias toward listening when all recording sites were included in the analysis (Fig. 8B, P = 0.96 and P = 0.28 for STSU and STSL, respectively). Instead, there was a pronounced gradient for heard versus self-initiated speech along the PA axis of both banks of the STS. Specifically, more posterior portions of STSU and STSL responded more strongly to the interviewer’s utterances (blue symbols in Fig. 8C), whereas more anterior portions had stronger responses to the subject’s own speech (red symbols) (P = 0.0014 and P < 0.0001 for STSU and STSL, respectively; see Supplementary Table 9 for results of LME model analysis). Differences in gamma activity in the later window of 350–650 ms exhibited the same gradients as observed in the early (50–350 ms) window (data not shown). Adding hemisphere as a fixed effect did not substantially improve the fit of the LME models that examined talker bias gamma ERBP gradients in either STSU or STSL.
Alpha suppression in the STS exhibited striking differences when compared with that seen in auditory cortex. First, the largest difference in alpha suppression associated with listening versus speaking occurred in STSU (Fig. 8B). Second, in contrast to gamma activity, the bias in alpha suppression toward interviewer’s speech was uniform throughout STSU, with no significant PA gradient (Fig. 8D, P = 0.793). Adding hemisphere as a fixed effect significantly improved the fit of this model. Third, the PA gradient for alpha suppression in STSL was opposite to that seen for the gamma gradient. Specifically, more posterior sites were characterized by greater alpha suppression associated with speaking, while more anterior sites had greater alpha suppression during listening. Adding hemisphere as a fixed effect to this model significantly improved the model fit (ΔAIC = 2, P = 0.039), and there was a significant main effect of hemisphere, wherein greater alpha suppression during listening versus speaking was present in right hemisphere STSL sites (P = 0.039).
In summary, there was a shift in balance between gamma increase and alpha suppression associated with active tasks along the auditory hierarchy. Within canonical auditory cortex, large gamma band responses were typically followed by strong alpha suppression. In STSU, the PA gradient favoring listening and speaking in gamma activity was not paralleled by a similar gradient in alpha suppression, which was now more uniform across this region and featured a left hemisphere bias. In STSL, the same gradient as in STSU for gamma responses was associated with a mirror-image gradient for alpha suppression, wherein stronger gamma responses were associated with weaker alpha suppression.
Discussion
Electrode Coverage
This is the first comprehensive intracranial electrophysiology investigation of STS response properties to speech, examined in two complementary active paradigms. The 127 recording sites across 29 subjects sampled STSU and STSL in both hemispheres. Recordings were made from contacts along the shaft of electrodes that targeted clinically relevant mesial temporal lobe structures. Clinical requirements dictated the anterior and posterior extent of STS coverage, which primarily included middle and anterior STS (cf. Hein and Knight 2008; Liebenthal et al. 2014). The PA extent of electrode coverage in the present study largely falls within the two cytoarchitectonically defined auditory-related regions of the STS (STSU ≈ STS1, STSL ≈ STS2; Zachlod et al. 2020). Thus, all conclusions must remain confined to this region. These more anterior portions of the STS have been identified as important for speech perception and production (e.g., Cheng et al. 2018), which is the focus of the present study.
In the present study, electrode coverage of STSU was equivalent between the two hemispheres in terms of extent of PA and ML axes. Thus, any hemispheric effects could not be attributed to a systematic bias based on the location of recording sites. Electrode coverage of STSL was also comparable between the two hemispheres along the ML axis, though there was a bias wherein coverage of the right STSL was more anterior. This bias was ~12 mm, measured in MNI coordinates.
Spectral Profiles of Responses
There were differences in spectral profiles of ERBP measured across the five ROIs. As a rule, all ROIs responded most strongly in the high-gamma band, though a shift toward lower gamma frequencies was noted in HGAL, STSU, and STSL. Variability in the lower boundary of gamma activation can occur across subjects as well as across nearby recording sites in the same brain region (Crone et al. 2001, 2011). Both low- and high-gamma frequencies reflect the local activation of neuronal circuits and are positively correlated with BOLD fMRI response (e.g., Michels et al. 2010; Kunii et al. 2013; Petitmengin and Lachaux 2013). Gamma responses reflect a complex balance of synaptic activity among excitatory principal cells and various classes of inhibitory interneurons, where each class is associated with specific spectral profiles within the gamma band (Viriyopase et al. 2016; Keeley et al. 2017; Veit et al. 2017). The shift in spectral power profile toward lower peak frequencies may be based upon progressive changes in cytoarchitectonics and therefore the balance of pyramidal cells and various classes of inhibitory interneurons that occur between auditory cortex and higher order regions such as the STS (Rivier and Clarke 1997; Wallace et al. 2002; Zachlod et al. 2020). These considerations warrant that gamma activity measured in iEEG data from cytoarchitectonically diverse areas be examined over a broad range of relevant frequencies.
Suppression of alpha activity, a physiologic result of stimulus-induced activation, was also a prominent feature of STS responses to speech. Alpha suppression has a greater spatial extent compared with gamma augmentation and is envisioned to represent a gating mechanism in a larger zone of cortex that facilitates task-related cortical processing (Crone et al. 2011). In the current study, passive presentation of speech stimuli failed to elicit strong alpha suppression, consistent with previous studies in auditory cortex (Haegens et al. 2015; Billig et al. 2019; Nourski et al. 2020). Cortical alpha power is negatively correlated with BOLD fMRI signal (Goldman et al. 2002; Yuan et al. 2010). Conversely, alpha suppression is generally associated with gamma power augmentation and may contribute to increased BOLD response (Mukamel et al. 2005; de Pesters et al. 2016).
In the current study, alpha suppression generally occurred subsequent to maximal gamma augmentation. Given that alpha suppression is associated with excitation, it is interesting that it was not paralleled by concurrent increases in gamma power. One explanation is that the initial burst of gamma is widespread, similar to the on-response in auditory cortex (Wang 2007). Later activity of a more sustained nature has a more discrete excitatory pattern, similar to sustained responses to preferred stimuli in auditory cortex. As suggested by Crone et al. (2011), macroelectrode recordings may lack the sufficient resolution to resolve these more sustained excitatory responses. Examining this possibility will likely require more sensitive techniques, exemplified by the unique ability of single-unit recordings from the core auditory cortex to correlate with human pitch perceptual acuity (Bitterman et al. 2008).
STS in Speech Perception Hierarchy: Transformation of Stimulus Representations
Connectivity analyses indicate that the STS is a crucial hub linking superior temporal cortex with frontal and parietal areas involved in speech processing (Abrams et al. 2020). The earlier onset alpha suppression in the STS, HGAL, and STG relative to that seen in core auditory cortex (HGPM) suggests feedback signaling from higher to lower stages within the auditory cortical hierarchy (Halgren et al. 2019). In this scheme, speech perception is associated with the suppression of ongoing alpha activity, possibly mediated by decreased tonic influences from frontal and parietal areas. High prevalence of alpha target effect in STSU and the absence of alpha suppression in the STS during passive listening to speech reinforce this interpretation.
STSL was the only ROI where gamma responses to words presented in the semantic categorization tasks were larger in subjects with superior task performance, suggesting that this increase is an emergent property occurring at the level of the STS. In contrast, more pronounced alpha suppression was associated with better task performance throughout all ROIs. This observation extends our previous findings regarding the relationship between cortical activity and speech task performance (Nourski et al. 2019). In that study, larger high-gamma responses within the lateral STG were associated with better phonemic identification of spectrally degraded speech.
The dialog-based paradigm used in the current study was effective in further clarifying fundamental response properties of the STS within the broader context of the auditory cortical hierarchy. When listening to the interviewer, a progressive decrement in the magnitude of responses along this hierarchy was observed. Specifically, responses in the STS were smaller compared with the auditory cortex, and STSL had weaker responses compared with STSU. This overall profile when listening was similar to that seen in the other experimental paradigms used in the present study.
Upper and Lower Bank Differences
STSU and STSL are cytoarchitectonically distinct (Zachlod et al. 2020) and are functionally different with regard to speech processing, as suggested by functional neuroimaging (Belin et al. 2000; Leaver and Rauschecker 2010; Deen et al. 2015). The present electrophysiologic data complement the previous studies by revealing multiple functional differences between STSU and STSL. As a rule, speech-evoked gamma activity in STSU was both larger and shorter onset latency compared with STSL (see Fig. 2), consistent with the interpretation of STSU as an earlier stage in the speech processing network.
There were differences in ML and PA gradients of activation within the two banks. Specifically, larger gamma responses to words were seen at more lateral locations within STSU. These findings parallel recent fMRI data showing that sound activation within STSU is of greater magnitude at more lateral locations within the sulcus (Supplementary Fig. A in Bodin et al. 2018). The ventral portion of the STG, adjacent to STSU, has been shown to be more responsive to intelligible compared with unintelligible (spectrally distorted) speech (Humphries et al. 2014; however, see Wilson et al. 2018). In this scheme, activity within STSU can be envisioned to represent a continuation of response profiles (emerging preferential activation by intelligible speech) established on the lateral STG.
Within STSU, the PA gradient, measured as the fixed effect of yMNI coordinate on the magnitude of gamma ERBP, did not reach significance (P = 0.052). This negative finding may reflect the anterior bias in electrode coverage as well as insufficient power to overcome the random effect of subject included in the LME model. Both middle STS, as defined by Liebenthal et al. (2014), and more anterior regions are responsive to auditory speech (see also Binder et al. 2008; Venezia et al. 2017). Middle STS is considered crucial for phonological processing (Liebenthal et al. 2014), whereas more anterior regions are involved in higher order semantic processing (Binder et al. 2008; Beauchamp 2015). While the PA gradient within STSU did not reach significance for gamma ERBP magnitude, there was a pronounced increase in onset latency at more anterior locations (see Fig. 3B). The emphasis of phonological versus higher order semantic processing within middle and anterior portions of STSU, respectively, may underlie the PA onset latency gradient as ever-more complex components of language are processed.
Bilateral Activation of the STS
There is no consensus regarding the degree of functional hemispheric asymmetry in the STS associated with speech perception. While many studies stress strong left hemispheric functional bias at the sublexical level (e.g., Spitsyna et al. 2006; Lindenberg and Scheef 2007; Rauschecker and Scott 2009; Turkeltaub and Coslett 2010), current electrophysiologic data support the view that there is bilateral activation in the auditory responsive portion of the STS (Warburton et al. 1996; Hein and Knight 2008; Huth et al. 2016). However, the present study did not address whether the activation of the left and right STS was associated with different functions or attributes (cf. Belin et al. 2000; Hickok and Poeppel 2007; Obleser et al. 2008; Hickok 2009; Okada et al. 2010; Price 2012; Hurschler et al. 2015).
While gamma responses did not reveal preferential activation of the STS within the dominant left hemisphere, asymmetries of alpha suppression were identified in STSU and STSL. Alpha suppression in STSU was greater in the left hemisphere and greater in the right hemisphere in STSL. These opposite asymmetries may be responsible for some of the inconsistencies in the fMRI literature with regard to lateralization given that the activation of both STSU and STSL will lead to increased blood flow in the fundal draining veins, contributing to the BOLD response (Wilson et al. 2018). On the other hand, consistently greater gamma activity and greater alpha suppression in STSU compared with STSL would likely result in a greater contribution of STSU to the overall BOLD response of the STS. In general, prominent alpha activity is associated with inhibitory control and is inversely correlated with the BOLD response (Yuan et al. 2010; Scharinger et al. 2014). Alpha suppression could thus be interpreted as representing a relative state of excitation, leading to increases in the BOLD response and a left hemisphere bias in STSU.
STS and Speech Production
Activity in the STS during the dialog-based paradigm featured a significant change in the representation of interviewer’s versus subject’s own speech. In the STG, there was a bias of gamma activity with preference for listening to the interviewer. This finding replicates prior work demonstrating bias for listening in noncore auditory cortex (Greenlee et al. 2011; Nourski et al. 2016; see also Eliades and Wang 2003, 2005). Instead of an increase in this bias within the STS, a PA gradient emerged wherein more anterior regions of STSU and STSL had stronger gamma responses to self-initiated speech. This PA gradient is consistent with the fMRI study of Liebenthal et al. (2014), which identified the peaks of activation associated with speech perception and speech production in the middle and anterior portions of the STS, respectively. It is possible that selectivity to one’s own utterances is a manifestation of talker identity and thus would also occur when listening to a recording of one’s own speech. The present study did not address this possibility, which must remain a topic of further research.
Interestingly, alpha suppression in STS did not parallel the gradient seen for gamma activity. In STSU, there was uniformly greater alpha suppression associated with interviewer’s speech. In STSL, more anterior regions had stronger alpha suppression during listening compared with self-initiated speech, that is, opposite to that seen for gamma ERBP. The reasons for these differences between gamma and alpha distributions are yet to be elucidated, but the desynchronization of alpha rhythms may represent a prerequisite for accurate language processing (Gourévitch et al. 2020).
The dual stream model of speech processing posits that the ventral processing stream is necessary for accurate speech comprehension, while the dorsal stream (postero-dorsal audio-motor pathway) is involved in monitoring self-generated speech (Hickok 2012; Liebenthal et al. 2014). The dorsal stream originates in the middle portion of the STS bilaterally, passes through posterior STS and temporo-parietal junction, and terminates in the left inferior frontal gyrus (Hickok and Poeppel 2015). The anterior STS is considered a part of the ventral stream based on functional connectivity analysis (Erickson et al. 2017). Therefore, current findings support the notion that self-generated speech also activates the ventral processing stream. Furthermore, electrical stimulation of cortical and subcortical structures along the ventral stream more strongly disrupts both single-word production and sentence generation than electrical stimulation of the dorsal stream (Ries et al. 2019). As a whole, electrophysiology, functional connectivity analysis and electrical stimulation mapping data all support a role of the ventral stream in speech production. Finally, these findings that STS is active bilaterally during speech production support previous functional neuroimaging studies (Warburton et al. 1996; Hickok 2012; Grabski and Sato 2020) and conflict with conclusions that such activation is limited to the dominant hemisphere (Paus, Marrett, et al. 1996a; Paus, Perry, et al. 1996b; Fridriksson et al. 2018).
Caveats and Limitations
A key concern applicable to all human intracranial electrophysiology studies performed in epilepsy patients is the degree to which such data can be extrapolated to the general population. Effects of epilepsy and possible secondary reorganization of brain regions outside diagnosed seizure foci as well as potential effects of antiepileptic drugs are common to all human intracranial electrophysiology studies. To address these concerns, especially when examining a previously understudied brain structure using intracranial recordings, all analyses were preceded by establishing consistency with results of previous studies of auditory cortex (reviewed in Nourski 2017). Additionally, it was necessary to study STS response patterns over a large number of subjects and recording sites to obtain a reliable sample. Finally, this study did not include paradigms based on audiovisual speech, which has been shown to produce strong STS activation (Venezia et al. 2017; Cheng et al. 2018; Rennig and Beauchamp 2018). Continual accrual of STS data obtained from electrodes targeting mesial temporal lobe structures will provide a more complete description of this hitherto understudied brain region crucial for speech processing.
Notes
We are grateful to Joel Berger, Haiming Chen, Phillip Gander and Beau Snoad for help with data collection, analysis, and comments on the manuscript. Conflict of Interest: None declared.
Funding
National Institutes of Health (grant numbers R01-DC04290, UL1-RR024979).
References
Garofolo JS, Lamel LF, Fisher WM, Fiscus JG, Pallett DS, Dahlgren NL, Zue V.
Nagahama Y, Schmitt AJ, Dlouhy BJ, Vesole AS, Gander PE, Kovach CK, Nakagawa D, Granner MA, Howard MA, Kawasaki H.
Spena G, Nava A, Cassini F, Pepoli A, Bruno M, D'Agata F, Cauda F, Sacco K, Duca S, Barletta L et al.
Author notes
Kirill V. Nourski and Mitchell Steinschneider have contributed equally to this work.