


Abstract
Noninvasive stimulation is an emerging modality for the treatment of psychiatric disorders, including addiction. A crucial element in effective cortical target selection is its distal influence. We approached this question by examining resting-state functional connectivity patterns in known and potential stimulation targets in 145 healthy adults. We compared connectivity patterns with distant regions of particular relevance in the development and maintenance of addiction. We used stringent Bonferroni-correction for multiple comparisons. We show how the anterior insula, dorsal anterior cingulate, and ventromedial prefrontal cortex had opposing functional connectivity with striatum compared to the dorsomedial prefrontal cortex. However, the dorsolateral prefrontal cortex, the currently preferred target, and the presupplementary motor area had strongest negative connections to amygdala and hippocampus. Our findings highlight differential and opposing influences as a function of cortical site, underscoring the relevance of careful cortical target selection dependent on the desired effect on subcortical structures. We show the relevance of dorsal anterior cingulate and ventromedial prefrontal cortex as emerging cortical targets, and further emphasize the anterior insula as a potential promising target in addiction treatment, given its strong connections to ventral striatum, putamen, and substantia nigra.
Introduction
The use of noninvasive stimulation, such as repetitive transcranial magnetic stimulation (rTMS) or transcranial direct current stimulation (tDCS), to treat psychiatric disorders is an emerging field (Post and Keck 2001; Gorelick et al. 2014). High-frequency rTMS increases cortical excitability, blood flow, and metabolism, while low-frequency stimulation has a net inhibitory effect (Post and Keck 2001). Similarly, anodal tDCS enhances cortical excitability and cathodal stimulation diminishes excitability (Nitsche and Paulus 2000), although the effects of cathodal stimulation on cognitive function have been inconsistent (Jacobson et al. 2012). A number of studies have demonstrated that both rTMS and tDCS of different cortical regions provoke changes in resting-state functional connectivity networks (for reviews see Fox, Halko, et al. 2012; Saiote et al. 2013). rTMS targeting the dorsolateral prefrontal cortex (dlPFC) for major depression has been shown to be safe and effective (Noda et al. 2015), but the target sites for disorders of addiction remain to be established. Understanding influences on distal subcortical structures, that is, deeper regions which are beyond the direct effects of superficial noninvasive stimulation and likely related to its secondary downstream effects, is critical to target selection.
To date, most addiction research has focused on dlPFC stimulation for the treatment of alcohol dependence (Mishra et al. 2010; Klauss et al. 2014) and other substance addictions (Eichhammer et al. 2003; Camprodon et al. 2007; Li et al. 2013), with promising but mixed results. High-frequency rTMS of the right dlPFC at 10 Hz has been shown to reduce craving (Mishra et al. 2010), but not stimulation of the left side at 20 Hz (Höppner et al. 2011). Interestingly, anodal tDCS of the left dlPFC has been found to reduce alcohol craving (da Silva et al. 2013), but simultaneous anodal and cathodal stimulation of the right and left dlPFC, respectively, has shown no effect (Klauss et al. 2014). However, 2 recent studies (Rapinesi et al. 2013; Girardi et al. 2015) with bilateral high-frequency deep rTMS of the dlPFC reported significant reduction in craving and dysthymic symptoms. Results from studies in cocaine use disorder targeting the dlPFC have been equally mixed (Camprodon et al. 2007; Politi et al. 2008; Gorini et al. 2014; Terraneo et al. 2016). Given these disparate results, finding new potential targets is critical.
Emerging targets for addictions include midline prefrontal targets. Low- and high- frequency deep rTMS of dorsal anterior cingulate cortex (ACC) and dorsomedial PFC (dmPFC), respectively, were recently shown to reduce craving in alcohol dependence(De Ridder et al. 2011; Ceccanti et al. 2015). High-frequency dmPFC simulation additionally decreased the mean number of alcoholic drinks taken (Ceccanti et al. 2015). There is also been increasing interest in targeting the ventromedial PFC (vmPFC), which is thought to be part of the network mediating abnormal incentive salience of drug cues compared to natural reinforcers (Koob and Volkow 2010). Low-frequency TMS of the frontal pole/vmPFC has been shown to be more likely to attenuate cocaine craving than sham TMS, as well as to decrease activity in the striatum and anterior insula (Hanlon et al. 2015). Others have attempted to target the vmPFC through tDCS stimulation of the dlPFC: simultaneous anodal and cathodal stimulation of the right and left dlPFC, respectively, in crack cocaine users was followed by increased diffusion tensor parameters in the tract connecting vmPFC and nucleus accumbens (NAcc), which further correlated with a decrease in craving (Nakamura-Palacios et al. 2016).
Anodal tDCS of the right inferior frontal cortex (IFC) in alcohol dependent subjects showed no effects (den Uyl et al. 2015), although this structure is essential in response inhibition (Cai, Ryali, et al. 2014), and anodal tDCS to this region has been shown to decrease impulsive behavior in healthy participants(Jacobson et al. 2011). Although the presupplementary motor area (pre-SMA) has not received much attention in addiction treatment, it deserves consideration given its central role in obsessive-compulsive disorder (D’Urso et al. 2016) and response inhibition (Cai, Cannistraci, et al. 2014), with impaired stopping behavior following disruption of pre-SMA activity (Cai et al. 2012). In the context of obsessive-compulsive disorder, which has been associated with pre-SMA hyperfunction, cathodal tDCS has been reported to alleviate symptoms (D’Urso et al. 2016).
Converging lesion, imaging and cognitive studies in humans have implicated a further cortical structure as central to addictions: the anterior insula (AI). Recent rodent studies have specifically pinpointed the AI as the neurobiological gate between impulsive and compulsive behaviors (Belin-Rauscent et al. 2016). Stroke lesions of the AI have been associated with cessation of smoking behavior and craving (Naqvi et al. 2007; Abdolahi et al. 2015). Similarly, deep high-frequency rTMS targeting AI and lateral PFC has shown reductions in nicotine consumption and quit rate maintained over 6 months (Dinur-Klein et al. 2014). Recent studies have further highlighted the importance of right AI connectivity for cue-induced craving (Moran-Santa Maria et al. 2015) and delay discounting (Clewett et al. 2014) in nicotine dependence. The AI has also been shown to play a critical role in cost-benefit decision making (Skvortsova et al. 2014), with increased activity in alcohol dependent participants when making decisions regarding drinking (MacKillop et al. 2014). Furthermore, reduced AI volume has been reported in alcohol dependent subjects (Makris et al. 2008; Senatorov et al. 2015), with this, as well as NAcc volume, increasing with alcohol abstinence (Makris et al. 2008).
Here, we used resting-state fMRI (rsfMRI) to investigate functional connectivity of potential and known rTMS and tDCS targets in a large sample of 145 healthy adults. Although functional brain organization has been shown to differ between addicted individuals and healthy controls (Gu et al. 2010; Ma et al. 2010; Janes et al. 2012; Sjoerds et al. 2017), resting-state functional connectivity in healthy subjects has proven useful in understanding the mechanisms of brain stimulation in pathology. A previous rsfMRI study reported that dlPFC TMS sites with better clinical efficacy in depression were more anticorrelated with the subgenual cingulate in healthy participants; a finding that was reproducible in patients with depression (Fox, Buckner, et al. 2012), demonstrating that rsfMRI data of healthy subjects could be used to optimize cortical target selection in a mental disorder. Further, another rsfMRI study on a healthy population seeded their analyses within deep brain stimulation targets for 14 disorders, including addiction, depression, epilepsy, Parkinson’s disease, and obsessive-compulsive disorder, demonstrating that these structures were correlated with areas successfully used as inhibitory targets, and anticorrelated with cortical areas used as noninvasive excitatory targets (Fox et al. 2014).
We used a recently developed multiecho (ME) sequence and independent components analysis (ICA) shown to enhance signal-to-noise ratios 4-fold, hence, improving resolution of small subcortical structures (Kundu et al. 2012). We specifically compared the connectivity patterns of these cortical targets to relevant distal subcortical regions (striatal subregions, amygdala, hippocampus, and substantia nigra) known to play a key role in the development and maintenance of addiction. We contrasted connectivity between these cortical and distal areas using stringent Bonferroni-correction for multiple comparisons. These stimulation targets and distal regions are also highly relevant to other psychiatric disorders, such as obsessive-compulsive disorder. A fine-grained understanding of these corticosubcortical relationships may help in the selection of appropriate targets.
Materials and Methods
Participants
Data from 145 healthy volunteers (87 women, 27.52 ± 9.54 years old, range: 18–55) were used in this study. Participants were recruited from community and university-based advertisements and were excluded if they had any current psychiatric (tested using the Mini International Neuropsychiatric Inventory) or neurological disorder, or were on psychotropic medication. Subjects were paid for their participation. Experimental procedures were approved by the University of Cambridge Research Ethics Committee and participants gave written informed consent.
rsfMRI Data Acquisition
rsfMRI data were acquired for 10 min while subjects fixated on a white cross on a black screen in a Siemens 3 T Tim Trio scanner using a 32-channel head coil at the Wolfson Brain Imaging Center, University of Cambridge. A ME EPI sequence was used with online reconstruction (TR = 2.47 s, FA = 78°, matrix size 64 × 64, 3.75 mm in-plane resolution, FOV = 240 mm, 32 oblique slices, alternating slice acquisition, slice thickness 3.75 mm with 10% gap, iPAT factor 3, bandwidth = 1698 Hz/pixel, TE = 12, 28, 44 and 60 ms). High-resolution anatomical images were acquired using a T1-weighted MPRAGE sequence (FOV = 176 × 240, 1 mm in-plane resolution, TI = 1100 ms).
rsfMRI Data Analysis
Data were analyzed with ME independent component analysis (ME-ICA; Kundu et al. 2012), which uses FastICA to decompose ME rsfMRI data, and the pseudo-F-statistics κ and ρ to categorize these as BOLD or non-BOLD activity, respectively. Nuisance regressors (low κ, high ρ) are then removed by projection. ME-ICA has been shown to enhance signal-to-noise ratios 4-fold, hence, improving resolution of small subcortical structures (Kundu et al. 2012) and being more sensitive to group differences than single-echo rsfMRI using conventional denoising techniques (Baek et al. 2017). Individual EPI images were then coregistered to the T1-weighted MPRAGE images and normalized to the MNI template. Data were spatially smoothed using a 6 mm FWHM Gaussian kernel and temporally band-pass filtered between 0.008 and 0.09 Hz. Anatomical images were segmented into grey and white matter and cerebrospinal fluid, and significant principal components of white matter and cerebrospinal fluid were removed. Seed-based functional connectivity analysis was performed with CONN-fMRI Functional Connectivity toolbox (Whitfield-Gabrieli and Nieto-Castañón 2012) for SPM8 (http://www.fil.ion.ucl.ac.uk/spm/software/spm8/), using bivariate correlation to measure the level of linear association between the time series of each seed and voxel. Seeds were manually created or altered using the MarsBaR region-of-interest (ROI) toolbox (Brett et al. 2002), as described previously (Morris et al. 2016). Age and gender were used as covariates of no interest.
Analyses were seeded within known and potential rTMS and tDCS target sites: left and right AI, bilateral dACC, left and right dlPFC, bilateral dmPFC, right IFC, bilateral pre-SMA, and bilateral vmPFC (see Supplementary Fig. S1). Medial targets were defined bilaterally, as differentiated unilateral stimulation of these regions is not always possible with the current methods. The AI seeds were defined by restraining the insula ROI from the automatic anatomical labeling (AAL) atlas at y = 0, retaining only the anterior portion. The dACC seed was defined by restricting the borders of the cingulate ROI from the AAL atlas at the tip and posterior end of the genu of the corpus callosum (CC) (Desikan et al. 2006; Cox et al. 2014). The dlPFC seeds were created by combining BA 9 and BA 46 from the AAL atlas, and restricting the anterior border by the most anterior tip of the CC, the posterior border by the genu of the CC, the ventral border by the inferior frontal sulcus and the medial border by the cingulate sulcus (Sanches et al. 2009; Cox et al. 2014). The dmPFC seed was created using area 10p (Öngür et al. 2003) as the anterior boundary, the lateral boundaries of the cingulate cortex as defined in the AAL atlas, and a vertical line through the genu of the CC as the posterior border. The right IFC seed was defined using the inferior frontal sulcus as the superior boundary, the precentral gyrus as the posterior boundary (Desikan et al. 2006; Cox et al. 2014) and the rostral extent of the inferior frontal sulcus as the anterior boundary (Desikan et al. 2006); which was then restricted using a 300 mm radius sphere centered on x = ±48, y = 18, z = 8 (Johnson-Frey et al. 2003) and with the anterior horizontal ramus of the Sylvian fissure as a boundary from orbital regions (Cox et al. 2014). The pre-SMA seed was defined by restraining the SMA ROI from the AAL atlas at the level of the anterior commisure (Kim et al. 2010), retaining only the anterior portion. The vmPFC seed was defined using area 10p (Öngür et al. 2003) as the anterior boundary, the cingulate cortex as lateral and posterior boundaries, the genu of the CC as the dorsal boundary, and y = −18 as the ventral boundary.
Six subcortical ROIs were further defined: ventral striatum (VS), caudate, putamen, amygdala, hippocampus and substantia nigra (SN) (see Supplementary Fig. S1). The VS ROI was created by Murray et al. (2007) based on the definition by Martinez et al. (2003). The caudate and putamen ROIs were based on the definitions by Martinez et al. (2003) and had no overlap with the VS ROI. Amygdala, hippocampus and SN ROIs were created from those defined in the Talairach Daemon atlas (Lancaster et al. 2000). All subcortical ROIs were defined bilaterally.
Seed-to-whole-brain connectivity maps were computed for each region and entered into a one-sample t-test, using a mask computed from the 6 subcortical ROIs (results of the seed-to-whole brain analysis without the subcortical mask can be found in Supplementary Information). Significant connectivity was identified using a threshold of P < 0.006 (whole-brain FWE-corrected) and a cluster threshold of k ≥ 5. This threshold was selected by Bonferroni-correcting the standard P < 0.05 (FWE-corrected) threshold for the 9 seeds used.
Seed-to-ROI Connectivity
To compare seed-to-ROI connectivity strength between the cortical seeds used, individual subjects’ Fisher z-transformed correlation coefficients averaged across the ROI were extracted for each ROI using the MarsBaR ROI toolbox (Brett et al. 2002).
The extracted Fisher z-transformed correlation coefficients were then inputted in a repeated-measures ANOVA (rmANOVA) for each of the 6 ROIs with the factor seed. Only seeds with significant connectivity to the ROI, as demonstrated by the preceding seed-to-whole brain analysis, were included in each rmANOVA. Huynh–Feldt-correction was used to correct degrees of freedom and P-values if Mauchly’s sphericity test was significant. The P-values of the rmANOVAs were Bonferroni-corrected for 54 comparisons (9 seeds, 6 ROIs; e.g., the original P-value for the VS ROI was P = 5.07e-93, but here we report the Bonferroni-corrected P-value as 5.07e-93 × 54 = 2.74e-91). Post hoc t-tests were used to further examine the results of the significant rmANOVAs, and were Bonferroni-corrected for 9 seeds, 6 ROIs and the number of pairwise comparisons performed (e.g., 9 × 6 × 36 = 1944 in the case of the VS, as all the seeds were inputted in the rmANOVA, but 9 × 6 × 15 = 810 in the case of the hippocampus, since dmPFC, pre-SMA and vmPFC showed no significant connectivity to this ROI; the original P-value for the comparison between left AI and left dlPFC for the VS ROI was P = 3.4e-14, but here we report the Bonferroni-corrected P-value as 3.4e-14 × 1944 = 6.61e-11).
Results
Seed-to-Whole-Brain Connectivity
Seed-to-whole brain connectivity, masked with a network of interest comprising the 6 subcortical ROIs, was assessed for AI, dACC, dlPFC, dmPFC, right IFC, pre-SMA, and vmPFC seeds, which have been used or suggested as noninvasive stimulation targets (Fig. 1, Table 1). Results of the analysis without the subcortical mask can be seen in Figure 2.
Results of the masked seed-to-whole-brain resting-state functional connectivity analyses performed on data from 145 healthy volunteers. Significant clusters were identified using a threshold of P < 0.006 (FWE-corrected) and k ≥ 5. Plus (+) and minus (−) signs indicate the direction of the connectivity.
| Seed | Peak region | x | y | z | k | t | P |
|---|---|---|---|---|---|---|---|
| Left AI (+) | L putamen | −27 | 12 | 7 | 692 | 30.00 | <0.001 |
| L putamen | −27 | 12 | −7 | 25.04 | <0.001 | ||
| L putamen | −31 | 0 | 4 | 20.02 | <0.001 | ||
| R putamen | 31 | 12 | 4 | 665 | 25.26 | <0.001 | |
| R putamen | 36 | 0 | −3 | 16.66 | <0.001 | ||
| R putamen | 27 | 17 | −7 | 15.85 | <0.001 | ||
| L amygdala | −27 | 3 | −19 | 40 | 13.82 | <0.001 | |
| L substantia nigra | −10 | −18 | −10 | 16 | 8.72 | <0.001 | |
| R substantia nigra | 10 | −16 | −10 | 17 | 8.46 | <0.001 | |
| Left AI (−) | R caudate | 20 | −2 | 23 | 6 | 4.95 | 0.001 |
| Right AI (+) | R putamen | 31 | 12 | 4 | 744 | 36.98 | <0.001 |
| R putamen | 36 | 0 | −3 | 25.19 | <0.001 | ||
| R putamen | 27 | 17 | −7 | 25.14 | <0.001 | ||
| L putamen | −27 | 12 | 7 | 453 | 16.12 | <0.001 | |
| L putamen | −27 | 12 | −7 | 14.46 | <0.001 | ||
| L ventral striatum | −20 | 7 | −12 | 11.88 | <0.001 | ||
| R substantia nigra | 10 | −18 | −10 | 18 | 11.77 | <0.001 | |
| L amygdala | −24 | 3 | −19 | 8 | 8.04 | <0.001 | |
| R amygdala | 27 | 3 | −19 | 14 | 7.66 | <0.001 | |
| Right AI (−) | L caudate | −6 | 14 | 9 | 19 | 5.43 | <0.001 |
| dACC (+) | R ventral striatum | 15 | 17 | −5 | 495 | 23.80 | <0.001 |
| R putamen | 27 | 17 | −7 | 15.58 | <0.001 | ||
| R putamen | 29 | 14 | 7 | 9.79 | <0.001 | ||
| L VS | −13 | 17 | −5 | 398 | 21.63 | <0.001 | |
| L putamen | −27 | 12 | 7 | 6.40 | <0.001 | ||
| R hippocampus | 29 | −37 | −5 | 23 | 10.50 | <0.001 | |
| R hippocampus | 29 | −25 | −12 | 8.66 | <0.001 | ||
| L hippocampus | −27 | −37 | −5 | 14 | 9.90 | <0.001 | |
| L hippocampus | −29 | −27 | −12 | 6.62 | <0.001 | ||
| L substantia nigra | −6 | −14 | −12 | 7 | 7.37 | <0.001 | |
| R substantia nigra | 8 | −11 | −10 | 6 | 7.06 | <0.001 | |
| dACC (−) | R amygdala | 27 | −4 | −14 | 79 | 11.15 | <0.001 |
| L amygdala | −24 | −4 | −19 | 92 | 10.83 | <0.001 | |
| L putamen | −31 | −14 | −7 | 20 | 6.77 | <0.001 | |
| L putamen | −27 | −7 | −7 | 5.94 | <0.001 | ||
| L caudate | −17 | −18 | 21 | 25 | 6.77 | <0.001 | |
| L caudate | −10 | −4 | 16 | 6.08 | <0.001 | ||
| R putamen | 34 | −2 | 7 | 47 | 5.70 | <0.001 | |
| R putamen | 29 | −14 | 4 | 5.35 | <0.001 | ||
| R caudate | 13 | −9 | 18 | 5 | 5.64 | <0.001 | |
| L putamen | −29 | −4 | 9 | 6 | 5.31 | <0.001 | |
| R putamen | 29 | −7 | −7 | 5 | 5.22 | <0.001 | |
| R caudate | 17 | −18 | 21 | 7 | 5.11 | 0.001 | |
| Left dlPFC (+) | L caudate | −15 | 17 | 4 | 374 | 14.64 | <0.001 |
| L putamen | −24 | 14 | 7 | 10.29 | <0.001 | ||
| R caudate | 20 | 19 | 7 | 146 | 10.58 | <0.001 | |
| Left dlPFC (−) | R amygdala | 22 | −2 | −14 | 151 | 12.99 | <0.001 |
| R amygdala | 29 | 0 | −19 | 11.98 | <0.001 | ||
| R hippocampus | 29 | −18 | −14 | 9.78 | <0.001 | ||
| L amygdala | −22 | −4 | −14 | 116 | 10.44 | <0.001 | |
| L hippocampus | −29 | −14 | −14 | 7.74 | <0.001 | ||
| R substantia nigra | 15 | −20 | −7 | 12 | 10.43 | <0.001 | |
| R putamen | 34 | −14 | −7 | 65 | 9.18 | <0.001 | |
| R putamen | 31 | −18 | 2 | 5.75 | <0.001 | ||
| R ventral striatum | 6 | 10 | −3 | 55 | 8.49 | <0.001 | |
| R caudate | 10 | 0 | 11 | 4.89 | 0.001 | ||
| L ventral striatum | −3 | 12 | −10 | 10 | 7.51 | <0.001 | |
| R putamen | 34 | −7 | 9 | 5 | 5.58 | <0.001 | |
| Right dlPFC (+) | R putamen | 29 | 17 | 2 | 322 | 14.05 | <0.001 |
| R caudate | 17 | 19 | 4 | 10.24 | <0.001 | ||
| L caudate | −17 | 21 | 4 | 13 | 6.50 | <0.001 | |
| R putamen | 34 | 5 | −3 | 5 | 6.37 | <0.001 | |
| Right dlPFC (−) | L amygdala | −20 | −4 | −14 | 157 | 13.29 | <0.001 |
| L hippocampus | −29 | −14 | −14 | 10.44 | <0.001 | ||
| L hippocampus | −29 | −20 | −10 | 9.72 | <0.001 | ||
| L substantia nigra | −15 | −20 | −7 | 11 | 12.50 | <0.001 | |
| L ventral striatum | −3 | 10 | −5 | 195 | 10.65 | <0.001 | |
| L caudate | −6 | 19 | 7 | 8.47 | <0.001 | ||
| L caudate | −10 | 19 | 14 | 7.66 | <0.001 | ||
| R amygdala | 27 | −4 | −14 | 100 | 10.53 | <0.001 | |
| R hippocampus | 29 | −14 | −14 | 6.39 | <0.001 | ||
| L putamen | −31 | −14 | −7 | 57 | 10.43 | <0.001 | |
| R ventral striatum | 6 | 10 | −7 | 13 | 7.41 | <0.001 | |
| L putamen | −17 | 5 | 7 | 17 | 6.08 | <0.001 | |
| dmPFC (+) | No suprathreshold clusters | ||||||
| dmPFC (−) | L caudate | −15 | 24 | 0 | 442 | 12.67 | <0.001 |
| L putamen | −27 | 14 | 2 | 8.96 | <0.001 | ||
| L caudate | −3 | 14 | 7 | 6.92 | <0.001 | ||
| L caudate | 13 | 24 | −3 | 401 | 11.78 | <0.001 | |
| R ventral striatum | 17 | 12 | −7 | 8.13 | <0.001 | ||
| R ventral striatum | 6 | 10 | −3 | 7.28 | <0.001 | ||
| L hippocampus | −29 | −37 | −3 | 6 | 7.89 | <0.001 | |
| R hippocampus | 29 | −39 | 0 | 7 | 6.32 | <0.001 | |
| R hippocampus | 31 | −34 | −7 | 5.32 | <0.001 | ||
| L caudate | −13 | −4 | 21 | 41 | 6.25 | <0.001 | |
| L caudate | −17 | 12 | 21 | 5.40 | <0.001 | ||
| Right IFC (+) | R caudate | 15 | 0 | 14 | 165 | 12.62 | <0.001 |
| R putamen | 20 | 5 | 7 | 8.17 | <0.001 | ||
| R putamen | 22 | 5 | −3 | 5.80 | <0.001 | ||
| R putamen | 31 | 14 | −3 | 160 | 12.18 | <0.001 | |
| R putamen | 34 | 5 | −3 | 11.65 | <0.001 | ||
| R putamen | 36 | −11 | −7 | 11.62 | <0.001 | ||
| R substantia nigra | 10 | −18 | −12 | 8 | 6.57 | <0.001 | |
| R amygdala | 24 | −2 | −14 | 8 | 5.62 | <0.001 | |
| Right IFC (−) | L ventral striatum | −10 | 21 | −3 | 201 | 9.51 | <0.001 |
| R caudate | 20 | 26 | 2 | 71 | 8.64 | <0.001 | |
| R caudate | 17 | 19 | 16 | 6.77 | <0.001 | ||
| pre-SMA (+) | L caudate | −15 | 10 | 11 | 348 | 17.05 | <0.001 |
| L putamen | −20 | 3 | 4 | 10.27 | <0.001 | ||
| L putamen | −22 | 19 | −7 | 7.94 | <0.001 | ||
| R caudate | 17 | 12 | 9 | 236 | 15.03 | <0.001 | |
| pre-SMA (−) | L hippocampus | −31 | −34 | −7 | 144 | 10.93 | <0.001 |
| L hippocampus | −29 | −27 | −14 | 9.45 | <0.001 | ||
| L amygdala | −22 | −2 | −17 | 9.17 | <0.001 | ||
| R amygdala | 22 | −7 | −21 | 159 | 10.45 | <0.001 | |
| R hippocampus | 27 | −14 | −19 | 10.16 | <0.001 | ||
| R hippocampus | 31 | −27 | −14 | 10.15 | <0.001 | ||
| R ventral striatum | 6 | 10 | −7 | 23 | 9.76 | <0.001 | |
| L ventral striatum | −3 | 12 | −10 | 33 | 9.08 | <0.001 | |
| R putamen | 36 | −9 | 2 | 8 | 8.32 | <0.001 | |
| R putamen | 34 | −14 | 2 | 5 | 5.25 | <0.001 | |
| vmPFC (+) | L hippocampus | −27 | −37 | −5 | 100 | 18.07 | <0.001 |
| L hippocampus | −29 | −18 | −17 | 14.40 | <0.001 | ||
| L hippocampus | −24 | −9 | −24 | 8.82 | <0.001 | ||
| L ventral striatum | −3 | 10 | −10 | 181 | 17.79 | <0.001 | |
| R ventral striatum | 6 | 12 | −7 | 170 | 16.85 | <0.001 | |
| R hippocampus | 29 | −34 | −7 | 128 | 16.43 | <0.001 | |
| R hippocampus | 29 | −18 | −17 | 16.39 | <0.001 | ||
| R hippocampus | 31 | −27 | −12 | 15.06 | <0.001 | ||
| vmPFC (−) | L caudate | −10 | −2 | 16 | 278 | 11.10 | <0.001 |
| L putamen | −22 | −2 | 4 | 6.29 | <0.001 | ||
| L putamen | −31 | 0 | −3 | 5.12 | <0.001 | ||
| R caudate | 13 | −4 | 16 | 95 | 8.02 | <0.001 | |
| R caudate | 17 | −18 | 21 | 5.17 | <0.001 | ||
| R putamen | 20 | 7 | 7 | 61 | 6.60 | <0.001 | |
| R putamen | 34 | 5 | 0 | 6.48 | <0.001 |
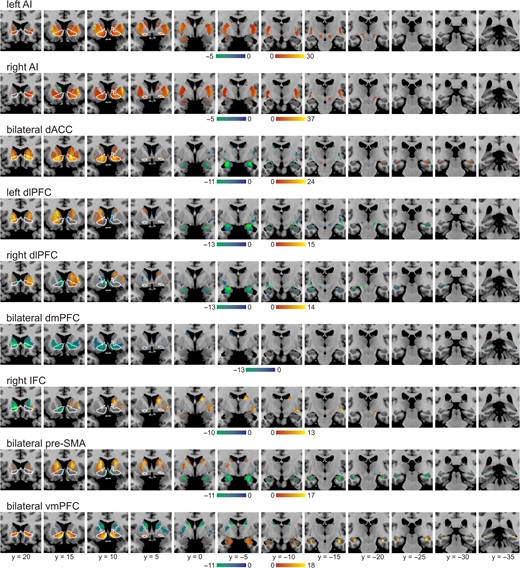
Seed-to-whole brain resting-state functional connectivity of known and potential noninvasive stimulation targets. Results of the seed-to-whole brain resting-state functional connectivity masked with a network computed from the subcortical ROIs: striatum (VS is outlined in white), amygdala, hippocampus and SN. Images displayed at P < 0.006 (FWE-corrected) and k > 0.
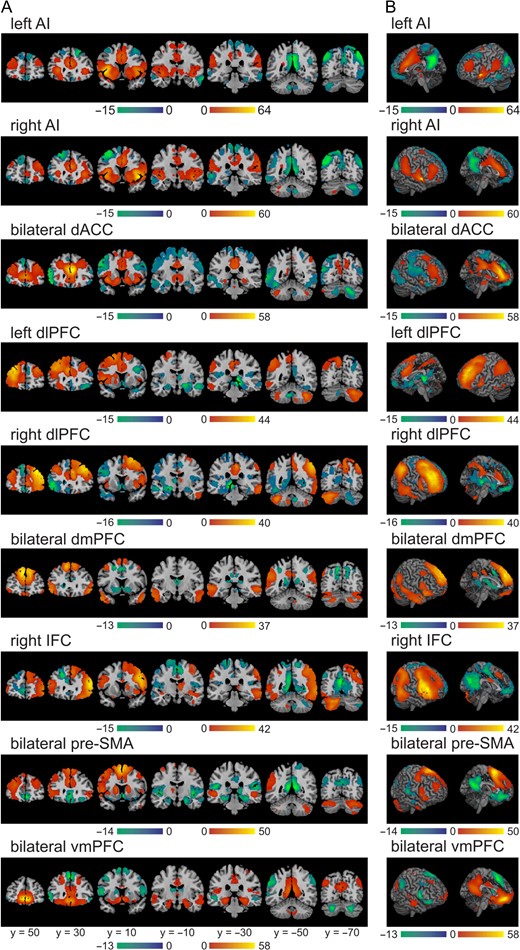
Seed-to-whole-brain resting-state functional connectivity of known and potential noninvasive stimulation targets. Results of the seed-to-whole brain resting-state functional connectivity in (A) representative slices and (B) cortex and midline. Images displayed at P < 0.006 (FWE-corrected) and k > 0.
Both left and right AI were functionally correlated with VS, caudate, and putamen, while showing a small cluster within the contralateral caudate that was anticorrelated with the seed. Further, the left AI was correlated with bilateral SN and ipsilateral amygdala, while the right AI showed the opposite pattern of correlation with ipsilateral SN and bilateral amygdala. Neither seed was significantly correlated with the hippocampus.
The dACC was significantly correlated with the VS and the anterior portions of the caudate and putamen, while the posterior portions showed small anticorrelated clusters. This seed was also correlated with bilateral SN as well as with posterior portions of the hippocampus, bilaterally. Furthermore, the dACC was significantly anticorrelated with bilateral amygdala.
Both left and right dlPFC were mostly positively associated with parts of the ipsilateral VS, as well as ipsilateral caudate and putamen, while showing mostly negative connections to portions of the contralateral structures. Both seeds were anticorrelated with bilateral amygdala and hippocampus, as well as with the contralateral SN.
The dmPFC was anticorrelated with bilateral VS, caudate and putamen, as well as with posterior portions of bilateral hippocampus. However, this region showed no significant correlations with amygdala or SN.
The right IFC was functionally correlated with ipsilateral caudate and putamen, but anticorrelated with the contralateral VS and caudate, as well as with anterior portions of the ipsilateral caudate. Further, this seed was positively associated with the ipsilateral amygdala and SN. However, it was not significantly correlated with the hippocampus.
The pre-SMA showed correlations with bilateral caudate and putamen, but was strongly anticorrelated with amygdala and hippocampus, as well as with parts of the VS and posterior putamen. However, this seed showed no significant correlation with SN.
Finally, the vmPFC was functionally correlated with bilateral VS, amygdala, and hippocampus, while anticorrelated with bilateral caudate and putamen. However, it was not significantly correlated with SN.
Seed-to-ROI Connectivity
Fisher z-transformed correlation coefficients were inputted in rmANOVAs for each of the 6 ROIs with the factor seed (Fig. 3 A); all P-values reported are stringently Bonferroni-corrected P-values.
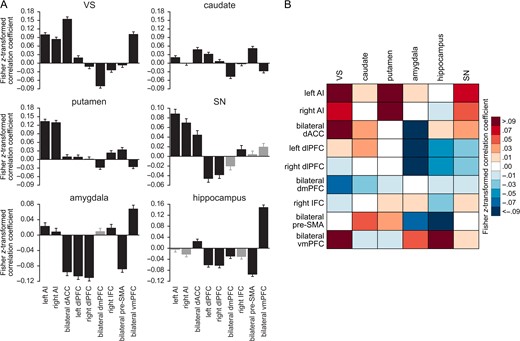
Seed-to-ROI analyses on resting-state functional connectivity of known and potential noninvasive stimulation targets. (A) Results of the post hoc tests on the seed-to-ROI analyses. Seeds that had demonstrated no statistically significant connectivity in the seed-to-whole brain analysis are represented with grey bars. Error bars represent the standard error of the mean. (B) Summary of the connectivity patterns revealed by the seed-to-ROI analyses. Red indicates correlation and blue anticorrelation; darker colors indicate stronger connectivity.
The rmANOVAs showed significant differences between the 9 seeds in seed-to-VS, F(6 849) = 98.84, η2G = 0.35, P < 0.001, seed-to-caudate, F(7 955) = 24.32, η2G = 0.11, P < 0.001, and seed-to-putamen connectivity, F(6 890) = 68.26, η2G = 0.26, P < 0.001. On post hoc analysis (Table 2), the bilateral dACC was more strongly correlated and the bilateral dmPFC more anticorrelated with the VS than any other seed explored, while both AI seeds and the bilateral vmPFC (with no differences between left and right AI, and bilateral vmPFC) showed stronger seed-to-VS correlations than dlPFC, IFC, and pre-SMA. In the case of connectivity to the caudate, however, post hoc t-tests revealed that the bilateral dmPFC was more functionally anticorrelated than any other seed (with no differences between dmPFC and vmPFC), while both bilateral dACC and pre-SMA were more positively correlated with the caudate than right AI, right dlPFC, right IFC, and bilateral vmPFC. There were further differences in seed-to-caudate connectivity between bilateral vmPFC and left AI and dlPFC. Finally, both AI seeds (with no differences between left and right AI) were more functionally correlated with the putamen than any of the other seeds; further significant differences existed between pre-SMA and both dmPFC and vmPFC, and between dmPFC and right IFC.
Results of the pairwise comparisons performed on the average Fisher z-transformed correlation coefficients of the ROIs for the 9 seeds used in the resting-state functional connectivity analyses. Six ROIs were selected: VS, caudate, putamen, amygdala, hippocampus and SN. The 9 seeds used were left and right AI, bilateral dACC, left and right dlPFC, bilateral dmPFC, right IFC, bilateral pre-SMA and bilateral vmPFC. All P-values (significance threshold P < 0.05) are Bonferroni-corrected for 9 seeds, 6 ROIs and the number of pairwise comparisons performed (“–” denotes not performed comparisons)
| ROI | Seed | Seed | |||||||
|---|---|---|---|---|---|---|---|---|---|
| Left AI | Right AI | Bilateral dACC | Left dlPFC | Right dlPFC | Bilateral dmPFC | Right IFC | Bilateral pre-SMA | ||
| VS | Right AI | n.s. | |||||||
| Bilateral dACC | <0.001 | <0.001 | |||||||
| Left dlPFC | <0.001 | <0.001 | <0.001 | ||||||
| Right dlPFC | <0.001 | <0.001 | <0.001 | n.s. | |||||
| Bilateral dmPFC | <0.001 | <0.001 | <0.001 | <0.001 | <0.001 | ||||
| Right IFC | <0.001 | <0.001 | <0.001 | ns | n.s. | <0.001 | |||
| Bilateral pre-SMA | <0.001 | <0.001 | <0.001 | n.s. | n.s. | <0.001 | n.s. | ||
| Bilateral vmPFC | n.s. | n.s. | 0.002 | <0.001 | <0.001 | <0.001 | <0.001 | <0.001 | |
| Caudate | Right AI | n.s. | |||||||
| Bilateral dACC | n.s. | <0.001 | |||||||
| Left dlPFC | n.s. | n.s. | n.s. | ||||||
| Right dlPFC | n.s. | n.s. | 0.012 | n.s. | |||||
| Bilateral dmPFC | <0.001 | 0.037 | <0.001 | <0.001 | <0.001 | ||||
| Right IFC | n.s. | n.s. | 0.007 | n.s. | n.s. | 0.007 | |||
| Bilateral pre-SMA | n.s. | 0.002 | n.s. | n.s. | 0.011 | <0.001 | <0.001 | ||
| Bilateral vmPFC | 0.008 | n.s. | <0.001 | <0.001 | n.s. | n.s. | n.s. | <0.001 | |
| Putamen | Right AI | n.s. | |||||||
| Bilateral dACC | <0.001 | <0.001 | |||||||
| Left dlPFC | <0.001 | <0.001 | n.s. | ||||||
| Right dlPFC | <0.001 | <0.001 | n.s. | n.s. | |||||
| Bilateral dmPFC | <0.001 | <0.001 | n.s. | n.s. | n.s. | ||||
| Right IFC | <0.001 | <0.001 | n.s. | n.s. | n.s. | 0.011 | |||
| Bilateral pre-SMA | <0.001 | <0.001 | n.s. | n.s. | n.s. | <0.001 | n.s. | ||
| Bilateral vmPFC | <0.001 | <0.001 | n.s. | n.s. | n.s. | n.s. | n.s. | <0.001 | |
| Amygdala | Right AI | n.s. | |||||||
| bilateral dACC | <0.001 | <0.001 | |||||||
| Left dlPFC | <0.001 | <0.001 | n.s. | ||||||
| Right dlPFC | <0.001 | <0.001 | n.s. | n.s. | |||||
| Bilateral dmPFC | – | – | – | – | – | ||||
| Right IFC | n.s. | n.s. | <0.001 | <0.001 | <0.001 | – | |||
| Bilateral pre-SMA | <0.001 | <0.001 | n.s. | n.s. | n.s. | – | <0.001 | ||
| Bilateral vmPFC | n.s. | n.s. | <0.001 | <0.001 | <0.001 | – | n.s. | <0.001 | |
| Hippocampus | Right AI | – | |||||||
| Bilateral dACC | – | – | |||||||
| Left dlPFC | – | – | <0.001 | ||||||
| Right dlPFC | – | – | <0.001 | n.s. | |||||
| Bilateral dmPFC | – | – | 0.018 | n.s. | n.s. | ||||
| Right IFC | – | – | – | – | – | – | |||
| Bilateral pre-SMA | – | – | <0.001 | n.s. | n.s. | <0.001 | – | ||
| Bilateral vmPFC | – | – | <0.001 | <0.001 | <0.001 | <0.001 | – | <0.001 | |
| SN | Right AI | n.s. | |||||||
| Bilateral dACC | 0.013 | n.s. | |||||||
| Left dlPFC | <0.001 | <0.001 | <0.001 | ||||||
| Right dlPFC | <0.001 | <0.001 | <0.001 | n.s. | |||||
| Bilateral dmPFC | – | – | – | – | |||||
| Right IFC | <0.001 | <0.001 | n.s. | 0.001 | <0.001 | – | |||
| Bilateral pre-SMA | – | – | – | – | – | – | – | ||
| Bilateral vmPFC | – | – | – | – | – | – | – | – | |
The rmANOVA further revealed significant differences between the 8 seeds (left and right AI, bilateral dACC, left and right dlPFC, right IFC, bilateral pre-SMA, bilateral vmPFC) in seed-to-amygdala connectivity, F(5 763) = 65.67, η2G = 0.25, P < 0.001. On post hoc, this was driven by bilateral dlPFC, dACC, and pre-SMA (with no differences between these 4 seeds) being more strongly anticorrelated with the amygdala than bilateral AI, right IFC and vmPFC. Differences in seed-to-hippocampus connectivity were also evidenced by the rmANOVA performed on 6 seeds (bilateral dACC, left and right dlPFC, bilateral dmPFC, bilateral pre-SMA, bilateral vmPFC), F(4 626) = 108.48, η2G = 0.37, P < 0.001. Post hoc testing showed that bilateral vmPFC was more positively correlated with this ROI than any other seed. Further, bilateral pre-SMA connectivity to the hippocampus was significantly more negative than for any other seed, except for bilateral dlPFC. The latter seeds were significantly more anticorrelated with the hippocampus than bilateral dACC, and there was a final significant difference between bilateral dmPFC and dACC.
The final rmANOVA revealed significant differences between the 6 seeds (left and right AI, bilateral dACC, left and right dlPFC, right IFC) in seed-to-SN connectivity, F(4 563) = 57.72, η2G = 0.19, P < 0.001. On post hoc this was once again driven by both left and right AI being significantly more correlated with the SN than any other seed, with no differences between left and right AI, nor right AI and dACC. Further, the dlPFC, bilaterally, was more strongly anticorrelated with the SN than the right IFC, whereas bilateral dACC was more positively correlated with the SN than the dlPFC.
The differential patterns of connectivity of these seed-to-ROI analyses are summarized in Figure 3B.
Discussion
We report on functional connectivity of existing and emerging targets for noninvasive stimulation for disorders of addiction, comparing connectivity patterns to distal subcortical ROIs relevant to addictions in a sample of 145 healthy participants. Previous findings have demonstrated the link between invasive and noninvasive stimulation targets (Fox et al. 2014). Our results add to this body of work by providing evidence that cortical sites could be used to selectively target certain addiction-related subcortical regions based on their stronger connectivity, for instance stimulating dACC or AI to influence the VS or dlPFC to influence the amygdala. Our findings highlight possible mechanisms that might underlie efficacy of different cortical stimulation targets and further suggest that the selection of targets may be individualized based on known functional activity, connectivity patterns or cognitive endophenotypes.
Striatal Connectivity
The VS, and more specifically the NAcc, plays a central role in the pathophysiology of addiction (Everitt and Robbins 2005) and deep brain stimulation of this structure has been used successfully in small studies of treatment-refractory alcohol (Kuhn et al. 2007; Voges et al. 2013) and heroin dependence (Zhou et al. 2011; Kuhn et al. 2014), and has been incidentally found to reduce cigarette smoking (Kuhn et al. 2009; Mantione et al. 2010). In this study we show that, of the studied regions, bilateral AI appears to be most extensively connected with the striatum, with positive functional correlations with VS and putamen, making it a promising stimulation target. However, it should be taken into consideration that the deep stimulation needed to target the AI might also reach these subcortical structures (for an analysis of the induced fields during deep TMS, see Lu and Ueno 2017). We further show that bilateral dACC and vmPFC also are strongly correlated with the VS, suggesting they might be relevant if attempting to selectively target this distal region. However, the most commonly used target, the dlPFC, is mostly associated with the anterodorsal portion of the ipsilateral striatum, although in ROI analysis it does not appear to have markedly different striatal connectivity compared with other targets. In contrast, the dmPFC is predominantly characterized by negative connectivity with the VS, and less strongly with dorsal striatum, whereas the pre-SMA has mostly positive caudate connectivity.
These findings highlight potential target-dependent effects on cognitive function, and how stimulation frequency may be highly relevant (Nitsche and Paulus 2000; Post and Keck 2001). Indeed, previous studies have shown how low-frequency rTMS can result in an increase of the intrinsic correlations between multiple nodes within a resting-state network, with high-frequency rTMS showing the opposite effect (Vercammen et al. 2010; Eldaief et al. 2011). Our data suggest that attempts to influence VS function relevant to drug cue reactivity processes via cortical stimulation might yield very different results given whether these targets are positively (AI, dACC, vmPFC), negatively (dmPFC) or not considerably (right IFC, pre-SMA) correlated with the VS. Moreover, the currently favored dlPFC target (Mishra et al. 2010; Klauss et al. 2014) influences anterodorsal striatum and appears to have less strong connectivity to the VS than other cortical regions shown here, potentially explaining previous inconsistent stimulation results (Mishra et al. 2010; Höppner et al. 2011; Ceccanti et al. 2015; Terraneo et al. 2016). Our findings suggest that pre-SMA targeting may be more relevant when attempting to influence caudate-related functions such as goal-directed behaviors (Gläscher et al. 2010) or reactive inhibitory processes (Aron et al. 2007). In contrast, the AI and dmPFC may be relevant in attempts to influence putamen-related habitual behaviors, but notably with opposing direction of connectivity.
Within the studied targets, only AI, dACC and medial PFC seeds show strong functional connections to VS. It is particularly noteworthy that the dmPFC is anticorrelated with the VS, while dACC and vmPFC are positively correlated with this structure. Anatomical connectivity of the vmPFC and dACC in primates shows projections to subregions of the VS, with the focal projection field from the vmPFC concentrated within the NAcc, whereas the dmPFC projects to dorsomedial striatum and not VS (Haber and Knutson 2009). Our findings at rest are intriguing, but their functional relevance is not yet clear. The prelimbic PFC has been recently shown to exert suppressive control over reward-related signaling between dopaminergic midbrain and striatum in rats. Elevation of prelimbic PFC excitability led to suppression of striatal dopamine, inducing a decrease of reward-seeking behaviors (Ferenczi et al. 2016). Indeed, optogenetic stimulation of the prelimbic cortex prevents drug-seeking in cocaine-seeking rats (Chen, Yau, et al. 2013), although the exact homology of prelimbic rodent cortex with human PFC remains to be established. Altogether, these findings might open a new door for certain treatments, suggesting that the negative dmPFC–VS relationship seen in our resting-state data might also act as a potential target for noninvasive cortical stimulation. Moreover, the fact that adjacent regions within the medial PFC are both correlated and anticorrelated with the VS emphasizes the importance of selective stimulation, and shows how indirectly targeting the VS through noninvasive stimulation of the dACC might not be trivial.
Our findings also highlight the potential of the vmPFC as a stimulation target. The vmPFC is a critical node within the reward circuit (Haber and Knutson 2009) and the neurocircuitry of addiction (Everitt and Robbins 2005; Koob and Volkow 2010). White matter integrity between vmPFC and NAcc has been shown to be correlated with better reward learning performance (Samanez-Larkin et al. 2012), and tract strength between this region and striatum has shown to predict reward dependence (Cohen et al. 2009). Patients with lesions to the vmPFC have been reported to have decreased NAcc volumes, as well as reduced VS responses during reward anticipation (Pujara et al. 2016) and altered relative risk tolerance for prospective gains and losses (Pujara et al. 2015). It has been suggested that the medial PFC controls the representation of contingencies, outcome values and subjective states associated to drugs, and that the transition from goal-directed to more habitual actions in drug-seeking might reflect a transition from PFC to striatal control (Everitt and Robbins 2005).
The direct anatomical AI to VS connection established in animal studies (Chikama et al. 1997; Schilman et al. 2008) has been demonstrated in humans by identifying projection tracts through the subcaudate white matter from AI to NAcc (Leong et al. 2016). Moreover, AI–VS connections have been linked to risk taking (Leong et al. 2016), reward anticipation and goal-directed action (Parkes et al. 2015), and suggested to modulate the transition between impulsive and compulsive behaviors (Weller et al. 2009; He et al. 2014; Belin-Rauscent et al. 2016). AI–NAcc tract coherence in humans is associated with lower impulsivity (Leong et al. 2016), whereas insula damage results in the impaired ability to adjust for expected values, leading to altered decision-making under risk (Weller et al. 2009). Indeed, the formation of maladaptive habits is key in the development of substance addiction (Everitt and Robbins 2005; Koob and Volkow 2010). Parkes et al. (2015) recently showed that AI–VS disconnection in rats leads to impaired outcome devaluation, resulting in the predominance of the habit over the goal-directed system. The AI and VS are also key nodes in the salience network relevant to drug cue reactivity.
We also show that the AI is the studied seed most strongly functionally correlated the SN. Midbrain dopaminergic regions play a key role in reinforcement processes (Berridge and Robinson 1998), which are crucial in the establishment and maintenance of addiction (Everitt and Robbins 2005; Koob and Volkow 2010). dlPFC shows negative connectivity with SN suggesting potential mechanisms that might underlie observations of enhanced striatal dopamine release with low-frequency rTMS of this region (Ko et al. 2008).
Amygdala and Hippocampal Connectivity
Amygdala and hippocampus are central nodes in drug craving (Koob and Volkow 2010). Both amygdala and hippocampus volumes have been found to be reduced in alcohol dependent subjects and binge drinkers (Makris et al. 2008; Howell et al. 2013; Mole et al. 2016), and heavy cannabis users (Schacht et al. 2012). Reduced amygdala, but not hippocampus, volumes have also been described in cocaine-dependent individuals (Makris et al. 2004). In resting-state, we demonstrate that dlPFC and pre-SMA show the strongest functional anticorrelations to both amygdala and hippocampus, whereas vmPFC shows the strongest correlation to both ROIs. In contrast, the dACC is strongly anticorrelated with the amygdala, but positively correlated with the hippocampus Indeed, a number of studies have reported decreased craving following high-frequency stimulation of the dlPFC (Camprodon et al. 2007; Politi et al. 2008; Mishra et al. 2010; Rapinesi et al. 2013; Girardi et al. 2015), which we suggest may be potentially mediated via an influence on distal mesial temporal regions. Further highlighting the importance of stimulation frequency, decreases in craving have been reported following low-frequency stimulation of the vmPFC (Hanlon et al. 2015).
The hippocampus is thought to play a central role in contextual conditioning in drug addiction (Everitt and Robbins 2005) and it has been shown that hippocampus-dependent memory formation is enhanced by reward-related activity (Wittmann et al. 2005). In rodents, hippocampus inactivation has been shown to suppress contextual reinstatement of cocaine-seeking behavior (Fuchs et al. 2005), whereas theta-burst stimulation of this structure reinstates extinguished cocaine-seeking behavior (Vorel et al. 2001).
The amygdala is particularly relevant to associative processes underlying the development of drug cues. Rodent studies have demonstrated that inactivation of different nuclei of the amygdala impairs the acquisition of drug-seeking behavior (Whitelaw et al. 1996), and prevents or attenuates alcohol cue-conditioned behavior (Millan et al. 2015). Further, selective lesions to the basolateral amygdala increase impulsive behavior (Winstanley et al. 2004). In both rodent and human studies, the amygdala has been implicated in memory reconsolidation, a process potentially relevant to therapeutic management of drug cues (Lee et al. 2006; Schwabe et al. 2014).
A recent study has found that the combination of low VS and high amygdala reactivity, as well as the opposite pattern, can predict problem drinking in young adults (Nikolova et al. 2016). Functional connectivity represents the level of linear association between 2 time series and, in particular, the interpretation of anticorrelations has been under debate (Fox et al. 2009), though it has been suggested that anticorrelated activity might relate to differential task-related responses in these structures (Greicius et al. 2003; Fox et al. 2005). How excitatory or inhibitory stimulation influences the direction of connectivity remains to be established. It has been shown that excitatory dlPFC stimulation enhances the negative connectivity between the central executive and the default mode networks, with inhibitory stimulation increasing the frequency range of the default mode network, suggesting its disinhibition (Chen, Oathes, et al. 2013). Further studies have shown similar patterns of high-frequency stimulation decreasing and low-frequency stimulation increasing connectivity patterns with other structures in networks observed at rest (van der Werf et al. 2010; Vercammen et al. 2010; Eldaief et al. 2011; Valchev et al. 2015). In the case of theta burst stimulation, it has been hypothesized that it might either inhibit the stimulated site and consequently disrupt the coactivation of further regions, or that the initial inhibition of the stimulation site might spread to other structures within the network (Mastropasqua et al. 2014). The work by Fox et al. (2014) strongly points to a link between positive and negative connectivity and efficacious noninvasive inhibitory and excitatory brain stimulation. Evidence suggests that, rather than just the local effect on the stimulated region, rTMS-induced changes in remote connectivity might underlie observed clinical outcomes (Grefkes et al. 2010; Vercammen et al. 2010; Fox, Buckner, et al. 2012; Philip et al. in press). Recent work has further highlighted the importance of network targeting in noninvasive stimulation, by demonstrating that multifocal tDCS substantially increased primary motor cortex excitability compared to tDCS targeting a single brain region (Fischer et al. 2017). Together with these studies, our observations with healthy subjects at rest suggest that specific cortical targeting depending on known cognitive endophenotypes might improve clinical outcomes, for example, by specifically targeting the VS with AI or dmPFC stimulation and the amygdala with dlPFC or pre-SMA stimulation.
Conclusion
In conclusion, we highlight differential patterns of subcortical functional connectivity depending on the cortical seed. We show the relevance of dACC and vmPFC as emerging cortical targets, and further emphasize the AI as a potential promising target for noninvasive stimulation in the treatment of addiction, given its strong connections to VS, putamen, and SN. Our findings suggest that careful target selection based on known functional connectivity, consideration of direction of effect, along with the identification of cognitive endophenotypes to guide target selection might be crucial to therapeutic efficacy and may further lead to optimized personalized medicine approaches.
Supplementary Material
Supplementary material is available at Cerebral Cortex online.
Funding
Wellcome Trust as part of a Wellcome Trust Intermediate Fellowship to V.V. (983 705/Z/10/Z); Senior Clinical Fellowship of the Medical Research Council (MR/P008747/1 to V.V.); Research Fellowship of the Deutsche Forschungsgemeinschaft (DO1915/1-1 to N.D.).
Notes
Conflict of Interest: None declared.
References