


Abstract
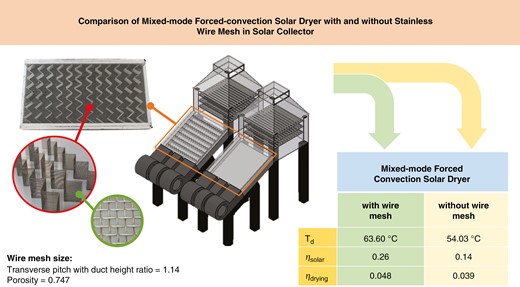
A mixed-mode forced-convection solar dryer (MMFCSD) is a device that utilizes both direct and indirect solar energy. The solar collector, which stores thermal energy for indirect solar uses, is an essential component of the dryer. Unfortunately, the thermal efficiency of this device is generally low. In this study, a technique was employed to improve the heat transfer of the solar collector in a MMFCSD. The technique involved adjusting the air flow pattern into a swirling flow to disturb the thermal boundary layer on the absorber plate under forced convection by using stainless wire mesh. The experiment was conducted under actual conditions and bananas were used as the drying sample. The experimental results of the thermal efficiency of the solar collector (ƞsolar) and the drying efficiency (ƞdrying) are presented. The results indicated that the air outlet temperature and ƞsolar of the solar collector with stainless wire mesh were higher than the case without stainless wire mesh, reaching a maximum temperature of 46.22°C and 37.97°C, and average ƞsolar of 0.26 ± 0.02 and 0.14 ± 0.01, respectively. The MMFCSD with stainless wire mesh had a higher ƞdrying than the case without stainless wire mesh, with values of 0.048 ± 0.004 and 0.039 ± 0.003, respectively, resulting in an ~23.07% increase. This was attributed to the air swirling flow through the stainless wire mesh and the heat accumulation in the drying chamber, which led to an increase in the drying chamber temperature from 54.03°C to 63.60°C, an increase in the effective moisture diffusivity from 7.28 × 10⁻⁷ to 1.19 × 10⁻⁶ m2/s and a decrease in the drying time of 5 h 30 min. However, further research is needed to investigate the quality of the dried samples and their economic value.
Introduction
Agri-products are crucial export commodities for many countries worldwide. However, their moisture content poses a significant spoilage risk during storage and transportation. To mitigate this problem, farmers have long used open sun drying (OSD), also known as direct sun drying (DSD), to reduce the moisture content of agricultural products. Nonetheless, the final product quality obtained using OSD is typically low due to environmental factors such as smoke, dust or animals that may disturb the drying area [1–3]. These problems can be solved by using an opaque drying cabinet and indirect solar drying (ISD) with solar-thermal systems. These systems capture and convert sunlight into usable thermal energy, employing solar collectors and solar air heaters. These devices are necessary to generate sensible heat for moisture removal [4]. This technique is also suitable for agricultural products that are sensitive to sunlight as it helps to preserve beneficial substances and quality after drying. The moisture content in agricultural products depends on the relative humidity and ambient air temperature [5].
Solar drying has been widely studied and classified into several types based on the mode of heat transfer [6]. The first classification is based on the radiation and convection heat transfer, consisting of DSD (the drying product receives solar radiation directly) [7], ISD (the drying product does not receive solar energy directly but uses convection from the air that flows through a device that converts solar energy into heat energy (a solar collector or solar air heater)) [8] and mixed-mode (radiation and convection). The second classification is based on the convection mode: active drying (forced convection drying (FCD) [9]) and passive drying (natural convection drying) [10]. Kumar and Tiwari [11] studied the effect of product mass on the mass transfer coefficient of DSD with a solar greenhouse dryer (SGD) and OSD, using onions as drying samples. The study found that the mass of the drying sample had a significant effect on the mass transfer coefficient for both SGD and OSD. However, SGD produced a higher evaporation rate—especially in the absence of sunlight—due to heat accumulation inside the drying chamber from the greenhouse effect. Elkhadraoui et al. [12]. compared the SGD and OSD methods on drying red peppers and grapes, and found that the drying rate of SGD was higher than that of OSD. Prakash et al. [13] studied the drying efficiency of DSD by constructing a solar greenhouse with a black-painted PVC floor. The experiments found that the greenhouse had a higher drying efficiency than that of OSD while also maintaining the quality of the drying materials. Nabnean and Nimnuan [14] found that the direct forced-convection solar dryer reduced the moisture content of bananas 48% faster than OSD and was able to maintain a maximum drying temperature of 56.3°C in the drying chamber. Lingayat et al. [15] studied and developed an ISD by using heat from a solar collector to dry bananas. The results showed that the ISD performed better than DSD, with the thermal efficiency of the solar collector and DSD dryer being 31.50% and 22.38%, respectively. Similarly, Rabha et al. [16] found the drying rate of ISD to be higher than that of OSD. Reyes et al. [17] used a thermal energy storage material in a solar dryer. As a result, the dryer maintained a drying temperature ~12°C higher than the surrounding temperature. Seerangurayara et al. [18] compared three methods of solar drying for agricultural products, including OSD, SGD and FCD. The results showed that the product dried using the FCD method exhibited the lowest degree of colour change and the best texture, but took longer to dry than under the SGD method. Ortiz-Rodríguez et al. [19] studied rubber sheet drying between DSD and ISD. The results showed that ISD with a solar collector was able to dry the samples 3 h faster than DSD because the moisture content in the drying samples easily evaporated due to the flowing air and forced convection. Several studies have applied the advantages of both ISD and DSD to drying agricultural products. For example, Lakshmi et al. [20] developed a stevia dryer by using a mixed-mode solar dryer that combined DSD and ISD. The experiment was conducted under forced convection with a specified air mass flow rate of0.049 kg/s. A transparent drying chamber was used to achieve heat accumulation under solar intensity of567 W/m2. When compared with OSD, the mixed-mode solar dryer had a faster drying time and higher drying efficiency, as well as the ability to better maintain post-drying product quality. Pruengam et al. [21] developed a mixed-mode solar dryer with a transparent drying chamber and two solar collectors with a total absorber area of 7.00 m2. The study found that the highest temperature in the drying chamber was 62.7°C and the average drying temperature was 54.1°C, which was 13.6°C higher than OSD. Furthermore, the mixed-mode dryer reduced the moisture content of bananas 1.3–1.5 times faster than OSD, with average OSD and solar collector efficiencies of 13.0% and 21.9%, respectively. Ekka et al. [22] studied and developed a mixed-mode forced-convection solar dryer (MMFCSD), with the study revealing that an increase in the air mass flow rate resulted to a decrease in the drying time. Their dryer could dry samples ~4.5 h faster than OSD and with better post-drying product quality. As the drying product was influenced by both convection (indirect solar) and radiation (direct solar), the rate of drying was higher than that achieved using heat from a single solar mode. The temperature inside the chamber is thus a very important parameter for indicating the efficiency of drying [15]. A comparison of temperatures in the drying chambers of different types of solar dryers is shown in Table 1.
Air temperature in drying chamber of solar drying
| Drying mode | Maximum solar radiation (W/m2) | Maximum drying temperature (°C) | Air velocity/flow rate | Absorber plate area (m2) | Reference |
|---|---|---|---|---|---|
| Indirect solar | 1219 | 55.0 | – | 2 | [15] |
| Indirect solar | 1011 | 57.0 | 1.7 m/s | 2 | [16] |
| Direct solar | 1000 | 58.0 | 116 m3/h | – | [14] |
| Direct solar | 1000 | 56.3 | – | – | [19] |
| Direct solar | 878 | 61.2 | – | – | [23] |
| Mixed-mode solar | 795 | 55.9 | 0–20 m/s | 2 | [12] |
| Mixed-mode solar | 1100 | 62.7 | – | 7 | [21] |
| Mixed-mode solar | 115–777 | 61.0 | 1.08–3.72 kg/s | 2.12 | [22] |
| Mixed-mode solar | 880 | 57.0 | 0.3–0.6 m/s | 1.5 | [24] |
The literature review has highlighted that DSD depends on the radiation mode of heat transfer while ISD depends on convection. On the other hand, the MMFCSD is dependent on both heat transfer modes, resulting in a high temperature in the drying chamber and higher drying efficiency than OSD. However, the size of the absorber plate and velocity of air flowing through the solar collector must be considered. The MMFCSD requires a device that converts solar energy into thermal energy, which is then used to heat the air for the drying process. This equipment is commonly known as a solar collector or solar air heater. However, the utilization of the heat energy stored in the absorber plate is still inadequate, leading to low thermal efficiency and heat transfer rate of the device [25–27]. Moreover, when drying at a lower solar intensity, the temperature in the drying chamber decreases. Therefore, researchers are keen to study and develop the MMFCSD with the aim of achieving higher thermal efficiency and increased drying temperature. The focus is on improving the heat transfer rate and heat transfer coefficient of the solar collector, which may lead to an increase in the drying efficiency. Previous studies have suggested that the heat transfer rate can be improved in a solar collector by using fins or baffles, which create a swirling flow that disrupts the thermal boundary layer on the absorber plate. This enables better mixing of the air flow at the core and the absorber plate surface, which results in an increase in the convection heat transfer coefficient and a decrease in thermal resistance—an important mechanism that enhances the heat transfer rate [28–33]. This study focused on stainless wire mesh (SWM) because of its large area-of-heat-transfer-to-volume ratio and its excellent ability to absorb and radiate energy and enhance the heat transfer of the heat exchanger [34–36]. The SWM also has good corrosion and rust-resistance properties, making it suitable for use in drying. Additionally, a previous study found that stainless steel mesh porous material can reduce the specific energy consumption of FCD [37]. In the author’s own work, heat transfer of a solar collector was enhanced by placing SWM SUS304 on an absorber plate, but only in a laboratory study under artificial sunlight. It was found that installing SWM inside a solar collector with a porosity (X) of 0.747 (pores per inch, PPI = 12) and transverse pitch with a duct height ratio (P/h) of 1.14 could effectively increase the heat transfer because the SWM had a large heat transfer area and the porosity of SWM caused swirling flow. As a result, the convective heat transfer coefficient increased [33].
Therefore, this study aimed to improve the drying efficiency of an MMFCSD that utilized two modes of solar drying: DSD with a transparent drying chamber and ISD using a solar collector. Although the solar collector is an important device for storing heat from solar radiation, its heat utilization is still low. To improve the heat transfer rate and the convection heat transfer coefficient of this device, SWM was installed on an absorber plate [33]. The anticipated outcome was that the solar collector would have an increased ability to transfer heat to the drying chamber. Moreover, the transparent drying chamber would accumulate heat from the solar radiation causing a greenhouse effect. The greenhouse effect would allow the temperature in the drying chamber to rise, the rate of drying to increase and the time of drying to reduce. Altogether, this would result in increased drying efficiency.
1 Materials and methods
1.1 MMFCSD
The dryer consisted of two main parts, as follows.
1.1.1 Single-pass flat-plate solar collector
The single-pass flat-plate solar collector is the heat-generating device for the MMFCSD. The solar collector frame was made of angle steel and had a height of 0.1 m, a width of 0.7 m and a length of 1.0 m. The bottom and sides of the collector frame were covered with a galvanized sheet. The absorber plate was made of aluminium, which measured 0.6 m in width and 1.0 m in length, had a thickness of 0.002 m and was painted black to increase its ability to absorb heat [38]. A layer of transparent glass with a thickness of 0.005 m was used to cover the top part of the solar collector to allow heat accumulation. The glass had a gap of 0.600 m in width and 0.070 m in height to allow air flow through. In order to prevent heat loss of the solar collector, the bottom and side surfaces were insulated using plywood sheets with a thickness of 0.020 m and fibreglass insulation with a thickness of 0.020 m, as shown in Fig. 1. As shown in Fig. 2, a SWM SUS304 with a constant porosity (X) of 0.747 and a transverse pitch with a duct height ratio (P/h) of 1.14 and serrated angle (α) of 60° [33] was placed inside the air flow channel to enhance the heat transfer between the absorber plate and the flowing air. The solar collector was connected to the bottom of the drying chamber and a blower was used to blow air into the solar collector and subsequently into the drying chamber, as shown in Fig. 3.
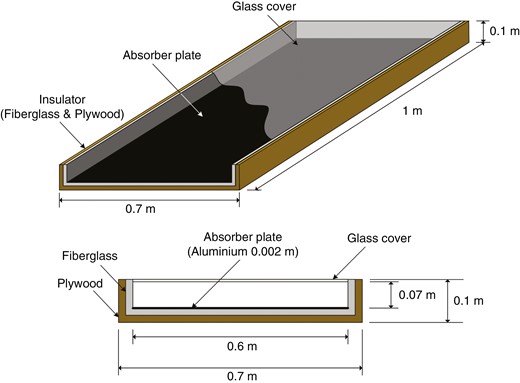
Solar collector dimensions and components
![(a) Arrangement of stainless wire mesh porous material in solar collector; (b) the porosity of stainless wire mesh (X) [32]](https://oup.silverchair-cdn.com/oup/backfile/Content_public/Journal/ce/7/6/10.1093_ce_zkad058/1/m_zkad058_fig2.jpeg?Expires=1747857757&Signature=5FzpznjoAMYVgTsufHLL0Tci1xzDj1A3kHFZsRMXxr5YxQqDeotylHrPOsZ3I7p8z3c2onB~IB7rd3-PU7kM2Cci161hw8pcAoYmydksaJe79jhTPtZ-QxEJucrs~ZfPJM1vD9Fjo~C2nCfKdi3-~rm1uzAXgIhUnsU7~vAdYMtnRJYIi0NsMuqR8ddYAtEKRiIlcaLYi4leEb7YQ4~dLdVCjL-iXVnKu9CCOuetJzuleuzJ47jcenHJlXvgtXBjjo7dyGu7YPmDymLJlKqk-pgjhpG5uf3iOVhaFvRFutBLKZ1J6D1pC16RbEXQLHOT63T0SESw04XGBKNm1KKBHg__&Key-Pair-Id=APKAIE5G5CRDK6RD3PGA)
(a) Arrangement of stainless wire mesh porous material in solar collector; (b) the porosity of stainless wire mesh (X) [32]
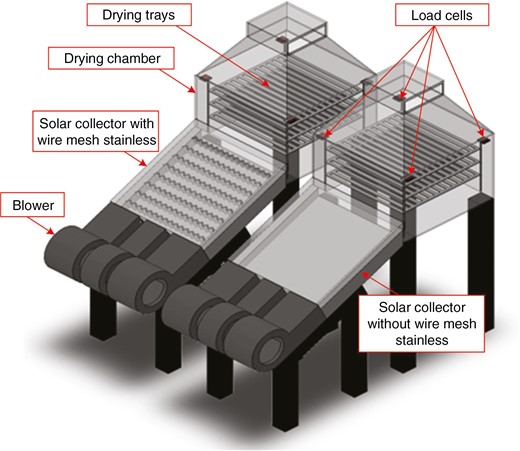
MMFCSD components (‘stainless wire mesh’ in legends)
1.1.2 Drying chamber
The drying chamber of the MMFCSD (shown in Fig. 3) received direct solar radiation that penetrated its transparent walls, which were made of acrylic sheets measuring 0.005 m thick, 0.700 m wide, 0.700 m long and 0.700 m high on all sides. Inside the drying chamber was a drying tray consisting of three layers of food-grade stainless steel sieves on which the drying samples were placed. The drying trays were suspended on four load cells to monitor the mass of the samples during the drying process. At the top of the drying chamber was a chimney measuring 0.150 m in width, 0.150 m in length and 0.050 m in height for air and moisture ventilation. A blower was installed on the solar collector to blow out the moisture from the drying chamber.
1.2 Measuring instruments
In the experiment, two dryers of the same size were used. Simultaneous experiments were performed under the desired conditions. Therefore, the measuring and installation positions for the instruments in both dryers were the same. Type-K thermocouples with a diameter of 2 mm were used to measure the inlet and outlet air temperatures of the solar collector at three positions on each side (Tinlet × 3 and Toutlet × 3), the surrounding air temperature at one position (Tambient), the air temperature for the drying chamber at three positions (Td_1, Td_2 and Td_3) and the air outlet temperature of the drying chamber at one position (Toutlet). The thermocouples were calibrated using the Grant water bath method (Grant Instruments, Cambridge, UK) with an accuracy of ±0.2°C (5–90°C). A Testo416 hot wire anemometer with an accuracy of ±0.1 m/s was used to measure the velocity of the surrounding air, and of the air flow in the solar collector and the drying chamber to calculate the air mass flow rate. A CMP 3 pyranometer with a wavelength range of 300–2800 nm and an accuracy of ±15 W/m2 was used to measure the solar intensity during the experimental day. Load cells were used to weigh the drying sample, with each load cell connected to a signal cable (load cell × 4) to send the data to the junction box unit. The load cell signal was calibrated by the actual load with an accuracy of ±0.1 g (5–90°C). A Fluke 325 digital clamp meter with an accuracy of ±5 A was used to measure the blower current during the experiment. A hygrometer (Electronik, model EE23) with an accuracy of ±2% was used to measure the relative humidity of the surrounding air. The cables for the pyranometer, thermocouples and load cell junction box were connected to a Graphtec GL820 data logger to collect the data for further analysis. The positions of the measuring instruments are shown in Fig. 4.
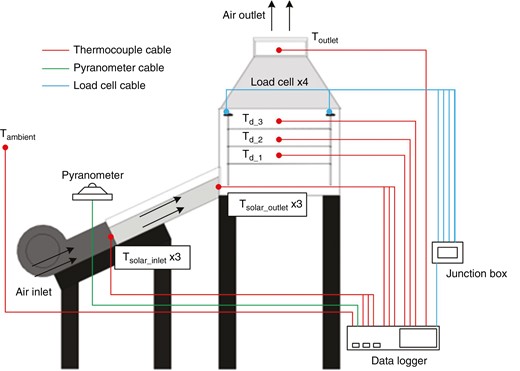
Schematic diagram and measuring positions
Various factors may interfere with testing and data collection, potentially causing the experimental results to differ from the measured values. Measurement uncertainty (y) is the defined measurement error that can be estimated and calculated using specific measured quantities, as shown in Equation (1) [33, 39]:
where δx1, δx2, δx3, …, δxn are the measurement errors of x1, x2, x3, …, xn; δy is the absolute uncertainty, while δy/y is the relative uncertainty. The uncertainties of the instrument and necessary parameters are shown in Tables 2 and 3, respectively.
Measurement uncertainty of instruments
| Measurement | Uncertainty |
|---|---|
| Temperature | ±0.2°C |
| Air velocity | ±0.1 m/s |
| Solar intensity | ±15 W/m2 |
| Mass | ±0.1 g |
| AC current | ±5 A |
| Width | ±0.001 m |
| Length | ±0.001 m |
| Measurement | Uncertainty |
|---|---|
| Temperature | ±0.2°C |
| Air velocity | ±0.1 m/s |
| Solar intensity | ±15 W/m2 |
| Mass | ±0.1 g |
| AC current | ±5 A |
| Width | ±0.001 m |
| Length | ±0.001 m |
Uncertainty of parameters
| Parameters | Maximum uncertainty (%) |
|---|---|
| Dry basis moisture content (Md) | 0.089 |
| Moisture ratio (MR) | 0.126 |
| Thermal efficiency of solar collector (ƞsolar) | 5.481 |
| Drying efficiency (ƞdrying) | 5.680 |
| Parameters | Maximum uncertainty (%) |
|---|---|
| Dry basis moisture content (Md) | 0.089 |
| Moisture ratio (MR) | 0.126 |
| Thermal efficiency of solar collector (ƞsolar) | 5.481 |
| Drying efficiency (ƞdrying) | 5.680 |
1.3 Experimental method
The experiment was conducted at the Department of Mechanical Engineering, Faculty of Engineering and Architecture, Rajamangala University of Technology, Nakhon Ratchasima, Thailand (14° 57' 24'' N/102° 5' 22'' E) from 8.00 a.m. to 5.00 p.m. on 10, 11 and 12 November 2022. Two MMFCSD dryers of the same size were used and simultaneous experiments were conducted under the desired conditions. The two dryers—one with and one without SWM on the absorber plate of the solar collector—are shown in Fig. 5. The solar collectors of both dryers were positioned facing south at an angle of 15° to the horizontal to maximize the amount of incident sunlight on the absorber plate, as suggested by Dhimish and Silvestre [40]. Peeled whole bananas of similar size and origin in Nakhon Ratchasima province were chosen as the samples to evaluate the drying performance. The M0 (initial moisture content) of the bananas was determined using the Association of Official Analytical Chemists method prior to the experiment. It was found that the bananas used in the experiment had an M0 of ~4.95–5.00% dry basis (d.b.). In the experiment, the peeled bananas were dried under actual conditions of use, with a total mass of 1000 g for each dryer and average diameter of 2.88 cm. The air flow into the solar collector was controlled by a blower with a constant mass flow rate () of 0.0237 kg/s (Reynold number, Re = 3700) [33]. During the experiment, the mass of the bananas, the temperatures of each position and the solar intensity were recorded into the data logger every 10 min, while the relative humidity and velocity of the surrounding air were manually recorded every 1 h. The experimental conditions are presented in Table 4. The drying process was continued until a constant mass of the banana samples was achieved, at which point the experiment was halted. In cases in which the experiment was conducted in a single day and had to be stopped due to time constraints (5 p.m.) despite the banana samples still decreasing in mass, the samples were placed in opaque plastic bags, air was vacuumed out of the bags and they were sealed tightly to prevent moisture absorption or loss. They were then stored in an opaque container with a tight lid to be used for testing the following day [9, 41].
Experimental conditions
| Parameter | Value/detail | Reference |
|---|---|---|
| Drying process | ||
| Drying sample | Banana | – |
| Initial mass of sample | 1000 g | – |
| Initial moisture content of sample (M0) | 4.95–5.00% dry basis | – |
| Air mass flow rate (m˙) | 0.0237 kg/s (Re = 3700) | [33] |
| Experimental time | 8.00 a.m. to 5.00 p.m. | – |
| Data recording time interval (data logger) | 10 min | – |
| Data recording time interval (manually) | 1 h | – |
| Solar collector | ||
| Porosity of stainless wire mesh | 0.747 | [33] |
| Transverse pitch with duct height ratio (P/h) | 1.14 | [33] |
| Serrated angle of stainless wire mesh (α) | 60° | [33] |
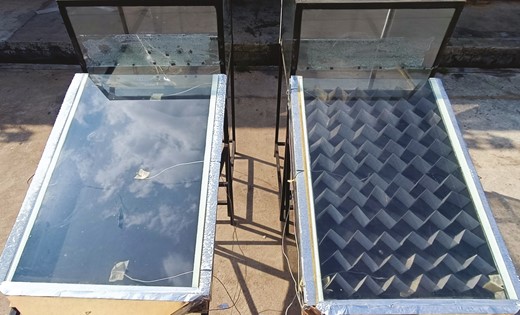
MMFCSD with and without SWM
2 Data analysis
2.1 Drying kinetics
In the drying process, hot air flows through the drying sample and, simultaneously, heat and mass transfer occur. Most of the heat is used to evaporate the water, thus changing the mass of the drying samples over time. Drying kinetics, consisting of dry basis moisture content (Md) moisture ratio (MR) and effective moisture diffusivity (Deff) values that can be calculated from Equations (2), (3) [9] and (4) [42] were used to explain this phenomenon:
The analytical solution of Deff was attributed to Dak and Pareek [42]. In the case of infinite cylindrical, MR, the natural logarithm of MR (lnMR) and the drying time (t) were linearly fitted and the slope method was used to calculate Deff. It is assumed that the Me is negligible compared with the M0 and the Md. In addition, it can be considered that mass transfer occurs over the drying period until the moisture content in the drying sample is completely removed. Therefore, there is no need to consider the Me [9]. Thus, Equation (3) can be rewritten as Equation (5):
2.2 Thermal efficiency of solar collector
The thermal efficiency of the solar collector is the ratio between the heat energy produced by the collector and the heat energy received from solar radiation, which can be calculated by using Equation (6) [40, 43]:
2.3 Drying efficiency
The drying efficiency is the ratio of the energy used to evaporate the water and the total energy used in the drying process, which can be calculated by using Equations (7) and (8) [44, 45]. The physical properties of air can be calculated from the equations shown in Table 5.
3 Results and discussion
This study was a comparative experiment of an MMFCSD dryer, with and without an SWM on the absorber plate. The experiment was conducted simultaneously under the same experimental conditions on 10, 11 and 12 November 2022 from 8.00 a.m. to 5.00 p.m. The experiment results showed that the solar intensity of each day increased from 8.00 a.m. to 12.40 p.m. and then gradually decreased until 5.00 p.m. This solar intensity ranged between 279.41–815.09, 259.87–770.44 and 262.87–828.60 W/m2 and the ambient temperature (Tamb) ranged between 30.54–37.45, 30.12–37.50 and 31.00–37.66°C on 10, 11 and 12 November 2022, respectively. As shown in Fig. 6, the Tamb trended in the same direction as the solar intensity, as did the temperature of each position of the MMFCSD measured by the thermocouples. The relative humidity and velocity of the surrounding air are shown in Figs 7 and 8, respectively.

Solar radiation and ambient air temperature (Tamb) during test
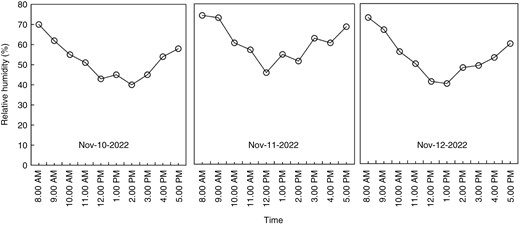
Relative humidity of ambient air
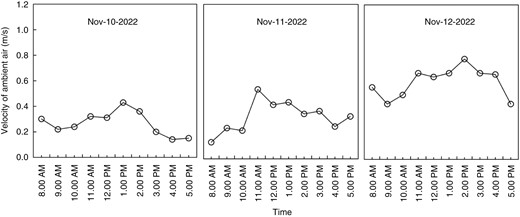
Velocity of ambient air
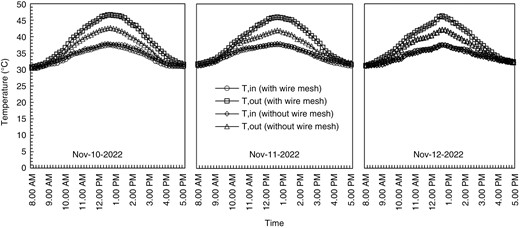
Fig. 9 shows the inlet and outlet air temperatures of the solar collector of the MMFCSD with and without an SWM. It was found that the temperature of the air flowing from both dryers increased with an increase in the amount of solar intensity until 12.40 p.m., after which it gradually decreased until 5.00 p.m. When the air temperatures at the outlets of the two solar collectors were compared, it was found that the MMFCSD with an SWM could produce hot air with a maximum temperature of 46.60°C, 46.00°C and 46.22°C on 10, 11 and 12 November 2022, respectively. This was higher than the MMFCSD without an SWM, which could produce hot air with a maximum temperature of 37.55°C, 37.97°C and 37.42°C, respectively. This difference was due to the swirling flow of the air passing through the pores of the SWM, which interfered with the thermal boundary layer on the absorber plate, causing the air flowing in the core to mix well with the air on the surface of the absorber plate. Therefore, the convective heat transfer coefficient was increased and the heat transfer between the air and the absorber plate was increased [25–33]. In addition, the SWM has a high ratio of heat transfer area to volume and high effective thermal conductivity, resulting in good heat absorption and radiation [9, 34–36, 46]. This resulted in the temperature of the air flowing out from the solar collector being higher in the MMFCSD with the SWM. When considering the thermal efficiency of the solar collector (ηsolar), it was found that ƞsolar trended with the amount of solar intensity and the air temperature at the outlet of solar collector. The ƞsolar of the MMFCSD with the SWM was higher than that of the MMFCSD without the SWM due to the changes in the air flow pattern when flowing through the SWM. This allowed the air flowing through the solar collector to transfer more heat to the absorber plate. As a result, the difference in the inlet and outlet temperatures was increased. In this study, the highest ƞsolar values were 0.43 and 0.25 and the average ƞsolar values were 0.26 ± 0.02 and 0.14 ± 0.01 for the MMFCSD with and without an SWM, respectively, as shown in Fig. 10. The difference of the average ƞsolar of the MMFCSD with and without an SWM were evaluated using the analysis of variance (ANOVA) test. The results indicated that the differences in the average ƞsolar values were considered statistically significant, with a P-value of <0.05, as shown in Table 6.
A summary of experimental results
| Day | Esolar (kJ) | Eblower (kJ) | Eevap (kJ) | Drying time (h) | ƞsolar (–) | ƞdrying (–) |
|---|---|---|---|---|---|---|
| MMFCSD with SWM | ||||||
| 10 November 2022 | 10 550.900 | 6480.000 | 1231.200 | 9.000 | 0.26 ± 0.02a | 0.072 ± 0.004c |
| 11 November 2022 | 9923.550 | 6480.000 | 624.980 | 9.000 | 0.26 ± 0.02a | 0.038 ± 0.004d |
| 12 November 2022 | 3721.660 | 2520.000 | 44.670 | 4.330 | 0.26 ± 0.02a | 0.007 ± 0.001e |
| Overall | 24 196.120 | 15 480.000 | 1900.850 | 21.330 | 0.26 ± 0.02a | 0.048 ± 0.004f |
| MMFCSD without SWM | ||||||
| 10 November 2022 | 10 550.900 | 5994.000 | 949.630 | 9.000 | 0.14 ± 0.01b | 0.057 ± 0.003g |
| 11 November 2022 | 9923.550 | 5994.000 | 651.410 | 9.000 | 0.13 ± 0.01b | 0.041 ± 0.002h |
| 12 November 2022 | 10 401.170 | 5883.000 | 314.000 | 8.830 | 0.14 ± 0.01b | 0.019 ± 0.001i |
| Overall | 30 875.620 | 17 871.820 | 1915.040 | 26.830 | 0.14 ± 0.01b | 0.039 ± 0.003j |
Different letters (superscripts) in each column show statistically significant differences between MMFCSD with and without SWM with P < 0.05, while identical letters show no statistically significant differences with P > 0.05. Data were analysed using multivariate ANOVA tests.
Temperature of air inlet and outlet of the solar collector
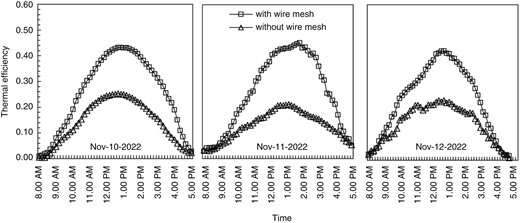
Thermal efficiency of the solar collector
When the air temperature in the drying chamber (Td) was considered, it was found that the Td of both dryers increased with an increase in the amount of solar intensity until 12.40 p.m., when the highest amount of solar intensity occurred. After that, it gradually decreased—as did the temperature of each different position, as shown in Fig. 11. However, the drying chamber still had a higher temperature than the outside air due to heat accumulation from the solar collector and the influence of the greenhouse effect inside the drying chamber. For this reason, the Td at 5.00 p.m. was higher than Tamb, although the solar intensity was lower than at 8.00 a.m. This result is consistent with the research of Ekka et al. [22], Jain et al. [23], Badaoui et al. [47], Chaatouf et al. [48] and Alomar et al. [49], who found that due to heat accumulation during the day, the temperatures in the drying chambers of their solar dryers were higher than the ambient temperature even though the solar intensity was low. When the Td of each dryer was compared, it was found that the MMFCSD with the SWM had a higher temperature than the MMFCSD without the SWM, with the highest Td of 63.60°C, 62.53°C and 62.06°C and 55.33°C, 53.76°C and 54.03°C on 10, 11 and 12 November, respectively. This may have been because, before the air in the MMFCSD with the SWM flowed into the drying chamber, it was pre-heated due to the influence of a swirling airflow pattern when passing through the SWM. This allowed more air to transfer heat to the absorber plate. As a result, the air flowing through the solar collector had higher energy. Furthermore, when the air flowed into the drying chamber with transparent walls on each side, it received energy from direct solar radiation, including heat accumulating in the drying chamber from greenhouse conditions. This resulted in heat radiation with wavelengths in the infrared range that could not penetrate the drying chamber [31, 50, 51], causing the air temperature in the drying chamber to increase due to the influence of the heat transfer enhancement of both convection and radiation. This study also found that installing an SWM on the absorber plate of the solar collector resulted in a higher drying chamber temperature than in previous related studies, as shown in Table 7. The temperature in the drying chamber is considered one of the most important parameters for the drying process [5]. When compared with the dryers in the studies of Pruengam et al. [21] and Lamrani et al. [52], who conducted experiments under higher solar intensity and with larger absorber plates, it was found that the MMFCSD with the SWM in this study had a higher temperature inside the drying chamber. The dryers from the studies of Pruengam et al. [21], Lamrani et al. [52] and this study (with absorber plate sizes of 7.00, 1.50 and 0.70 m2) could produce heat in the drying chamber with maximum temperatures of 62.70°C, 62.00°C and 63.60°C under maximum solar intensities of 1100.00, 1000.00 and 815.09 W/m2, respectively.
A comparison of air temperature in drying chamber
| Dryer type | Solar radiation (W/m2) | Tamb (°C) | Tdry (°C) | Reference |
|---|---|---|---|---|
| 10 November 2022 | Present study | |||
| MMFCSD with SWM | 279.41–815.09 | 30.54–37.45 | 32.91–63.60 | |
| MMFCSD without SWM | 32.49–55.33 | |||
| 11 November 2022 | ||||
| MMFCSD with SWM | 259.87–770.44 | 30.12–37.50 | 33.22–62.53 | |
| MMFCSD without SWM | 32.49–53.76 | |||
| 12 November 2022 | ||||
| MMFCSD with SWM | 262.87–828.60 | 31.00–37.66 | 33.80–62.06 | |
| MMFCSD without SWM | 33.01–54.03 | |||
| Mixed-mode | 200.00–1100.00 | 30.00–40.00 | 31.00–62.70 | [21] |
| Mixed-mode | 225.00–425.00 | 31.00–35.00 | 28.00–53.00 | [23] |
| Mixed-mode | 100.00–1000.00 | 26.90–29.60 | 34.00–62.00 | [52] |
| Mixed-mode | 0.00–1100.00 | 26.00–40.00 | 27.00–52.00 | [53] |
| Mixed-mode | 588.00–922.00 | 24.00–26.00 | 30.00–50.00 | [54] |
| Mixed-mode | 50.00–839.00 | 21.00–28.90 | 33.00–49.80 | [55] |
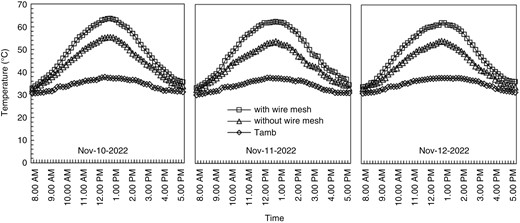
Temperature of air in the drying chamber
The evaluation of the drying efficiency (ƞdrying) found that the Md decreased as the drying time increased. The Md decreased rapidly between 11.00 a.m. and 2.00 p.m. since the amount of solar intensity directly affected the temperature in the drying chamber. When the temperature in the drying chamber was high, the water in the drying sample could evaporate easily [9]. During that period, the amount of solar intensity was 720.12–661.40 W/m2 and the drying chamber temperature was 55.56–57.00°C and 47.86–47.27°C for the MMFCSD with and without an SWM, respectively. However, the drying process could not achieve the required moisture content (unchanged mass) in 1 day. This resulted in 3 days of continuous testing until the mass of the drying sample remained unchanged (i.e. that no more moisture content evaporated from the drying sample). The trend for decreasing moisture content observed in this study was consistent with the studies of Maia et al. [41], Nabnean and Nimnuan [14] and Pruengam et al. [21], who took 139, 36 and 24 h, respectively, to dry bananas. A comparison of the drying times with previous studies is shown in Table 8. When the two dryers used in this study were compared, it was found that the MMFCSD with the SWM took 21 h and 10 min and an overall ƞdrying of 0.048 ± 0.004% over the drying process, while the MMFCSD without an SWM took 26 h and 40 min and had a an overall ƞdrying of 0.039 ± 0.003%, as shown in Fig. 12 and Table 6. The ANOVA test was used to evaluate and compare the ƞdrying of the MMFCSD with and without an SWM. The results indicated that the differences in the ƞdrying values were considered statistically significant, with a P-value of <0.05. The results demonstrated that installing the SWM on the absorber plate reduced drying time by 5 h and 30 min and increased ƞdrying by 23.07%. This is because the air temperature inside the drying chamber directly affected the rate of moisture content reduction, leading to faster evaporation of the moisture content of the drying samples in the MMFCSD with the SWM. At the same time, when the drying time was shorter, the energy consumption of the blower (Eblower) and the energy usage from the solar collector (Esolar) were reduced. Although the installation of the SWM caused pressure loss due to obstruction of the air flow in the first 2 days, resulting in high consumption of blower power, when all 3 days of drying were considered, the MMFCSD without the SWM had higher Eblower and Esolar values. When the decrease in the daily moisture content was considered, it was found that on the first day of drying, the MMFCSD with the SWM removed a greater amount of moisture from the drying samples than the MMFCSD without the SWM because of the different drying chamber temperatures. As a result, the amount of moisture that evaporated each day was not equal. The energy used to remove moisture from the drying sample was proportional to the moisture loss [59–61] and the rate of moisture content reduction was proportional to the moisture content in the drying sample at any time [9]. The Md in the drying sample on the first day of the drying process decreased from the M0 of 5.00% d.b. to 1.88% d.b. and 2.61% d.b. for the MMFCSD with and without the SWM, respectively. As a result, the energy used to evaporate the water from the drying sample (Eevap) of the MMFCSD with the SWM was high, resulting in higher ƞdrying; but, on the second day of the drying process, the ƞdrying of the MMFCSD without the SWM was higher since the Md of the drying samples remaining from the first day was higher. Therefore, more water evaporated, resulting in a high Eevap value. The same results were observed on the third day of drying. The energy consumption and drying efficiency are shown in Table 7.
A comparison of banana drying with previous studies
A comparison of banana drying with previous studies
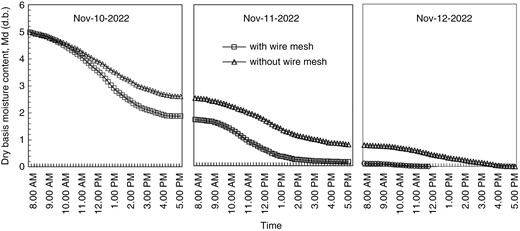
Moisture content (d.b.) of the drying sample
The slope method [42] was used to show the relationship between lnMR–t throughout the 3 days of the experiment, as shown in Fig. 13. Linear regression analysis gives Deff of 1.19 × 10⁻⁶ m2/s (R2 = 0.92) and 7.28 × 10⁻⁷ m2/s (R2 = 0.87) for the MMFCSD with and without an SWM, respectively. It was found that the Deff of bananas using the MMFCSD with the SWM was higher than without the SWM because the Deff was significantly affected by the drying temperature. The Deff increased with the drying temperature increasing, leading to water molecular activation, and the diffusion of the water inside the bananas increased [9].
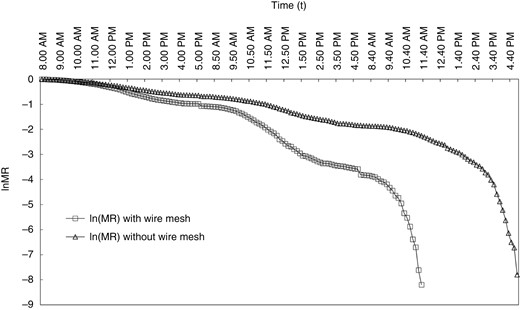
The relationship between lnMR–t
4 Conclusions
The purpose of this study was to compare the effects of installing an SWM on the solar collector of a MMFCSD. The experiments were conducted under actual conditions of use, with two dryers of the same size tested simultaneously. The experimental results revealed that the air outlet temperature and thermal efficiency of the solar collector (ƞsolar) of the MMFCSD with the SWM were higher than of the dryer without an SWM, with a maximum temperature of 46.22°C and 37.97°C, maximum ƞsolar of 0.43 and 0.25, and average ƞsolar of 0.26 ± 0.02 and 0.14 ± 0.01, respectively. This was because the air was disturbed and became a swirling flow as it passed through the pores of the SWM, resulting in better heat transfer. When the air temperature in the drying chamber (Td) was considered, it was found that the Td of the MMFCSD with the SWM was higher than that of the MMFCSD without the SWM, with maximum temperatures of 63.60°C and 54.03°C, respectively. This was because the drying chamber of the MMFCSD with the SWM was affected by the heat transfer enhancement of both convention and radiation. To evaluate the drying efficiency (ƞdrying), bananas were used as drying samples. The results showed that the MMFCSD with the SWM had a faster drying time and higher ƞdrying compared with the MMFCSD without the SWM, with a drying time of 21 h and 10 min and overall ƞdrying of 0.048 ± 0.004, and 26 h and 40 min and overall ƞdrying of 0.039 ± 0.003%, respectively. The results demonstrated that installation of an SWM on the absorber plate was able to shorten the drying time by 5 h and 30 min and increase ƞdrying by 23.07%. The Deff of the bananas by using the MMFCSD with the SWM (1.19 × 10⁻⁶ m2/s) was higher than without the SWM (7.28 × 10⁻⁷ m2/s). The results of this study will be useful for increasing the efficiency of solar drying for both commercial and household purposes. However, the quality of the dried samples and their economic value need to be studied further.
Nomenclature
- Ac
Absorber plate area (m2)
- cp
Specific heat capacities of air (kJ/kg°C)
- Deff
Effective moisture diffusivity (m2/s)
- d
Dry mass of drying sample (kg)
- Eblower
Energy consumption of blower (kW)
- Eevap
Energy of water vaporization (kJ)
- Esolar
Heat received by solar collector (kW)
- hfg
Enthalpy of water vaporization (kJ/kg)
- Isolar
Flux of irradiation (kW/m2)
- I
AC current (A)
- M0
Initial moisture content (kgwater/kgdry,sample)
- Md
Dry basis moisture content (kgwater/kgdry,sample)
- Me
Equilibrium moisture content (kgwater/kgdry,sample)
- MR
Moisture ratio (–)
Mass flow rate of air (kg/s)
- n
Bessel function order (–)
- mw
Mass of water vaporization of drying sample (kg)
Useful heat (kW)
- Td
Temperature of air in drying chamber (°C)
- Ti
Air inlet temperature of solar collector (°C)
- To
Air outlet temperature of solar collector (°C)
- r
Radius of banana (m)
- t
Drying time (s)
- V
Voltage (V)
- w
Wet mass of drying sample (kg)
- ηsolar
Thermal efficiency of solar collector (–)
- ηdrying
Drying efficiency (–)
- λ
Roots of Bessel function (–)
Acknowledgements
This research project is supported by the Science Research and Innovation Fund (contract no. FF66-P1-134). We would like to thank the Development in Technology of Porous Material Research Laboratory (DiTo-Lab), Department of Mechanical Engineering, Faculty of Engineering and Technology, Rajamangala University of Technology Isan for support and permission to use the place for the research and also thank Mr Bancha Chapakdee and Mr Sila Boonsitoum, an undergraduate student of the Department of Mechanical Engineering, for collection of experimental results.
Author contributions
Siwakorn Srithanyakorn: Conceptualization, Investigation; Sungwan Bunchan: Design, Methodology; Bundit Krittacom: Supervision; Ratinun Luampon: Validation and Analysis, Writing-Reviewing and Editing.
Conflict of interest statement
None declared.
Data Availability
The data underlying this article will be shared on reasonable request to the corresponding author.
