


Abstract
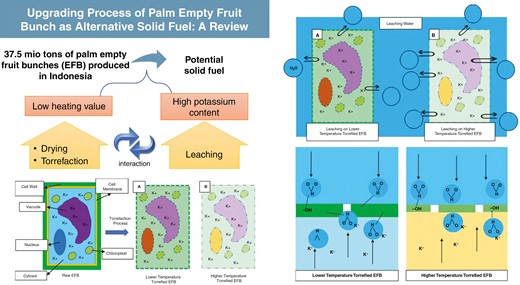
A total of 37.5 million tons of palm empty fruit bunches (EFBs) produced in Indonesia in 2018 have the potential to be used as an alternative eco-friendly solid fuel. However, a pretreatment process is necessary to increase the heating value and reduce the potassium content of EFBs. Several methods can be employed to improve the characteristics of EFBs as a solid fuel, such as drying and torrefaction to increase the heating value and the leaching process for reducing the potassium content of EFBs. The main concept of increasing the heating value is to increase the fuel content, which is carbon. Through drying, the carbon ratio can be increased by reducing the moisture content and, through torrefaction, the carbon ratio could be increased due to the decomposition of lignocellulose. A simple way to reduce the potassium content of EFBs is the leaching process. Two types of leaching treatment have been studied before: soaking and stirring treatment. This study reviews those methods to make EFBs more suitable as a solid fuel with a high heating value and less potassium content. Increasing the carbon content in EFBs is crucial for enhancing their heating value as a fuel. Drying and torrefaction decrease the moisture content and modify the chemical structure, resulting in higher carbon ratios. The leaching process effectively reduces the potassium content of EFBs and stirring treatment is more effective than immersion treatment. Torrefaction positively affects leaching by decreasing the potassium content, while hydrophobicity may hinder leaching by repelling water. The high moisture content of leached EFBs requires additional energy for evaporation during torrefaction, resulting in a lower energy density yield compared with raw EFBs. Adjustments may also be required to account for the decreased mineral content, which functions as a torrefaction catalyst in EFBs that have not been leached.
Introduction
The need to find new and renewable energy sources is increasing along with energy consumption. In addition to having limited resources, fossil energy sources have many environmental problems. Biomass as a renewable energy source is an appropriate substitute for current energy sources. Palm is widely grown in Southeast Asia, mainly for palm oil production. Indonesia is the world’s largest producer of crude palm oil, producing a staggering 42.8 million tonnes in 2018 [1]. The use of crude palm oil (CPO) is diverse, ranging from raw materials to processing cooking oil and cosmetics to liquid fuel. Indonesia has started to utilize CPO as a liquid fuel mixture known as B30, which uses 30% processed CPO in the fuel mixture [2].
During the CPO production process, three types of solid waste are produced: palm press fibres (PPFs), palm kernel shells (PKSs) and palm empty fruit bunches (EFBs) [3]. PPFs are the residue obtained after the oil extraction from the palm fruit and consist of fibrous material, including mesocarp fibres and residual oil. The PKS is the hard outer shell of the oil palm fruit seed—a by-product of the palm kernel oil extraction process. EFBs are the fibrous outer layer of the oil palm fruit and the most significant solid waste component generated during CPO production. PPFs and PKS have been used directly as boiler fuels in palm oil mills. In terms of its availability and current utilization, EFBs have the potential to be used as a solid fuel. However, EFBs have a lower heating value than the other two solid wastes, namely PKSs and PPFs, and coal in Indonesia [4–7]. As stated previously, the potential of EFBs lies in the amount that is available. In 2018, Indonesia produced 37.5 million tons of EFBs [1, 3], equivalent to 1 GWe generated throughout the year if used as fuel for power plants. A promising increase in palm oil production, which reached >45 million tons in 2022 [8], will further ensure the availability of EFBs. Therefore, EFBs have the potential to be used as fuel in accordance with their availability and current lack of utilization.
Several research studies have been reported on the use of EFBs for solid fuel in many countries. The use of EFBs as fuel was reported in a 4.35-MW steam power plant, which consumed 840 kg/h of EFBs to generate electricity [9]. A significant decrease in power generated was reported due to the lower heating value of EFBs. On the other hand, a significant reduction in economic cost can be achieved by using EFBs as solid fuel as they are the side products of oil palm industries. Many scientists have extensively studied and reported various methods for using palm oil waste (POW) and EFBs in the literature [10–14]. The techniques used most frequently for EFBs include torrefaction, pyrolysis, hydrothermal carbonization, liquefaction, gasification and combustion. Some studies have also investigated the use of EFBs through biochemical methods. The results have shown that thermochemical conversion of EFBs through low-temperature processes such as torrefaction, pyrolysis, hydrothermal carbonization and liquefaction typically leads to low yield and low efficiency.
However, as a biomass, EFBs have the disadvantage of having a very high moisture content of ≤60 wt% [15, 16], which can reduce combustion efficiency. In addition, the most important thing is the discovery of a high mineral content in EFBs. The dominant mineral in the EFB is potassium, which was 48.94 wt% of the ash in raw EFBs (on an oxide basis) in one study [4]. High potassium content in EFBs means they can be used as fertilizer [17]. However, as a fuel, the high mineral content is not needed because it could lead to problems such as slagging and fouling when the combustion process is carried out inside the furnace. Slagging and fouling formation can reduce the total energy conversion performance. Therefore, the mineral content of the fuel must be reduced or even eliminated [4, 18]. This study mainly discusses studies and research to improve the quality of EFBs as an alternative solid fuel equivalent to coal. The quality improvement will be evaluated from two aspects: heating value and mineral content, in this case, potassium.
1 EFB conversion into solid fuel
Oil palm empty fruit bunches (OPEFBs) are the most significant waste generated by palm oil mills. For every 1 kg of CPO produced, 1 kg of OPEFBs is also produced as a solid waste residue. OPEFBs are bulky, brown and heterogeneous residues that are produced after sterilization and stripping of oil palm fruit bunches during CPO production. In their raw form, OPEFBs are characterized by high moisture, ash and mineral matter contents, low heating value and low bulk density. Due to these properties, OPEFBs are considered a low-value feedstock material and boiler fuel that is used as organic manure or a composting or mulching material in oil palm plantations [19]. The low conversion efficiencies of these strategies have led to an accumulation of large stockpiles of EFBs, which increases the costs of processing, disposal and waste management. The poor properties of EFBs have hindered their sustainable valorization into clean energy and value-added products. Some studies also reported the mixing of EFBs or utilizing other POW materials, such as pretreated palm oil mill effluent [20].
To improve the quality of EFBs as solid fuel, it is necessary to determine the targets that need to be improved. Through this study, we have reviewed the improvement in EFBs with respect to their use as an alternative fuel and as a replacement for coal utilization. This study establishes the target based on low-rank coal, which is used primarily in Indonesia (i.e. sub-bituminous-ranked coal based on ASTM D388). However, before we can compare EFBs with coal as a conventional solid fuel, we must determine which fuel characteristics must be compared.
1.2 EFB characteristics and properties
Palm is a plant deliberately cultivated for industrial purposes and utilized in various applications, such as cooking oil, cosmetics and even in energy products. From palm plantations, fresh fruit bunches are harvested, then the palm fruits are knocked out, leaving EFBs as solid waste. Fig. 1 shows palm oil processing to obtain two main products, namely CPO and palm kernel oil, as well as by-products such as waste.
![Composition of palm products and wastes [3]](https://oup.silverchair-cdn.com/oup/backfile/Content_public/Journal/ce/7/6/10.1093_ce_zkad059/2/m_zkad059_fig1.jpeg?Expires=1749762622&Signature=AcR4Apw~pKKlJHmerLlszfd5ga934s5P~f11ZX2XpDJN8pzMev-sL-6wLfDQ5JU2xsMsJDyi63JQNKj5LqO1szLiSk2cj9rISOiRmmrfiAv7AI4SGF3A~aqbgDrRqdktVp155ONuUthifBhx2moJUgL5fzA7C5-tpDnnfpY066EG1ljNVB4W-tNMDkXX4iqIZhjrSnhBD7aKoXuxddx8nSGUnD8l4Huu~pmlMkIA8IYYMkL2Dpgi-oDI47fbY~cp3tLocQwE6~kDzMerXdbjy6sUxVLTN2eQGIHa01vfy3aK4eTphcrkpZcVmAib-gp2ss-2vvUaAJi4HZi~SiIrpw__&Key-Pair-Id=APKAIE5G5CRDK6RD3PGA)
Composition of palm products and wastes [3]
One palm fresh fruit bunch can be processed to produce 21-wt% EFBs [3]. EFBs can be classified as lignocellulose biomass. The lignocellulose component of EFBs varies greatly, but the hemicellulose and cellulose components were found to be the dominant lignocellulose components in EFBs. Data on lignocellulose contents in EFBs from various sources are shown in Table 1.
Unlike coal, which is commonly characterized by proximate and ultimate analysis, biomass is composed of a variety of organic compounds such as cellulose, hemicellulose and lignin due to its origin in recently living plants and organic matter such as wood, crops and organic waste. In lignocellulosic biomass, hemicellulose generally constitutes 20–40% of the biomass, cellulose 40–60% and lignin 10–25% [28]. Therefore, the composition of those three compounds is essential to determine the characteristics of biomass.
The typical decomposition temperature of lignin, cellulose and hemicellulose in biomass is presented in Fig. 2. Lignin is a complex cross-linked polymer that is highly resistant to decomposition and it typically requires high temperatures and long residence times to decompose. Lignin decomposition typically begins at ~200–300°C and can be completed at temperatures of ~400–500°C. Cellulose is a linear polymer of glucose units that is more easily broken down than lignin. Cellulose typically decomposes at temperatures that are lower than those for lignin, at ~150–200°C. Hemicellulose is also a linear polymer but it is composed of various sugars, including xylose and mannose. Hemicellulose decomposes at temperatures that are lower than those for lignin, which are typically between 150°C and 250°C.
![Pyrolysis curves of hemicellulose, cellulose and lignin in thermogravimetric analysis. Reproduced from [29] with permission from Elsevier.](https://oup.silverchair-cdn.com/oup/backfile/Content_public/Journal/ce/7/6/10.1093_ce_zkad059/2/m_zkad059_fig2.jpeg?Expires=1749762622&Signature=en84aFZ6sCui0fYwOfuZ4kcTFEBwDtYkJys3~hUbp5WP1ieXG~hRk4baCP20F-SvgRGAU5w7~fx-~WmevjTdD-daJID0RoHOCMQqgdhBK0AZivVkkJTLjQs5ic7qSnrhT6hHG74e4~muLDPWU1vdkajHSaFETSz1yIEo6E75rE8SMcHJ5fszOpvoXJZ4MI7rNmGlQfr5AQV4eaAnubsKxxfgo3GSivm8N2A6Eh9zVdKWuAuOgRuDI4WeWSIbZOIsg6q1ifwfc73b4PKZA5mEM3XuAYzACvWBFHSF5qNXGMdy1He1u7xsEpY5NXKxiOesq7J9pupwsmGzUoa6OmvNfA__&Key-Pair-Id=APKAIE5G5CRDK6RD3PGA)
Pyrolysis curves of hemicellulose, cellulose and lignin in thermogravimetric analysis. Reproduced from [29] with permission from Elsevier.
Furthermore, the content of lignin, cellulose and hemicellulose plays a significant role in determining the energy content of biomass and how it can be used as a source of energy. Lignin generally has a high heating value, typically in the range of 23.26–25.58 MJ/kg, which contributes to the total energy content of biomass [30]. Lignin is generally considered a valuable component in biomass because of its high heating value compared with that of cellulose and hemicellulose. Compared with lignin, cellulose and hemicellulose have a lower heating value of ~18.60 MJ/kg [30].
1.3 Solid fuel characteristics
Solid fuel can be defined as any solid material that can produce energy through the combustion process [31, 32]. Compared with liquid and gas fuels, solid fuels have several advantages, including availability, ease of production, lower fuel costs and distribution convenience in various transportation modes. Because of these benefits, solid fuels are widely used in the industrial sector, such as power generation. Coal is a common solid fuel because it is relatively easy to produce and has a higher heating value than other solid fuels. Therefore, the discussion of solid fuel characteristics refers to coal characteristics.
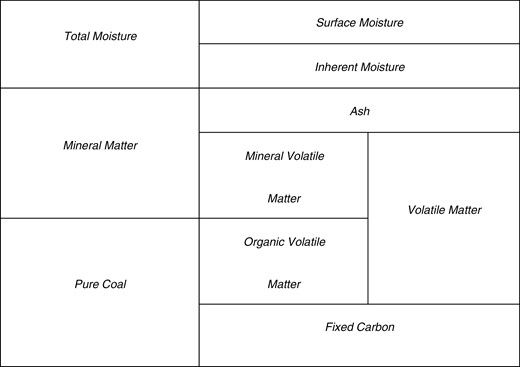
To compare solid fuels, we need to consider the chemical composition and physical structure of each solid fuel [33]. Solid fuels have various chemical compositions and physical structures, which can be determined through ultimate and proximate analyses. Proximate analysis is carried out to determine the physical components of solid fuels. The proximate analysis results consist of several parameters: fixed carbon content, volatile matter content, moisture content and ash content. Fixed carbon refers to the composition of solid carbon in solid fuels, which is also considered a fuel source because it provides the largest energy contribution when solid fuel is burned. Volatile matter refers to the composition of hydrocarbon compounds with long, short or aromatic chains. Volatile matter also contributes to the production of energy during the combustion process. There are two types of volatile matter, which are organic and mineral volatile matter. The total amount of volatile organic matter and fixed carbon is usually considered pure coal. The presence of volatile matter is also considered to be important in determining the ease with which solid fuel can be burned.
Another parameter of proximate analysis is the moisture content, which refers to the composition of water contained in solid fuel. Although the moisture content does not produce energy during the combustion process, it is crucial to understand that the moisture content evaporates by absorbing some of the energy produced during the combustion process, reducing the total energy that can be utilized. Another parameter that does not contribute to the energy produced during combustion is the ash content, which refers to the composition of inorganic compounds containing minerals inside solid fuels. The ash content is essential because a higher ash content in solid fuels could cause several problems, such as slagging and fouling inside the furnace.
Therefore, the physical components of solid fuel can be described using Fig. 3.
Physical components of solid fuel
Meanwhile, the ultimate analysis is carried out to determine the chemical elements that make up the solid fuel. ASTM D3172 is used as a standard for the ultimate analysis of coal. Carbon, hydrogen, oxygen, sulphur and nitrogen are the most commonly analysed chemical elements. These components can be used to describe the composition and heating value of solid fuel. In addition to the constituent components of solid fuels, the heating value is essential to understand. The heating value shows the amount of energy from a certain amount of solid fuel through the combustion process. There are two terms of heating value that are commonly used, namely the lower heating value (LHV) and the higher heating value (HHV). The difference between these two heating values is due to the presence of water. The LHV is obtained when water as a combustion product is in the vapour phase. Meanwhile, the HHV is calculated assuming that the water from the combustion products is in the liquid phase. The HHV will be higher than the LHV because it considers the latent heat released to condense the water. The heating value of solid fuel can be determined using a bomb calorimeter following ASTM D388 as its standard [34]. In addition, there are other characteristics that can describe biomass quality, especially for its utilization, such as grindability and hydrophobicity [35, 36].
1.4 Process of increasing heating value
Palm EFBs have a heating value far below the sub-bituminous C coal rank. Therefore, they cannot be used directly as an energy source in power plants. For this reason, EFBs need to be prepared in advance to aim for a HHV to be equivalent to coal. There are many possible methods to increase the energy density of biomass. This increase can be achieved by increasing the fuel content of the biomass feedstock. As previously stated, the fuel content is composed primarily of fixed carbon components and partially of volatile matter components. As a result, the heating value of any material increases as the fuel content increases.
The van Krevelen diagram depicts the carbon–oxygen–hydrogen ratio. It shows how much carbon is contained inside as fuel content. According to the van Krevelen diagram, biomass has a higher oxygen-to-carbon and hydrogen-to-carbon ratio than coal, which implies that coal has a much larger HHV than biomass [32].
The drying process is one of the processes that can increase the carbon ratio in biomass. By definition, drying refers to the process of removing moisture from a material, which is primarily caused by heat energy. The drying process can reduce the moisture content of the biomass, but only its surface moisture content. However, biomass contains a high percentage of water, ≤60 wt%. The hydrogen and oxygen content of the biomass decreases as the moisture content decreases. According to the van Krevelen diagram, this reduction increases the carbon ratio in the biomass and its heating value. However, the magnitude of the increase in the heating value through the drying process is minimal in terms of the amount of moisture that can be removed. The drying process has no other effect on the biomass. In fact, as a result of the hydrophilic nature of the biomass, there is still a possibility that the moisture will be reabsorbed.
Torrefaction is another treatment process that has been researched and proven to increase the heating value of biomass. Torrefaction is a type of pyrolysis, which is a thermochemical process that occurs under certain conditions, such as without oxygen, and for a set period of time. Through the pyrolysis process, thermal decomposition occurs in biomass and results in gaseous, liquid and solid products. The torrefaction process is a mild pyrolysis that occurs in temperatures ranging from 200°C to 300°C [37, 38, 39]. Many factors can influence the torrefaction process, including the temperature and how long the process takes [40, 41, 42]. The temperature of the torrefaction process is related to the thermal decomposition that occurs. If the process temperature increases, more variations and decompositions will occur. Meanwhile, the duration of the residence time has a significant effect on how long the process takes. Simply put, the longer the residence time, the more likely thermal decomposition will occur.
The torrefaction process is appropriate for lignocellulose-based biomass because lignocellulose is actively decomposed at the torrefaction temperature [43]. Furthermore, many types of lignocellulosic biomass have been shown to have high potential as alternative energy sources [44]. The decomposition of lignocellulose causes a change in the chemical structure of the biomass, resulting in a higher energy density generated by the torrefaction process. Torrefaction occurs at a lower temperature than other types of pyrolysis. This allows a slower heating rate to produce a more dominant solid product [32].
In general, torrefaction can be divided into three mechanisms: depolymerization, devolatilization and carbonization [37, 45]. First, biomass undergoes depolymerization, breaking down polymer chains into simpler and shorter bonds. The chemical composition of the biomass will change as a result of the depolymerization process. The simplification of chemical bonds can range from the formation of new bonds to the reduction of specific chemical components. The mechanism of reducing the chemical component in the form of volatile matter from biomass solids is known as devolatilization. Carbonization occurs when the carbon ratio of the biomass increases as a result of the simplification and reduction of certain substances caused by decomposition. It should be noted that before the decomposition mechanism begins, the surface moisture will be reduced at the start of the heating process. In addition to the release of moisture, there are no changes in the chemical composition in this temperature range. The inherent moisture in the biomass will then be reduced during further heating.
A reactive drying process begins at 150°C, causing the chemical composition of biomass to change. This happens because the lignocellulose components in biomass, namely lignin, hemicellulose and cellulose, begin to decompose. Lignin is a lignocellulose component that first undergoes decomposition. Lignin decomposition begins at a temperature of 180°C with a peak rate starting at ~360–400°C. At around the torrefaction temperature, lignin undergoes a dehydration reaction in the alkyl chain, reducing the H2O compounds. Furthermore, the carbon ratio in the biomass increases in the form of volatile matter such as HCHO, CO2 and CO [46].
Cellulose, which is one of the dominant lignocellulose components in EFBs, begins to decompose at 280°C. The peak rate of cellulose decomposition starts at ~300–340°C. Unlike lignin, in the range of torrefaction temperatures, cellulose only dehydrates and releases H2O [46]. The decomposition of another dominant component, hemicellulose, begins at low temperatures, similarly to lignin, but the decomposition rate increases at 200°C. Then, hemicellulose will experience its peak at 290°C and end at ~350°C. In the range of torrefaction temperatures, hemicellulose goes through various mechanisms, such as dehydration, depolymerization and fragmentation. These mechanisms produce volatile matter, such as H2O, CH3OH, CO3, formic acid, acetic acid, furfural, CO2 and CO [46].
Torrefaction has a destructive effect on cells and tissues starting at 200°C. Below this temperature, plant cells will experience deformation at ~150°C, indicating a change in the chemical structure. However, other contents, such as water, protein and fat, will begin to decompose at 100°C. Because it is highly related to thermal decomposition, the torrefaction process depends on temperature and residence time as parameters [37].
Palm EFBs are biomass with a high lignocellulose content. According to Ninduangdee et al. [27], it is known that in the range of torrefaction temperatures, which is 250–330°C, EFBs are actively undergoing thermal decomposition. The reduction in the mass of the EFBs can reach 50% of the initial mass after experiencing torrefaction at 330°C.
1.5 Process of reducing ash contents
Based on Novianti et al. [4], the potassium content (on an oxide basis) in EFBs was 48.94 wt% of the remaining combustion ash, making potassium the dominant mineral found in EFBs. The presence of minerals in the ash is significant to be reduced or even removed because it can increase the potential for scale to form inside the furnace [47]. Potassium has a melting point of ~63.5°C and an evaporation point of 759°C. The wide difference between the melting point and the evaporation point allows the scale to form. The presence of scale inside the furnace can interfere with the heat transfer process during combustion.
The potassium content can be reduced through the leaching process. This process is simple because potassium can easily be washed off using water. It is possible because potassium has high solubility in water. Since the potassium leaching process is highly dependent on the solubility in water, the ratio of water to biomass, water temperature and time duration is the important parameter that affects the leaching process [48, 49]. The ratio of water to biomass affects how much potassium content can dissolve in the water. The more water used, the higher the saturation level will be, so more potassium can be dissolved and washed from the biomass [23].
Meanwhile, the water temperature affects potassium solubility in water [50]. With increasing temperature, the potassium content that can be reduced will also increase. The duration of the process directly affects how long the procedure takes. The longer the leaching process, the larger the amount of potassium that can be washed. However, because water has a saturation level for potassium, it is necessary to adjust the duration of the leaching in order to get optimal results [23]. It is reported that a longer leaching time results in a higher potassium reduction, with a maximum time of 24 hours. However, the optimal leaching time considering water and time savings is suggested to be in the range of 30 minutes [23].
In addition to these parameters, the type of wash treatment can influence how much potassium content can be reduced through the leaching process. Generally, potassium can be reduced only when it is exposed to leaching water. The selection of the appropriate leaching treatment is based on the physical characteristics of the solid. Furthermore, how the solute is present in the solid will affect the leaching performance. The solute may be on the outer surface of the solid, surrounded by an inert matrix of solid material, present in cells or chemically bonded [51]. Therefore, the type of leaching treatment must be adjusted so that the potassium content can be washed out more.
The potassium content of plants is found mainly in the cytoplasm, specifically in the cytosol and vacuoles [52]. Potassium plays a role in plant cell physiological and metabolic processes. Therefore, plants generally require potassium to remain fertile, which is why many fertilizers contain potassium. Naturally, the entry and exit of substances in plant cells are regulated by cell walls and membranes, so that the leaching water must be forced to meet the potassium inside [47, 52].
2 Discussion
2.1 Process of increasing heating value
As stated before, increasing the heating value is a way to improve the quality of palm EFBs as a solid fuel equivalent to coal. The basic concept explained in the previous section is that, to increase the heating value of materials, their fuel content must be improved. Regarding biomass, the fuel content is determined by its carbon content. Therefore, the way to increase the heating value of biomass is to increase the carbon content. This study briefly discusses the increase in the biomass heating value through the drying and torrefaction process. In the following, we discuss each drying and torrefaction process based on data obtained from the literature and research from various sources.
2.1.1 Drying process of EFBs
As discussed above, the drying process reduces the moisture content of the material using energy from heat. Normally in the industry sector, the EFB is shredded to obtain a single fibre and simultaneously reduce the moisture content. The carbon ratio will increase by reducing the moisture content, which is H2O, from the biomass. The average water content of biomass is very high. It is known that EFBs also have a high moisture content, which can be ≤60 wt% under raw conditions. This is high when compared with other biomass. Through the drying process, the moisture content of EFBs can be reduced to increase the heating value. The data in Fig. 4 show the increase in the heating value of EFBs after drying, which are collected from various sources.
![Heating value of EFBs in received and dried conditions from various sources [53, 25,45,54–56, 26, 4,54,57]](https://oup.silverchair-cdn.com/oup/backfile/Content_public/Journal/ce/7/6/10.1093_ce_zkad059/2/m_zkad059_fig4.jpeg?Expires=1749762622&Signature=Wz1EeK5k86FZ7onyAuU6D06jqGvYqzkgeCDkIEQXglJtXwiecnR1ANSy8j46EGBsOnB2KrSEhd~p9Oq53Tark5arhXZpQjbU4Zo1kPBnHCdJ1Qm1VICtBHAuYa3CEyHt38HWyDtMI6Xki0X3fJBcpPzk96g8mXl9jziPAufmRUO-dZgAp2AIAi9HV~3lNyfMul6dxuWMBQ5NKxBuai2DFy0rOWrPYrocqjBbxeW-yJLmQDoMa1klnBx8dKDZNDqCUTRbyobkJaGmhXgH7GTwF9aSU2azm-2ewnEWHMNB9m9J3oJiSOb0iaYIxRSCTAUYBIX1uMXYTHuUEeJ5QTKw5w__&Key-Pair-Id=APKAIE5G5CRDK6RD3PGA)
Based on the collected data, EFBs in raw condition have a heating value of 10.09 [45] to 10.57 MJ/kg [53]. Through the drying process carried out in the oven at 105°C for 24 hours, the heating value of EFBs can be increased to an average of 17.55 MJ/kg, ranging from 16.51 to 19.1 MJ/kg, resulting in 41.15% of the average energy yield. This significant increase in the heating value shows the potential of the drying process to increase the heating value of EFBs, considering that the drying process is quite simple because it only reduces the water content of the biomass.
Sukiran et al. [54] tested the heating values of EFBs from various feedstocks with different moisture contents in one of the tests performed. The materials were obtained by drying inside the oven until the specific moisture content was obtained. According to their study, the heating value increases as the moisture content decreases, as shown in Fig. 5.
![Heating value of EFBs in various moisture contents[54]](https://oup.silverchair-cdn.com/oup/backfile/Content_public/Journal/ce/7/6/10.1093_ce_zkad059/2/m_zkad059_fig5.jpeg?Expires=1749762622&Signature=h7jf76PK6hKvxrE2WEYXwO6Y6QiJVCjJsKJxiNnjde6zPNO-aDog4JAJ2ptEgiK~Pj~zdrDyez9smazmvqVe~IRz3wjuNVlclYwFoTLw8tueQeA-2YPcyTPDplei-q3u7lMeFwCVgRP2YRebVncxtuj2OGia3eOXSdmfhfV92oPqBX47IrdElrCbXfRXcvotktz54gpkAjosvYMQZ-RXvb1MzmOr1Oog3IqCw5MZou4yJ63vODwmz8~wujoeiGu5UHdbqNhlEhpLJ3XnIPiaSWuSAcP6YSEWxtY6PTbekfjOlYhV2RrDJ0nKUD55Uj0NoduFbrjFi0LLPc1zUfj5Ng__&Key-Pair-Id=APKAIE5G5CRDK6RD3PGA)
Heating value of EFBs in various moisture contents[54]
However, when the dried EFBs are compared with coal, they can only be equivalent to lower-rank coal, such as lignite A coal, based on ASTM D388. The dried EFBs have a heating value of 16–19 MJ/kg, while, according to the standard classification of coal by ASTM, lignite A has a heating value of 14.6–19.3 MJ/kg. Table 2 shows the carbon, hydrogen and oxygen composition contained in dried EFBs.
When compared to each other, the carbon composition is sufficient, but the presence of oxygen is still significant. Therefore, if we can further reduce the hydrogen and oxygen levels so that the carbon ratio increases, the heating value of EFBs has the potential to increase.
Changes that occur in biomass during the drying process are only in the form of a reduction in the moisture content, which means that there are no changes in its chemical structure. Therefore, biomass can maintain its natural properties, such as being hygroscopic, which is the property of a material that has a tendency to absorb moisture content from the environment. EFBs and other biomass with these properties can reabsorb moisture content after being dried to a certain extent. Reabsorption of the moisture content into biomass can result in a decrease in the heating value. This will be a significant loss, especially if the dried EFBs are not used directly as fuel, such as if the transfer process is performed first or they are stored for an extended period. Dried EFBs should be used directly with a short waiting period to avoid these losses, or the hygroscopic properties should be removed using another method. In summary, drying pretreatment of EFBs can increase the heating value to be comparable to the lowest coal rank, lignite A coal. However, further improvement in solid fuel characteristics can be performed by torrefaction, which is explained in the following section.
2.1.2 Torrefaction of EFBs
Torrefaction is a form of pyrolysis process—a thermochemical process that uses heat at temperatures of 200–300°C without oxygen [58]. As explained previously, the torrefaction process is appropriate for biomass because the lignocellulosic components are actively decomposed in the torrefaction temperature range. To obtain a better heating value, the carbon ratio of biomass needs to be increased and torrefaction is capable of doing this. Fig. 6 shows the increase in the carbon ratios EFBs after being torrefied at the range of temperatures 100°C ≤ T < 200°C, 200°C ≤ T < 250°C and 250°C ≤ T < 330°C, in the form of a van Krevelen diagram.
![Van Krevelen diagram showing the range of O/C and H/C ratios of EFBs in different ranges of temperatures[26, 53, 55, 56]](https://oup.silverchair-cdn.com/oup/backfile/Content_public/Journal/ce/7/6/10.1093_ce_zkad059/2/m_zkad059_fig6.jpeg?Expires=1749762622&Signature=IovDSaZvy-ofU3an~NA5n6BGKpPbzrJde1t91EFDPC9uQMSpuPPiR~OdUiDMOqPH~mVlDxd7~cOzQ9kH7J3M6Rk-uQOmue3yLAQ8~6UC2wTOjnhxQLVEh8EKWavPmn4dK-RjYNeEWJN1ZiE-lzdoMdZpY~hhYEs7g9o~PWwerRvB2-57gExOxwEe79H9G~jKUckMRSEUZ5D8NsnRbq5SJH9m666epCtKT9s2Ahu6Wudoi867FML3e0OLCtqoDScuN9Ocmi-Aq785846fKqAIkRfdzXQVNH1tIzNMI1QDuDu7vez3rVutgc3pyrldMsyP65tnxb~v6Xim14owmNxkzw__&Key-Pair-Id=APKAIE5G5CRDK6RD3PGA)
Changes in the carbon ratio that occur through the torrefaction process take place because of the thermal decomposition of lignocellulosic components. The decrease in the ratio of O/C and H/C can show a pattern of increasing the heating value and indicate the phenomenon that causes changes in the physical and hydrophobic properties due to the thermal decomposition that occurs. In general, there is a decrease in the ratio of O/C and H/C as the thermal decomposition temperature increases. However, if we look further, the decrease in the ratio of O/C and H/C that occurs in different temperature ranges does not occur constantly. Some temperatures have a significant impact on the carbon ratio. This difference occurs because the decomposition process in each temperature range is different.
It is reasonable to expect a significant decrease in the O/C and H/C ratios at temperatures of <200°C. However, the decrease is not due to lignocellulose decomposition, but rather to a decrease in the moisture content [4, 37]. The decrease in the O/C and H/C ratios in the temperature range of 200–250°C is insignificant. This is related to the lignocellulose decomposition that has just begun in this temperature range, the hemicellulose decomposition that has just begun and the lignin decomposition that is not significant [46]. Among the lignocellulose components of EFBs, hemicellulose is one of the dominant components. At higher temperatures, the decrease in the ratio of O/C and H/C that occurs is quite significant because the peak of hemicellulose decomposition has just been completed at 290°C. Furthermore, the decomposition of cellulose appears at ~300°C [46]. At higher temperatures, hemicellulose undergoes a dehydration mechanism that causes the release of H2O from the biomass, removing more oxygen and hydrogen from the biomass [46]. It is known that the peak of cellulose decomposition will end at 340°C and lignin at 360°C [46]. Therefore, lignocellulose decomposition will be performed under extreme conditions and more oxygen and hydrogen will be released.
This van Krevelen diagram was illustrated from the O/C and H/C ratios of EFBs that were previously gathered from various literature and can be seen in Table 3.
The O/C and H/C ratios of torrefied EFBs at different torrefaction temperatures
| Torrefaction range of temperatures | Ratio | |||||
|---|---|---|---|---|---|---|
| Average | Lowest value | Highest value | ||||
| O/C | H/C | O/C | H/C | O/C | H/C | |
| 100°C ≤ T < 200°C | 1.04a | 0.14a | 0.95d | 0.12d | 1.11g | 0.17g |
| 200°C ≤ T ≤ 250°C | 0.91b | 0.10b | 0.87e | 0.09e | 0.98h | 0.12h |
| 250°C < T ≤ 330°C | 0.65c | 0.09c | 0.48f | 0.08f | 0.90i | 0.12i |
bAverage ratio of O/C and H/C from dried EFBs at 200°C, 220°C, 240°C and 250°C, with residence times of 15 and 120 minutes [26, 53, 56].
cAverage ratio of O/C and H/C from dried EFBs at 260°C, 275°C, 280°C, 300°C and 330°C, with residence times of 30, 60, 90 and 120 minutes [26, 55, 56].
dThe lowest O/C and H/C ratio of torrefied EFBs with a temperature range of 100–200°C [55].
eThe lowest O/C and H/C ratio of torrefied EFBs with a temperature range of 200–250°C [53].
gThe highest O/C and H/C ratio of torrefied EFBs with a temperature range of 100–200°C [26, 53, 55].
As stated before and according to the data gathered, increasing the torrefaction temperature can yield a higher carbon ratio. Furthermore, as discussed previously, carbon content is a fuel property that must dominate fuel. As the carbon ratio increases, so does the heating value. Table 4 is a data compilation of the heating values of EFBs that were found to be different at various temperatures and residence times gathered from various literature. Increasing the heating value, as well as increasing the carbon ratio, is related to decomposition during the torrefaction process. These data are summarized in Fig. 7.
Heating values of EFBs under raw and torrefied conditions at different temperatures
| Torrefied EFB | t15 | t30 | t45 | t60 | t90 | t120 | |
|---|---|---|---|---|---|---|---|
| T200 | 21.01 | 23.02 | 23.8 | n/a | n/a | n/a | [25, 45] |
| n/a | n/a | n/a | n/a | n/a | 18.44 | [26] | |
| T220 | n/a | 17.17 | n/a | n/a | n/a | [53] | |
| n/a | n/a | n/a | n/a | n/a | 18.9 | [26] | |
| n/a | 21.1 ± 0.2 | n/a | n/a | n/a | [59] | ||
| T240 | n/a | n/a | n/a | n/a | n/a | 19.38 | [26] |
| n/a | 15.59 | n/a | n/a | n/a | n/a | [60] | |
| T250 | n/a | 17.67 | n/a | n/a | n/a | n/a | [53] |
| 22.24 | 24.17 | 24.54 | n/a | n/a | n/a | [25, 45] | |
| n/a | n/a | n/a | 19.72 | n/a | n/a | [56] | |
| n/a | 22.1 ± 0.1 | n/a | 22.6 | n/a | n/a | [59] | |
| T260 | n/a | n/a | n/a | n/a | n/a | 19.89 | [26] |
| T270 | n/a | 19 | n/a | 19.2 | n/a | n/a | [54] |
| n/a | 24.1 ± 0.2 | n/a | n/a | n/a | n/a | [59] | |
| T275 | n/a | n/a | n/a | 21.35 | n/a | n/a | [56] |
| T280 | n/a | n/a | n/a | n/a | n/a | 22.18 | [26] |
| n/a | 20.91 | n/a | 21.11 | 19.31 | n/a | [55] | |
| T300 | n/a | 20.41 | n/a | n/a | n/a | n/a | [53] |
| 22.63 | 24.34 | 25.03 | n/a | n/a | n/a | [25, 45] | |
| n/a | n/a | n/a | 26.24 | n/a | n/a | [56] | |
| n/a | n/a | n/a | n/a | n/a | 22.42 | [26] | |
| n/a | 21.56 | n/a | 21.39 | 22.54 | n/a | [55] | |
| T320 | n/a | 22.1 | n/a | 21.27 | 22.35 | n/a | [55] |
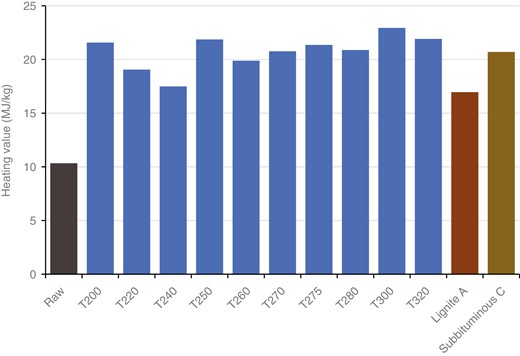
Comparison of the higher heating values of untreated (raw) EFBs, treated EFBs, lignite A coal and sub-bituminous C coal
Reflecting on the changes that occur with the carbon ratio, the heating value of EFBs will also increase through the same mechanism and will have the same pattern. At lower temperatures, the main process that occurs is drying, which results in a high yield of heating value, as previously discussed. However, at temperatures ranging from 200°C to 250°C, the increase in the heating value is not significant, nor is the decomposition that occurs. Starting from 250°C as hemicellulose decomposes at its peak, the heating value of EFBs will increase. When comparing torrefied EFBs to coal, the torrefaction process can produce solid fuel from EFBs with heating values equivalent to lignite A coal (low-rank coal) at 200°C and bituminous coal (middle-rank coal) at 300°C.
According to the results and data obtained from various sources, torrefaction is the best process for increasing the heating value of EFBs compared with the drying process. Furthermore, because of the increased heating value, torrefaction improves the grindability and hygroscopic properties of biomass.
2.2 Potassium reduction by leaching
2.2.1 Soaking treatment
As described in the previous section, the potassium content was reduced through a leaching process using water as the washing medium. The reduction in potassium content was carried out on palm EFBs. Data from various literature studies approximated the analysis of potassium reduction through the leaching process. Table 5 shows the reduction in potassium of EFBs by using the soaking treatment.
Potassium reduction from EFBs by soaking treatment [23]
| Leaching parameters | Ash content (wt%) | Potassium reduction (%) | |
|---|---|---|---|
| Residence time (minutes) | Water-to-biomass ratio | ||
| As received | 5.19 | n/a | |
| 5 | 50:1 | 2.66 | 48.7 |
| 10 | 50:1 | 2.21 | 57.4 |
| 20 | 50:1 | 1.66 | 68.0 |
| 30 | 50:1 | 1.54 | 70.3 |
| 5 | 30:1 | 2.98 | 42.6 |
| 10 | 30:1 | 2.59 | 50.1 |
| 15 | 30:1 | 2.43 | 53.2 |
| 20 | 30:1 | 2.17 | 58.2 |
| 25 | 30:1 | 1.97 | 62.0 |
| 30 | 30:1 | 1.89 | 63.6 |
| 5 | 20:1 | 3.19 | 38.5 |
| 5 | 25:1 | 3.15 | 39.3 |
| 5 | 30:1 | 2.98 | 42.6 |
| 5 | 35:1 | 2.82 | 45.7 |
| 5 | 40:1 | 2.79 | 46.2 |
| 5 | 50:1 | 2.66 | 48.7 |
Abdullah et al. showed a reduction in potassium content as a result of the soaking treatment of the leaching process with the parameters of residence time and the ratio of leaching water to biomass [23]. Based on the results shown in Table 5, the residence time affects how much potassium content can be reduced over the duration of the process. The potassium content in plant cells is found in the cytosol and vacuole [52]. Under normal conditions, the entry and exit of substances are regulated by cell walls and plant cell membranes [61]. Therefore, the leaching process requires time for the water to come into contact with the potassium. A longer duration of the leaching process will result in a higher potassium content that can be reduced. The same study showed that the more water used, the more potassium content can be reduced [23]. The amount of water used greatly affects the level of potassium saturation in the water.
The soaking treatment reduced the potassium content of raw EFBs to an average of 52.2% based on Abdullah et al. and the greatest reduction was found with a soaking treatment for 30 minutes using 50 litres of water. Meanwhile, the smallest amount was found to be 38.5% with a soaking treatment for 5 minutes using 20 litres of water [23]. The results of the reduction found in this study are significant because the leaching process is carried out on EFBs in raw condition.
2.2.2 Stirring treatment
The data used to analyse the stirring treatment are based on the results of Fuad et al., who show a decrease in potassium content due to the leaching process with different stirring speeds [62], as summarized in Fig. 8. In addition to that, the ratio of the washing water to the biomass and the residence time is also considered. Similarly to the result shown by Abdullah et al., the more washing water used, the more potassium content can be reduced, and the same is true for the duration of the residence time [23]. However, the effect given by the stirring speed is not in accordance with the initial assumption that the leaching process with agitation can help reduce more potassium from EFBs.
![Reduction of EFB ash content through stirring treatment with speeds of 180 and 540 rpm for 30 and 120 minutes[62]](https://oup.silverchair-cdn.com/oup/backfile/Content_public/Journal/ce/7/6/10.1093_ce_zkad059/2/m_zkad059_fig8.jpeg?Expires=1749762622&Signature=FChExiEkHPg6cN5Eg2SJqRMcI47oR30OZYOjOnHhoLw09P14LhO23vdixREJnRrtb5zXjssiUEilKk37eX7kGrUOI7xWtZHakQOPSLalJwNsuBJjd~blM6sjilxp693lwlZfeGwu9xseNaZtYTjgpav3TgIaQXCS7QEIX8cxqkwbM7Mc7Ojoc4VD8g5N8xzoDaV~Wat8LCJCNEuqUn-2mXrDng3TqoUJOYfDrrLpOIMOyWdJgC2hIflXZrt0qxkjiYTXFVDxMfoHFC06RcTmgBeODg5rBqEjiYpJiPYsE1YHYi6uTQ8KcKzPVcnyHNLU80UOzgyQxeO5AIOibZiM6Q__&Key-Pair-Id=APKAIE5G5CRDK6RD3PGA)
Reduction of EFB ash content through stirring treatment with speeds of 180 and 540 rpm for 30 and 120 minutes[62]
The ash content decreases as the stirring speed increases, but the higher the stirring speed, the lower the ash content that can be leached [62]. This tendency can be seen in the decrease in the leaching ability due to a very high rotational speed. This is because, at very high speeds, the movement of water will be more random, causing the washing water to be unable to penetrate the outer layer of the biomass through the surface pores. There is also the possibility that the washing water may be able to get inside but, due to the high rotational speed, the mixture of washing water and potassium is trapped due to the resulting centrifugal force [62].
Based on the results of the two treatments, namely soaking and stirring, we can conclude that the soaking treatment results in the best potassium reduction from EFBs. For the record, more research on the effect of the stirring speed on potassium reduction is required. Furthermore, because they do not require additional energy for agitation, soaking treatments use less energy than stirring treatments.
2.3 A sustainable flow for improving overall EFB quality as an alternative solid fuel
In the previous discussion, we talked about increasing the heating value of EFBs through drying and torrefaction processes. From that discussion, we conclude that torrefaction gives better results in increasing the heating value. Moreover, torrefaction can reduce hygroscopic properties, resulting in EFBs becoming a hydrophobic material, which is good, so EFBs could not reabsorb moisture content from the environment. Torrefaction is also known to improve material grindability. We also talked about how to reduce the potassium content of EFBs in the previous discussion. We conclude from the leaching process that the soaking treatment reduces potassium more effectively than the stirring treatment. However, the effect of the stirring speed requires further investigation.
However, our primary goal is to improve the overall quality of EFBs so that they can be used as an alternative coal-equivalent solid fuel with high heating value and little or no potassium content. In the next section, we will discuss the torrefaction of leached EFBs and the leaching of torrefied EFBs using a qualitative study to gain more understanding of how we can improve the overall quality of EFBs as an alternative coal-equivalent solid fuel.
2.3.1 Torrefaction of leached EFBs
The torrefaction of leached palm EFBs is comparable to the torrefaction of raw EFBs because no significant changes occur during the leaching process. However, the amount of mineral content, such as potassium, is reduced during the leaching process. A study by Kasim et al. tried to discover the effect of demineralization and torrefaction consequential pretreatment on the energy characteristics of palm EFBs [63]. In their study, EFBs were dried before the demineralization process. The demineralization process conducted in their study was very similar to the leaching process. However, it used a nitric acid solution at room temperature. It is known that through this process, the ash content can be reduced by ≤82% from untreated EFBs [64]. After going through the demineralization process, EFBs were torrefied and then the untreated EFBs, torrefied EFBs and demineralized–torrefied EFBs were compared.
Because of demineralization, the energy density of EFBs was slightly reduced compared with that of the raw EFBs. It was said to be affected by increasing the hydrogen and oxygen content of EFBs after being demineralized. After going through a torrefaction process, the energy density of the EFBs could increase to more than that of their raw condition [37, 65]. However, it was discovered in this study that the temperature of mass-loss demineralized–torrefied EFBs was raised when compared with only-torrefied and raw EFBs. It was suggested that this could be due to decomposition during torrefaction. It was also stated that the demineralized–torrefied EFBs had higher thermal stability because of their low ash content. It was also discovered that the mineral content of biomass could act as a natural catalyst for decomposition through torrefaction [66, 67]. However, in general, there is no significant problem with torrefaction in leached EFBs because the aforementioned problem can be solved by doing the torrefaction process at higher temperatures. Furthermore, by using this consecutive pretreatment of leaching and then torrefaction, the overall quality of EFBs as solid fuel can be increased.
2.3.2 Leaching of torrefied EFBs
Torrefaction allows palm EFBs, namely plant material based on lignocellulose, to decompose and increase their heating value [32]. Meanwhile, taking advantage of the high solubility of potassium in water can reduce potassium content during the leaching process [50]. Therefore, the washing ability depends on how much washing water can make contact with potassium [47]. The torrefaction process has a good effect on biomass from the fuel side, such as increasing the heating value, reducing the hygroscopic properties and increasing the grindability. However, some of these effects are believed to be capable of affecting how much potassium can be washed. The effects of the torrefaction process that are assumed to be able to affect the reduction in potassium content by the leaching process are the physical changes and the hydrophobic properties that arise from thermal decomposition.
Changes in physical form that occur due to torrefaction are thought to be able to affect the ability of the leaching process in order to reduce the potassium content of EFBs. As previously discussed, the torrefaction process can increase the carbon ratio due to the decomposition of lignocellulosic components [32, 37, 46]. Because of changes in the surface area and the emergence of hydrophobic properties in EFBs, increasing the carbon ratio is thought to affect the ability to reduce potassium content through the leaching process. The assumption was concluded because the leaching process utilizes potassium solubility in water, so the leaching ability is strongly influenced by how much washing water meets the potassium [21, 27, 53]. Therefore, while the torrefaction process may cause changes in biomass, the leaching performance may be affected afterward.
The potassium content in plant cells is dispersed throughout the cytoplasm, specifically in the cytosol and vacuoles [52]. Cytosol is a liquid filling in cells whose main composition is water. The vacuole is a storage warehouse containing dissolved water covered by a plasma membrane found to have a high potassium content. Plant cells differ from other types of cells. Plant cells have a cell wall in the outermost layer, following the cell membrane [68]. Plant cells are depicted in Fig. 9, which shows EFBs microscopically in the form of plant cells and the physical changes that may occur due to the torrefaction process. It is known that the main component of the cell wall is lignocellulose.
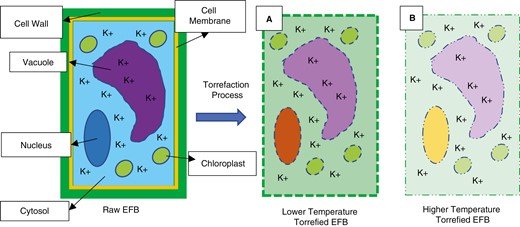
Illustration of plant cell physical changes due to the torrefaction process in EFBs
Naturally, the flow of substances into and out of plant cells is regulated by mechanisms in the cell wall and the membrane [52]. Therefore, when the leaching process is carried out, the washing water cannot directly meet the potassium contained inside the cell. For the leaching process to take place more optimally, washing water must be forced to meet the potassium inside the cell wall.
The first assumption of the effect of the torrefaction process on the leaching ability is that there is a physical change in the biomass. This physical change is thought to be one way to force washing water to meet the potassium inside the cell. The more thermal decomposition occurs, the more physical changes will appear in the biomass [69, 26]. Decomposition during the torrefaction process damages plant cell walls, the main component of which is lignocellulose. Damage is believed to take the form of holes or cracks in the cell wall that allow washing water to enter and exit freely inside [37]. Damage can also occur by thinning of the cell wall due to decomposition [37]. The depletion of the cell wall is believed to damage the natural mechanism of the substances entering and leaving the cell, so it is hoped that the washing water can meet more of the potassium inside the cell. Fig. 9 depicts this assumption regarding the physical changes caused by the torrefaction process.
In addition to affecting the lignocellulose component, which causes the cell wall to undergo physical changes, the decomposition process also affects other components of the biomass [53]. However, substances such as mineral content and other inorganic materials do not change. The moisture content will begin to decrease at a temperature of <100°C. Because the cytosol or fluid in the cell has a high moisture content, the inside will lose its contents during the torrefaction process, resulting in a void in the cell. The vacancy of the inside part of a cell for a long time can cause a decrease in the cell size. This shrinkage in cell size causes stress to build up on the outer part of the cell, causing the cell to rupture [37]. This loss of moisture content also affects the bulk density and grindability properties that appear in the biomass due to the torrefaction process. The degree of structural damage is strongly influenced by the type of biomass and the torrefaction parameters such as the residence time and temperature [70].
Some organic substances found in biomass, such as fats, waxes, alkaloids, proteins, pectin, simple sugars and other organic substances, decompose and are released as volatile matter. The amount and location of these organic substances during the torrefaction process have a significant impact on the yield, amount and devolatilized products [37].
Other substances that make up the majority of cell parts are proteins and lipids [61]. These two substances spread and make up cell parts, such as the cell membrane and other cell organelles, including the vacuole. In addition to the cell wall, the cell membrane also protects the inside of the cell and regulates the entry and exit of substances in the cell [68]. However, the cell membrane is a very thin semipermeable layer and, due to its composition of proteins and lipids, it will be destroyed as the temperature of the thermal decomposition increases [37].
As explained previously, a higher torrefaction temperature will result in a greater lignocellulosic decomposition [53, 45]. In addition to the temperature, the residence time influences how much decomposition occurs [45]. Therefore, a higher level of the torrefaction process will cause greater physical changes in the biomass, which can lead to better washing ability. This statement is illustrated in Fig. 10, which shows the effect of physical changes due to thermal decomposition on leachability.
An illustration of a plant cell with physical changes due to the decomposition of lignocellulose at (a) low and (b) high torrefaction temperatures of EFBs
Aside from physical changes, the second assumption mentioned at the beginning of this section is the hydrophobicity that appears in the biomass as a result of the torrefaction process. Based on the investigation conducted by Tumuluru et al., the hydrophobicity of biomass will increase as the temperature of torrefaction increases [37]. The result of their investigation showed that the ability of biomass under various conditions to reabsorb moisture from the environment decreased. In the raw condition, pellets made from wood particles measuring 0.8 mm were able to reabsorb moisture content of ≤16 wt%. When the wood pellets were torrefied at 300°C, the reabsorption ability was reduced by ≤25%. In other words, hydrophobicity appears in the biomass as a result of the torrefaction process.
Hydrophobicity is a physical property of a molecule that makes it repel water (hydrophobic) [32]. The hydrophobic nature is highly dependent on how many –OH (hydroxyl) functional groups are present in the biomass [37, 69]. The torrefaction process causes the biomass to decompose in certain ways, and some of the hydroxyl functional groups in the biomass are also affected and released in the form of volatile matter [37, 69]. According to research conducted by Chen et al., reduction in the content of hydroxyl groups is a reaction that often occurs during the torrefaction process [69]. The hydroxyl group turns into a carboxyl group and is then released as volatile matter. The higher the number of hydroxyl functional groups released, the greater the biomass hydrophobicity [69].
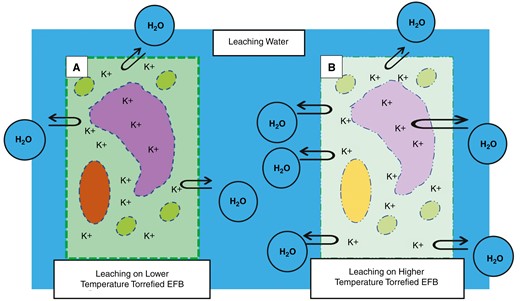
Under normal conditions or without any pretreatment, biomass has a very high moisture content. The moisture content can be reduced when the drying process is carried out. However, due to the hygroscopic nature of biomass, the moisture content can be reabsorbed naturally from the environment [37, 71]. Through the torrefaction process, the hygroscopic properties can be reduced and the hydrophobic properties can be increased [32, 37, 71]. The effect of hydrophobicity on the leaching process is that biomass cannot escape because EFBs appear to repel water, resulting in reduced or even impossible washing water content with the potassium content. Potassium is located in the cytosol and vacuole of plant cells [52]. The illustration of plant cells can be seen again in Fig. 10. These parts are covered by a cell wall, whose main component is lignocellulose [68, 61]. The torrefaction process causes thermal decomposition so that organic components, such as the constituents of the cell wall, the cell membrane, fluid inside the cell and the cell organelles, will be reduced. However, the content of minerals such as potassium is not affected, so it is likely that potassium is trapped inside when EFBs are torrefied [37]. The trapped potassium is difficult to leach with water because the biomass has become hydrophobic [71]. Hydrophobicity makes it difficult or even impossible for the washing water to penetrate the biomass layer. When EFBs are torrefied at lower temperatures, it is suspected that there are still enough hydroxyl groups so that they can exert an attractive force on water molecules. The attracted water is expected to be able to penetrate the cell wall so that it can come into contact with the potassium trapped inside the cell. However, at higher torrefaction temperatures, the hydrophobicity of biomass is already high because many hydroxyl groups are decomposed, resulting in the reduction of potassium content through the leaching process becoming more difficult to do. A statement on the alleged effect of hydrophobicity on washability is illustrated in Fig. 11.
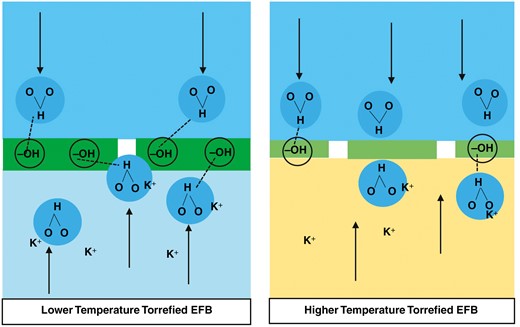
Illustration of the alleged effect of hydrophobicity on leaching performance
In summary, the leaching treatment by soaking can effectively reduce the potassium content from EFBs. Following torrefaction treatment, the heating value and potassium and ash content reduction can be improved. On the other hand, torrefaction followed by the leaching process provides effective ash and potassium removal due to solid decomposition that allows a deeper penetration of water for the leaching treatment. However, torrefaction results in a hydrophobic surface property that is not preferable for the leaching process. Therefore, the order of leaching followed by torrefaction is preferable for the pretreatment of EFBs.
In addition to the potassium reduction process during the fuel pretreatment process, periodic clean-in-place can also be performed in the combustion system for optimum fouling mitigation. Further development can be proposed by integrating Industry 4.0 (4.0IR), employing sensor technology, data analysis [72] and machine learning [73]. Sensor technology and remote monitoring with the internet of things provide real-time monitoring of key parameters to detect fouling-related issues and optimize operational conditions to prevent or mitigate fouling. With emerging data analytics and machine learning, advanced collected data can be used to identify patterns, correlations and early warning signs of fouling.
3 Conclusion
The use of palm EFBs as an alternative solid fuel is very interesting because of their high potential considering their availability. There are two ways to improve the quality of EFBs to use them as solid fuel, namely increase the heating value and reduce the potassium content. This review has gathered and provided insight based on these two ways. The increase in the heating value of EFBs is discussed with the drying and torrefaction process, and the reduction of potassium content is discussed with the leaching process.
(i) To increase the heating value of EFBs, the fuel content, which is carbon, needs to be increased.
(ii) The drying and torrefaction processes can increase the carbon ratio. Through drying, the carbon ratio can increase because the moisture content of EFBs is reduced, whereas in the torrefaction process, the carbon ratio could be further increased because another chemical structure can change and reduce more.
(ii) Torrefied EFBs are more suitable than dried EFBs as an alternative solid fuel because, by the torrefaction process, the heating value could be higher and the hygroscopic properties could be reduced or even removed.
(iv) The leaching process is believed to be a simple and effective potassium reduction process. Between soaking and stirring treatments, stirring treatment can reduce the potassium content to some extent.
(v) There will be two aspects that require further research if we try to do the leaching process on torrefied EFBs, namely physical changes and changes in hydrophobicity. Both appear when biomass is torrefied, and the higher the torrefaction temperature, the greater both will be. Physical changes are presumed to positively affect leaching performance, which will help in reducing the potassium content even further. However, hydrophobicity is believed to disturb leaching performance by repelling water from the EFB surface so water cannot contact the trapped potassium inside.
(vi) There are several things that need to be considered if we are trying to do a torrefaction process on leached EFBs. Because leached EFBs have a high moisture content, more energy will be required to evaporate that first or in advance, resulting in a lower energy density yield than in the raw state. Aside from that, mineral content is thought to act as a torrefaction catalyst and this has been proven in several studies. As a result of reducing the mineral content of EFBs, the torrefaction process will be shifted to achieve the same decomposition as in unleached EFBs.
Acknowledgements
This study was supported financially by Institut Teknologi Bandung as part of the research, community service and innovation program (PPMI) 2021.
Data Availability
The data underlying this article are available in the article.
Conflict of interest statement
None declared.
