


Abstract
CD4+ T cells are activated during inflammatory dilated cardiomyopathy (iDCM) development to induce immunogenic responses that damage the myocardium. Low-intensity pulsed ultrasound (LIPUS), a novel physiotherapy for cardiovascular diseases, has recently been shown to modulate inflammatory responses. However, its efficacy in iDCM remains unknown. Here, we investigated whether LIPUS could improve the severity of iDCM by orchestrating immune responses and explored its therapeutic mechanisms.
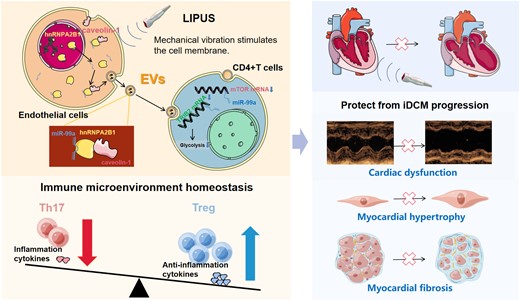
In iDCM mice, LIPUS treatment reduced cardiac remodelling and dysfunction. Additionally, CD4+ T-cell inflammatory responses were suppressed. LIPUS increased Treg cells while decreasing Th17 cells. LIPUS mechanically stimulates endothelial cells, resulting in increased secretion of extracellular vesicles (EVs), which are taken up by CD4+ T cells and alter their differentiation and metabolic patterns. Moreover, EVs selectively loaded with microRNA (miR)-99a are responsible for the therapeutic effects of LIPUS. The hnRNPA2B1 translocation from the nucleus to the cytoplasm and binding to caveolin-1 and miR-99a confirmed the upstream mechanism of miR-99a transport. This complex is loaded into EVs and taken up by CD4+ T cells, which further suppress mTOR and TRIB2 expression to modulate cellular differentiation.
Our findings revealed that LIPUS uses an EVs-dependent molecular mechanism to protect against iDCM progression. Therefore, LIPUS is a promising new treatment option for iDCM.
Time of primary review: 23 days
1. Introduction
Inflammatory dilated cardiomyopathy (iDCM), which causes irreversible left ventricular enlargement and systolic myocardial dysfunction due to inflammation, is a challenging clinical problem.1,2 More than 30% of patients develop cardiomyopathy after myocarditis (also known as iDCM), with a survival rate of 40% after 10 years.2 Further, despite advances in treatment, multiple observational studies have revealed that some patients are still at risk of sudden cardiac death or end-stage heart failure, with heart transplantation as the only option.3 Therefore, there is an urgent need to investigate novel therapeutic approaches based on understanding the immunological and pathological features of iDCM.4
Mounting evidence suggests that the progression to iDCM is accompanied by the activation of immune cells, especially CD4+ T cells.5 CD4+ T-cell dysfunction is a defining feature of iDCM.6 CD4+ T-cell activation markers, including CD25 and CD69, are highly expressed in iDCM, indicating that CD4+ T cells are activated.7 In addition, autoantibodies8 and CD4+ T cells, primarily T helper-17 (Th17), which target the myocardium, direct specific immune responses against cardiac myosin. Higher percentages of Th17 cells and lower levels of FOXP3+ regulatory T cells (Tregs) have been identified as important immunological features of iDCM and poor clinical features.9,10
Novel immunomodulatory therapies, including inhibitors of IL-1β, TGF-1β, and HIF-1α-related pathways, have recently been identified as effective for treating iDCM, highlighting the significance of regulating immune cell plasticity in iDCM therapy.11,12 However, immunoregulatory agents are invariably associated with side effects, severely limiting clinical translation. Therefore, developing new therapeutic strategies for iDCM is necessary and urgent. Low-intensity pulsed ultrasound (LIPUS) is a type of low-power ultrasound that can directly stimulate recipient cells with a specific pulsed waveform, induce cell elastic vibration, and promote intercellular communication through unique mechanical effects.13 It has been revealed that LIPUS therapy can induce immune-regulatory effects by upregulating major regulators of immunosuppressive cells and suppressing pro-inflammatory cells. In addition, LIPUS therapy can promote revascularisation, repair damaged myocardium, and improve cardiac function.14–16 However, whether LIPUS therapy is effective for iDCM remains unknown.
Endothelial cells (ECs) are mechanically sensitive, and the mechanical vibration of LIPUS causes ECs to produce extracellular vesicles (EVs).14,16 EVs are a heterogeneous class of bilayer nanovesicle populations containing a large number of active macromolecules, such as proteins, metabolites, lipids, and nucleic acids, which can be transported to target cells while retaining their functional activity.17 EVs are essential mediators of intercellular communication, which can modulate immune cell function and influence the cardiac immune microenvironment.18 It has been revealed that EVs can deliver functional microRNAs (miRNAs) into receptor cells. Furthermore, EVs can rapidly regulate the expression of relevant genes in recipient cells.19 Therefore, the use of EVs to modulate immune cell function homeostasis and the dynamic balance of the cardiac and immune microenvironment has emerged as a new therapeutic target.4,20 Our studies have revealed that EVs can regulate CD4+ T-cell differentiation as important mediators in the process of experimental autoimmune myocarditis (EAM), which represents the early phase of iDCM.12 Furthermore, we believe that modulating EVs to alter immune-regulatory functions could be an effective treatment for EAM and iDCM.18 Hence, this study aimed to explore whether LIPUS therapy could modulate CD4+ T-cell function and alleviate iDCM further by stimulating EVs.
2. Methods
2.1 Animals and LIPUS therapy
Male BABL/C mice (6–8 weeks old, 18–20 g) were purchased from the Laboratory Animal Center of Harbin Medical University's Second Affiliated Hospital (Harbin, China). All animal care and use procedures followed the National Society for Medical Research's Principles of Animal Care and the Handbook for the Care and Use of Laboratory Animals (Institute of Laboratory Animal Resources/NIH). All animal research was carried out in accordance with procedures authorized by the Committee on the Ethics of Animal Experiments of Harbin Medical University's Second Affiliated Hospital (Approval No. sydwgzr2021-139).
To construct an iDCM mouse model, mice were accepted intraperitoneal injection with 200 μg alpha-myosin heavy chain peptide (MyHCα: MyHC-α 614–629 [Ac-S LKLM ATLFSTYAS AD-OH]; Ontores Biotechnologies Co, Ltd Zhejiang, China) emulsified in an equal volume of phosphate-buffered saline/complete Freund's adjuvant (CFA; Sigma-Aldrich Corp., St. Louis, MO, USA) via bilateral groin on days 0 and 7 of the experiment. Participants were randomly separated into two groups: those who received LIPUS therapy (LIPUS group) and those who did not receive LIPUS therapy (no-LIPUS group). The sham-operated groups (with or without LIPUS therapy) were created using the identical process but without the MyHC injection. On day 42, experimental animals were monitored for the development of inflammatory infiltration and DCM transformation prior to euthanasia by cervical dislocation.
After connecting the LIPUS device (SXULTRASONIC), the low-frequency plane probe was fixed on the chest of mice through an agar phantom gel in order to irradiate the heart with a stable sound field. A 1.0-MHz focused ultrasound transducer was used to stimulate the heart noninvasively with a 20% duty cycle, pulse repetition frequency of 1000 Hz, and LIPUS power of 0.25 W/cm2. The LIPUS group mice were given LIPUS treatment every other day from day 7 to day 42 and three times a day for 20 min every time under inhalation anaesthesia with 1.2% isoflurane, whereas the no-LIPUS group underwent the same procedures three times including anaesthesia but without the LIPUS therapy.
2.2 Statistical analysis
Data are presented as means ± standard deviation of the mean of at least three independent experiments, with different donors used for each n. Statistical analyses were carried out using SPSS 23.0 (SPSS, USA) and GraphPad Prism 9 (GraphPad Software, CA, USA). Biological independent batches were used a Student's t-test and one-way analysis of variance with Bonferroni's post hoc test.
3. Results
3.1 LIPUS therapy ameliorates myocardial remodelling in iDCM progression
Mice were injected with MyHCα+CFA or CFA only on days 0 and 7 to explore whether LIPUS treatment could prevent iDCM progression. The mice were then administered LIPUS every other day from days 7 to 42, and the results were analysed (Figure 1A). On day 21, cardiac inflammation and fibrosis were advanced with disease progression in the iDCM mice, whereas the LIPUS treatment group did not show obvious differences in these respects (see Supplementary material online, Figure S1A–D).
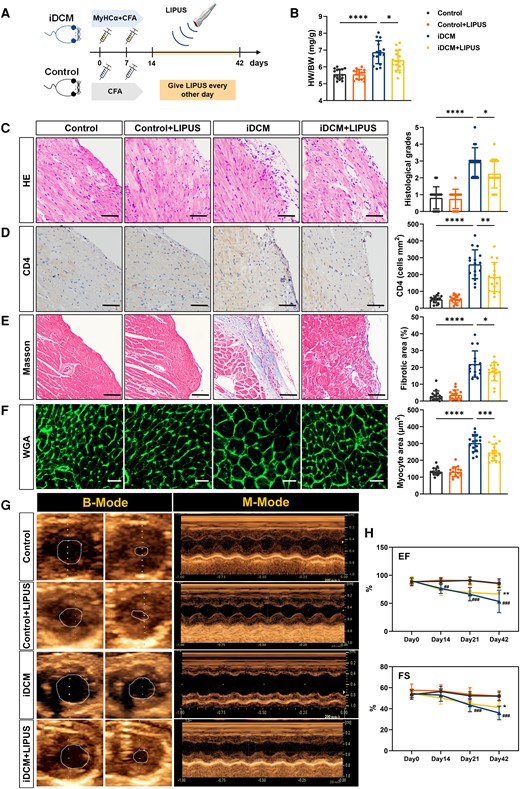
Measurement of cardiac pathological and cardiac function after LIPUS therapy. (A) Mice were injected with MyHCα+CFA or CFA on day 0 and day 7. Mice were given LIPUS treatment every other day from day 7 to day 42 and were sacrificed on day 42. (B) HW/BW ratios were measured on day 42 (P < 0.0001 iDCM vs. Control and P = 0.0242 iDCM + LIPUS vs. iDCM). (C) Cardiac tissue H&E staining was performed (scale bars = 100 μm) and the H&E images were analysed based on histological grades (P < 0.0001 iDCM vs. Control and P = 0.0309 iDCM + LIPUS vs. iDCM). (D) CD4+ cell infiltration in the cardiac sections was analysed by immunohistochemistry (scale bars = 100 μm; P < 0.0001 iDCM vs. Control and P = 0.0033 iDCM + LIPUS vs. iDCM). (E) Representative masson trichrome stains and quantitation of fibrosis in mice hearts. The blue-stained collagen fibre area was expressed as a percentage of the total field area analysed (scale bars = 100 μm; P < 0.0001 iDCM vs. Control and P = 0.0361 iDCM + LIPUS vs. iDCM). (F) FITC-WGA staining of cardiomyocyte membrane (scale bars = 50 μm; P < 0.0001 iDCM vs. Control and P = 0.0006 iDCM + LIPUS vs. iDCM). (G) Typical representative diagrams of four groups on day 42. (H) EF (Day 14: P = 0.0018; Day 21: P = 0.0003; Day42: P = 0.0002# iDCM vs. Control; P = 0.0012 * iDCM + LIPUS vs. iDCM), and FS (Day 21: P = 0.0009; Day42: P = 0.0004 # iDCM vs. Control; P = 0.0391 * iDCM + LIPUS vs. iDCM; B-H, n = 16) was measured using echocardiography. Results are expressed as mean ± SD; one-way ANOVA with Bonferroni post hoc test; *P < 0.05; **P < 0.01; ***P < 0.001; ****P < 0.0001; ##P < 0.01; ###P < 0.001.
On day 42, iDCM mice had a significantly higher heart-to-body weight ratio (HW/BW) than that of the control mice. However, HW/BW was reduced in iDCM + LIPUS mice compared with iDCM mice (Figure 1B). Total inflammatory cells and CD4+ T-cell infiltration were significantly increased in iDCM mice compared with control mice, but decreased in iDCM mice after LIPUS treatment, as revealed by HE and CD4 immunohistochemical staining (Figure 1C and D). In addition, we observed the safety of LIPUS using HE staining. The results showed no oedema or inflammation of the heart, liver, and lungs after LIPUS treatment (Figure 1C and see Supplementary material online, Figure S2). Progressive post-inflammatory fibrosis critically contributes to the development of iDCM.12 Masson staining revealed significant collagen deposition in the iDCM mice, whereas LIPUS therapy significantly reduced the fibrotic area (Figure 1E). We found that iDCM mice had a significantly larger cardiomyocyte area than control mice, whereas the cross-sectional area decreased following LIPUS treatment as measured by wheat germ agglutinin (Figure 1F).
We discovered higher brain natriuretic peptide (BNP) and hydroxyproline levels in the plasma of iDCM mice compared with control mice, which decreased after LIPUS treatment (see Supplementary material online, Figure S3A and B). Furthermore, the expression of Mmps, including Mmp2 mRNA and Mmp9 mRNA, increased in iDCM mice compared with control mice. However, after LIPUS treatment, these molecular levels were reduced in iDCM mice (see Supplementary material online, Figure S3C). Moreover, the expression of characteristic myofibroblast genes, including Acta2 mRNA, Fn1 mRNA, Col1a1 mRNA, and Sma mRNA, increased in iDCM mice compared with control mice. However, LIPUS treatment effectively suppressed the expression of the profibrotic genes (see Supplementary material online, Figure S3D).
We used transthoracic echocardiography to evaluate the systolic function of the heart (Figure 1G). iDCM mice showed lower ejection fraction (EF) and fractional shortening (FS) along with disease progression; however, the cardiac function was improved with LIPUS treatment (Figure 1H). Moreover, the iDCM mice had significant cardiac enlargement, whereas LIPUS treatment suppressed this enlargement (see Supplementary material online, Figure S3E).
We further investigated whether LIPUS could reverse fibrosis, which was essentially formed on day 34. The mice were administered LIPUS every other day from days 34 to 62 (see Supplementary material online, Figure S3A). On day 62, no difference in fibrotic area and hydroxyproline levels was observed between the LIPUS and iDCM groups (see Supplementary material online, Figure S4B and C). Fibrosis-related molecular levels were not altered after LIPUS treatment (see Supplementary material online, Figure S4D). These results indicate that LIPUS was unable to reverse the established myocardial fibrosis.
In addition, we used Coxsackievirus B3 to induce a mouse model of viral myocarditis (VMC), which progresses gradually to iDCM. It showed similar results in the MyHCα+CFA-induced iDCM mice. LIPUS reduces inflammation and myocardial fibrosis in the VMC mice (see Supplementary material online, Figure S5A–H).
Therefore, all these results indicated that the degree of cardiac remodelling in the iDCM mice was alleviated after LIPUS treatment.
3.2 LIPUS promotes cardiac Treg cells but inhibits Th17 cells in iDCM mice
CD4+ T-cell differentiation has been linked to the pathogenesis and progression of iDCM.7 Th17 cells are an important subpopulation for iDCM progression, while Treg cells protect against cardiac immunological injury. Therefore, we measured cardiac CD4+ T-cell differentiation following LIPUS therapy.
On day 21, leukocytes (CD45+) and Treg (CD4+ Foxp3+) cells were not altered in the LIPUS group. However, Th17 (CD4+ IL-17A+) cells were decreased (see Supplementary material online, Figure S6A). Meanwhile, no differences in Foxp3, IL-10, and IL-17A were noted in the cardiac tissues of the LIPUS-treated mice. However, RORγt was reduced post-LIPUS treatment (see Supplementary material online, Figure S6B–E).
On day 42, using immunofluorescence staining, we quantified CD4+ T-cell subtype infiltration in mouse myocardial tissues and found a decrease in CD4- and IL-17A-positive cells after LIPUS treatment, but an increase in the number of CD4- and Foxp3-positive cells in the myocardial tissues of iDCM mice (Figure 2A and B).
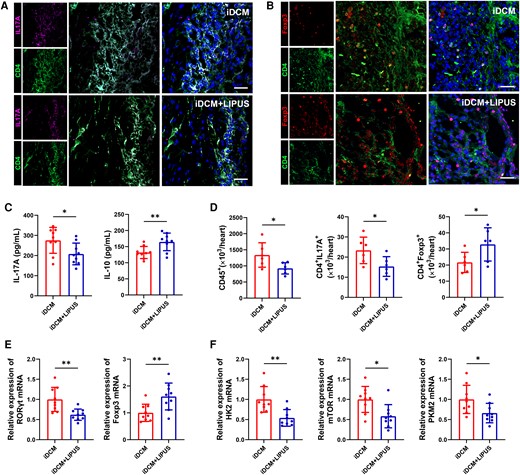
CD4+ T-cell immunometabolic status in the hearts of mice after LIPUS therapy on day 42. (A, B) Immunofluorescence staining was used in iDCM + LIPUS and iDCM mice hearts to show the number of Th17 (CD4+ IL-17A+) cells and Treg (CD4+ Foxp3+) cells (scale bars = 100 μm). (C) Levels of IL-17A and IL-10 in plasma by ELISA (IL-17A: P = 0.0280; IL-10: P = 0.0089, n = 9). (D) The numbers of leucocyte, Th17 cell, and Treg cell were assessed by flow cytometry in mice hearts (CD45+: P = 0.0351; CD4+ IL-17A+: P = 0.0381; CD4+ Foxp3+: P = 0.0471, n = 6). (E) Levels of RORγt mRNA and Foxp3 mRNA expression in the myocardial tissue of mice on day 42 by qPCR (RORγt: P = 0.0034; Foxp3: P = 0.0073, n = 9). (F) Levels of HK2 mRNA, mTOR mRNA and PKM2 mRNA expression in mice myocardial tissues by qPCR (HK2: P = 0.0023, mTOR: P = 0.0105; PKM2: P = 0.0296, n = 9). Results are expressed as mean ± SD. Comparisons of parameters were performed with student's t-test. *P < 0.05; **P < 0.01.
Furthermore, ELISA revealed higher levels of IL-10 and a decreased concentration of IL-17A in iDCM + LIPUS mice (Figure 2C). Following LIPUS treatment, there was a significant decrease in leukocytes. We also observed a considerable decrease in the number of cardiac Th17 cells and an increase in the proportion of cardiac Treg cells in the iDCM + LIPUS group (see Supplementary material online, Figure S7 and Figure 2D). In addition, no difference in Th17 and Tregs cell counts was observed in the peripheral blood on day 42 between the iDCM + LIPUS and iDCM groups (see Supplementary material online, Figure S8A–C). Compared with the iDCM mice, the expression of RORγt and IL-17A mRNA was decreased in the cardiac tissue of LIPUS-treated mice, while Foxp3 and IL-10 mRNA expressions were increased on day 42 (Figure 2E and Supplementary material online, Figure S6B–E). In addition, we discovered the expression of transcription factors including Rara, Atf6, and Rarg was decreased in iDCM mice with LIPUS therapy, indicating the IL-17a+ γδ T cells were also decreased (see Supplementary material online, Figure S9).
In our previous study, we found that T-cell glycolysis promotes differentiation towards a subpopulation of Th17 cells in iDCM mice. Conversely, glycolysis inhibition of T cells caused differentiation into Treg cell subpopulations.7 Therefore, we measured the key glycolysis molecules after LIPUS therapy. We observed that the expression of HK2, mTOR, and PKM2, which are related genes involved in glycolysis, increased in CD4+ T cells from iDCM mice.7,18 However, LIPUS therapy decreased the expression of these mRNAs in iDCM mouse cardiac CD4+ T cells (Figure 2F). These findings suggest that LIPUS can modulate cardiac CD4+ T-cell immunometabolism to reprogramme the immune microenvironment and slow iDCM progression.
3.3 LIPUS therapy induces the production of ECs-derived EVs in vitro and in vivo
It has been revealed that LIPUS can stimulate EVs. In addition, LIPUS could exert immunoregulatory effects through EVs.16 To investigate the role of EVs in LIPUS protection against iDCM progression, we intraperitoneally injected GW4869, which can inhibit the release of EVs, into the iDCM model. We found that LIPUS promoted the production of cardiac EVs in iDCM mice. While the release of EVs was inhibited in iDCM mice after injecting GW4869, even after LIPUS treatment (see Supplementary material online, Figure S10A). In addition, GW4869 treatment decreased the therapeutic effects of LIPUS. Meanwhile, no structural alterations or cardiac pathology differences between GW4869 and GW4869 + LIPUS mice (see Supplementary material online, Figure S10B–H). Therefore, the therapeutic effects of LIPUS are dependent on EVs.
Cardiac EVs were isolated from iDCM and iDCM + LIPUS mice after brief mincing of the left ventricles (Figure 3A). We used transmission electron microscopy (TEM) and observed EVs that appeared round- or oval shaped (Figure 3B). The relative expression levels of the EV marker proteins Alix and CD63 in iDCM + LIPUS mice were significantly higher than those in the control groups. Calnexin and ApoA1 were absent in the iDCM and iDCM + LIPUS groups (Figure 3C and D), indicating no cellular and lipoid contaminant of EVs. We used nanoparticle-tracking (NTA) analysis to determine the size distribution of these vesicles with diameters ranging from 50 to 200 nm and found no differences in peak diameters between the two groups. However, EVs increased significantly after LIPUS irradiation (Figure 3E). Furthermore, after LIPUS treatment, the expression levels of CD105 and Cav-3, which are markers of ECs and cardiomyocytes increased, respectively (Figure 3F and G). LIPUS treatment resulted in high numbers of EVs expressing the ECs markers CD105 and CD144 (Figure 3H).
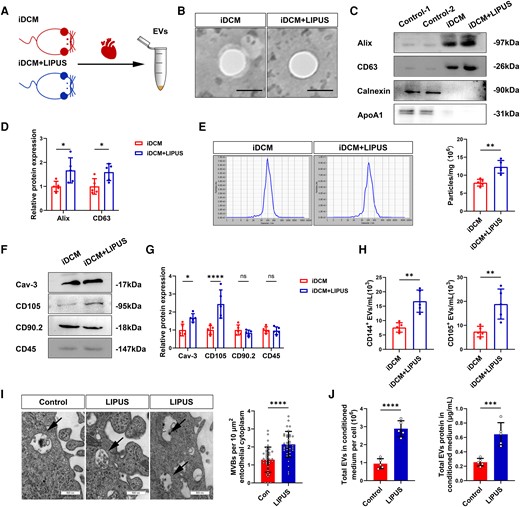
Release of EVs after LIPUS treatment in vitro and in vivo. (A) EVs were isolated from the myocardial tissue of iDCM + LIPUS and iDCM mice on day 42. (B) Representative TEM of isolated EVs from the myocardial tissue (scale bars = 100 nm). (C, D) Representative blots of EVs marker protein (Alix, CD63) and contaminant protein (Calnexin, ApoA1) in EVs purified. CD4+ T-cell lysates were used as a control for Alix, CD63 and Calnexin (Alix: P = 0.0229;CD63: P = 0.0427, N = 5 independent repeats). (E) Representative results of NTA demonstrating size distributions and numbers of EVs (P = 0.0012, n = 5). (F, G) The relative protein expression of cellular markers in EVs were measured by Western Blot (Cav-3: P = 0.0214; CD105: P < 0.0001, N = 5 independent repeats). (H) Cellular origin analysis of EVs isolated from myocardial tissue of iDCM + LIPUS and iDCM mice (CD144+: P = 0.0012; CD105+: P = 0.0047, n = 5). (I) Morphology of HCAECs-derived MVBs observed by TEM (scale bars = 500 nm). Quantification the number of MVBs (P < 0.0001, n = 5). (J) Measured total EVs in conditioned medium per cell by NTA (P < 0.0001, n = 5). Measured total EV proteins in the conditioned medium by bicinchoninic acid assay (BCA) (P = 0.0009, n = 5). Results are expressed as mean ± SD. Comparisons of parameters were performed with student's t-test. *P < 0.05; **P < 0.01; ***P < 0.001; ****P < 0.0001.
We then investigated in vitro whether EV production in the ECs responds to LIPUS stimulation (see Supplementary material online, Figure S11A). We measured the release of EVs in the human coronary endothelial cells (HCAECs) treated with or without LIPUS, using TEM. After LIPUS irradiation, the release of multivesicular bodies (MVBs), the source of EVs, was visible at the edge of the ECs; the number of MVBs was increased (Figure 3I). More importantly, we found an increase in EVs following LIPUS treatment, as measured by the total EVs number or protein levels in the conditioned medium (Figure 3J). In mouse aortic endothelial cells (MAEC), we observed round or oval-shaped particles in the control and LIPUS groups (see Supplementary material online, Figure S11B). We also found that the number of EVs increased after LIPUS treatment (see Supplementary material online, Figure S11C). In addition, LIPUS also promoted EV production of AC16 cells, but the amount of change was relatively low (see Supplementary material online, Figure S11D). These findings confirmed that LIPUS stimulates EV production, especially in the ECs.
3.4 Endothelial EVs from LIPUS treatment regulate the immunometabolic status of CD4+ T cells in vitro
We cultured CD4+ T cells, stimulated them with anti-CD3/CD28 antibodies, and then treated them with EVs isolated from iDCM mice with LIPUS therapy (LIPUS-EVs) in regulating CD4+ T-cell functions. We observed that the expression of RORγt mRNA decreased, and Foxp3 mRNA increased in LIPUS-EVs compared with control-EVs mice (Figure 4A). Flow cytometry also revealed a significant decrease in the proportion of Th17 cells and an increase in the proportion of Treg cells in the LIPUS-EVs group (Figure 4B and C). Moreover, the LIPUS-EVs group produced more IL-10 and had lower IL-17A levels (Figure 4D). Therefore, LIPUS-EVs induced Treg subtype differentiation while inhibiting Th17 cell differentiation in vitro.
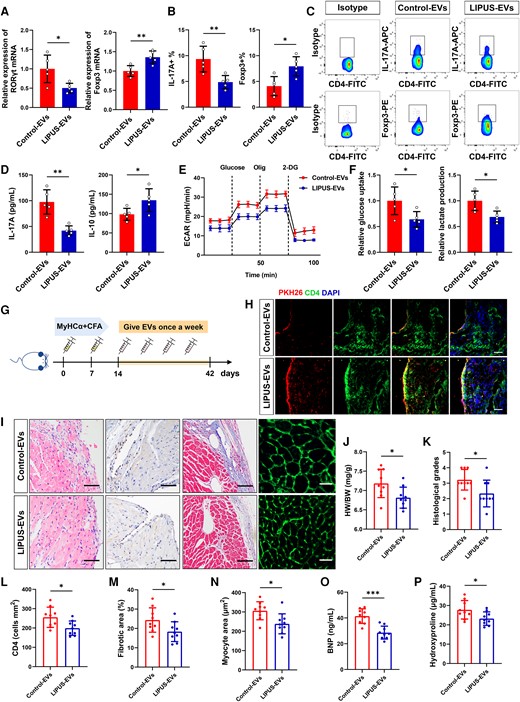
Functional validation of LIPUS-EVs in vitro and in vivo. (A) Levels of RORγt mRNA and Foxp3 mRNA expression in vitro by qPCR (RORγt: P = 0.0183; Foxp3:P = 0.0057, n = 5). (B, C) The percentages of Th17 cell (IL-17A+) and Treg cell (Foxp3+) were measured in vitro (IL-17A+: P = 0.0083; Foxp3+: P = 0.0104, n = 5). (D) The levels of IL-17A and IL-10 in CD4+ T cells were measured by ELISA (IL-17A: P = 0.0012; IL-10: P = 0.0401, n = 5). (E) The ECAR was measured over time from basal levels and followed by glucose, oligomycin, and 2-deoxy-D-glucose (2-DG) addition. (F) Cellular glucose uptake and lactate production were measured after EVs addition (glucose uptake: P = 0.0309; lactate production: P = 0.0129, n = 5). (G) Injection schedule. Mice were injected with MyHCα+CFA on day 0 and day 7. Then mice were given LIPUS-EVs and Control-EVs once a week and sacrificed on day 42. (H) Purified EVs were labelled with the PKH26 and injected into mice via the tail vein; the heart tissue was collected 12 h after the fourth injection (scale bar = 100 μm). The frozen heart sections were stained with CD4 antibody (red) and DAPI (blue). (J) HW/BW ratios were measured (P = 0.0278). (I, K) Results of H&E staining (scale bars = 100 μm; P = 0.0267). (I, L) CD4+ cell infiltration in the cardiac sections was analysed by immunohistochemistry (scale bars = 100 μm; P = 0.0182). (I, M) Results of masson staining (scale bars = 100 μm; P = 0.0414). (I, N) FITC-WGA staining of cardiomyocyte membrane (scale bars = 50 μm; P = 0.0101). (O) Levels of BNP in plasma of mice by ELISA (P = 0.0001). (P) Levels of hydroxyproline contents in plasma of mice by ELISA (P = 0.0348). (J–P, n = 9). Results are expressed as mean ± SD. Comparisons of parameters were performed with student's t-test. *P < 0.05; **P < 0.01; ***P < 0.001.
CD4+ T-cell glycolysis was then measured using the real-time extracellular acidification rate (ECAR). We found that incubating LIPUS-EVs significantly decreased the ECAR levels in T cells (Figure 4E). In addition, LIPUS-EVs reduced lactate production and glucose uptake, indicating a significant reduction in CD4+ T-cell glycolysis (Figure 4F). Overall, LIPUS-EVs regulated subtype differentiation and reduced glycolysis in CD4+ T cells.
3.5 Injection of LIPUS-EVs reduces global CD4+ T-cell activation and cardiac inflammation in mice
To explore whether LIPUS-EVs could directly modulate CD4+ T-cell function and protect against iDCM, equal amounts of LIPUS-EVs or control-EVs were injected intravenously into iDCM mice weekly (Figure 4G). We found PKH26-labelled EVs co-expression in CD4-positive regions. This confirmed EV uptake by cardiac CD4+ T cells (Figure 4H). A decreased number of total leukocytes and Th17 cells were observed in the LIPUS-EVs group, and the opposite was observed for Treg cells (see Supplementary material online, Figure S12A). Moreover, in the LIPUS-EVs mice, the relative expression of RORγt mRNA decreased, while Foxp3 mRNA expression increased (see Supplementary material online, Figure S12B). In addition, we found that the expression of HK2, mTOR, and PKM2 decreased in LIPUS-EVs mouse cardiac CD4+ T cells (see Supplementary material online, Figure S12C).
Furthermore, we assessed pathological changes in LIPUS-EVs-treated iDCM mice. Importantly, LIPUS-EVs mice had significantly lower histological scores, less CD4+ T-cell infiltration, reduced cardiac interstitial fibrosis and smaller cardiomyocyte area (Figure 4I and K–N). HW/BW was found to be significantly decreased in LIPUS-EVs mice compared with control-EVs mice (Figure 4J). In addition, in LIPUS-EVs-treated mice, plasma levels of BNP and hydroxyproline significantly decreased (Figure 4O and P). On day 42, it increased EF and FS in LIPUS-EVs mice compared with that in control-EVs mice (see Supplementary material online, Figure S13A–C). In contrast, left ventricular internal dimension in diastolic (LVIDd) and left ventricular internal dimension in systolic (LVIDs) were reduced in LIPUS-EVs mice (see Supplementary material online, Figure S13D and E). In addition, we depleted CD4+ T cells in the mice and further injected LIPUS-EVs. Surprisingly, the therapeutic effect of LIPUS-EVs disappeared (see Supplementary material online, Figure S14A–F), indicating that the therapeutic effect of LIPUS-EVs is dependent on CD4+ T cells. Moreover, EVs isolated from the control mice treated with LIPUS showed some effects of LIPUS-EVs that are similar, but not identical (see Supplementary material online, Figure S15A–J). In conclusion, these findings were consistent with those of in vitro assays, indicating that LIPUS-EVs injection could partially mimic the beneficial effects of LIPUS. ECs-derived EVs are responsible for LIPUS protection against iDCM progression and CD4+ T-cell differentiation.
3.6 EV cargo miR-99a regulated CD4+ T-cell differentiation and immunometabolism in vitro
To explore the therapeutic mechanisms of miR-99a, we co-cultured CD4+ T cells with LIPUS-EVs transfected with an inhibitor of miR-99a and performed a series of in vitro assays to determine whether increased cargo miR-99a in EVs is responsible for LIPUS regulating the immunometabolic status of CD4+ T cells. We found that the miR-99a inhibitor significantly reversed the regulatory effects of LIPUS-EVs on CD4+ T cells (Figure 5A–E). The transcription factor RORγt, percentage of Th17 cells, and cytokine expression levels of IL-17A in the LIPUS-EVs group were upregulated when the miR-99a inhibitor was used. However, Foxp3, IL-10, and Treg percentage showed the opposite trend (Figure 5A–C). Moreover, the attenuated glycolysis levels in T cells by LIPUS-EVs were reversed using the miR-99a inhibitor, as indicated by the measurement of lactate production and ECAR glucose uptake (Figure 5D and E). Overall, increased miR-99a expression in EVs regulates CD4+ T-cell immunometabolism and differentiation.
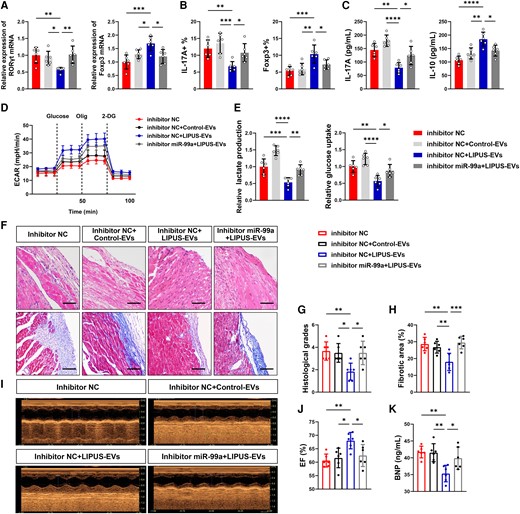
Functional validation of miR-99a in vitro and in vivo. (A–E) LIPUS-EVs were added to CD4+ T cells in the presence or absence of inhibitor miR-99a. (A) Levels of RORγt mRNA and Foxp3 mRNA expression in vitro by qPCR (RORγt: P = 0.0079 vs. inhibitor NC, P = 0.0377 vs. inhibitor NC + Control-EVs, P = 0.0054 vs. inhibitor NC + LIPUS-EVs; Foxp3: P = 0.0004 vs. inhibitor NC, P = 0.0433 vs. inhibitor NC + Control-EVs, P = 0.0121 vs. inhibitor NC + LIPUS-EVs). (B) The percentages of Th17 cell and Treg cell were assessed by flow cytometry in vitro (CD4+ IL-17A+: P = 0.0076 vs. inhibitor NC, P = 0.0006 vs. inhibitor NC + Control-EVs, P = 0.0473 vs. inhibitor NC + LIPUS-EVs; CD4+ Foxp3+: P = 0.0008 vs. inhibitor NC, P = 0.0026 vs. inhibitor NC + Control-EVs, P = 0.0434 vs. inhibitor NC + LIPUS-EVs). (C) The levels of cytokines, including IL-17A and IL-10 in CD4+ T cells, were measured by ELISA (IL-17A: P = 0.0001 vs. inhibitor NC, P < 0.0001 vs. inhibitor NC + Control-EVs, P = 0.0266 vs. inhibtor NC + LIPUS-EVs; IL-10: P < 0.0001 vs. inhibitor NC, P = 0.0016 vs. inhibitor NC + Control-EVs, P = 0.0106 vs. inhibitor NC + LIPUS-EVs). (D) The ECAR was measured over time from basal levels and followed by glucose, oligomycin, and 2-DG addition. (E) Cellular glucose uptake and lactate production were measured after EVs addition (glucose uptake: P = 0.0017 P < 0.0001 P = 0.0283; lactate production: P = 0.0007 P < 0.0001 P = 0.0064). (F–P) LIPUS-EVs were injected to iDCM mice in the presence or absence of miR-99a inhibitor. (F, G) Results of H&E staining (scale bars = 100 μm; P = 0.0080 vs. inhibitor NC, P = 0.0167 vs. inhibitor NC + Control-EVs, P = 0.0167 vs. inhibitor NC + LIPUS-EVs). (F, H) Results of masson staining (scale bars = 100 μm; P = 0.0013 vs. inhibitor NC, P = 0.0077 vs. inhibitor NC + Control-EVs, P = 0.0006 vs. inhibitor NC + LIPUS-EVs). (I, J) EF was measured using echocardiography. (P = 0.0054 vs. inhibitor NC, P = 0.0162 vs. inhibitor NC + Control-EVs, P = 0.0444 vs. inhibitor NC + LIPUS-EVs). (K) Levels of BNP in plasma of mice by ELISA (P = 0.0020 vs. inhibitor NC, P = 0.0027 vs. inhibitor NC + Control-EVs, P = 0.0304 vs. inhibitor NC + LIPUS-EVs). Results are expressed as mean ± SD; one-way ANOVA with Bonferroni post hoc test; *P < 0.05; **P < 0.01; ***P < 0.001; ****P < 0.0001.
3.7 miR-99a is a key component of LIPUS-EVs and exerts therapeutic effects of LIPUS in the iDCM mice
Previous studies have revealed that EVs play key functional roles in recipient cells via the transfer of miRNAs.17,20 To search for key miRNAs responsible for the therapeutic effects of LIPUS-induced EVs, we performed miRNA sequencing using the HCAECs. A total of 18 miRNAs with known functions differed in number after LIPUS irradiation. Of these, there were eight miRNAs associated with T-cell differentiation (see Supplementary material online, Figure S16A and B).21–24 We then validated these eight miRNAs in vitro: let-7f, let-7g, miR-143, miR-146a, and miR-99a were significantly increased in the EVs isolated from the HCAECs (see Supplementary material online, Figure S16C). We subsequently measured these five miRNAs in vivo and found that let-7g, miR-143, and miR-99a increased significantly after LIPUS irradiation in cardiac EVs (see Supplementary material online, Figure S16D). Among them, miR-99a showed the most significant difference. Using RNase A, we found that miR-99a expression in the culture medium remained constant. However, when cells were treated with RNase A and Triton X-100, miR-99a expression was significantly reduced. This indicated that miR-99a was encapsulated in the EVs and shielded by a double-layer membrane rather than being released directly (see Supplementary material online, Figure S16E).
Notably, the miR-99a injected mice had alleviated iDCM (see Supplementary material online, Figure S17A–C). Besides, a decreased number of total leukocytes and Th17 cells and a higher number of Treg cells were observed in the miR-99a group (see Supplementary material online, Figure S17D). Therefore, miR-99a could effectively relieve iDCM development and modulate CD4+ T-cell differentiation.
To further validate the function of miR-99a, we injected mice with EVs pre-treated with an inhibitor miR-99a or inhibitor NC. The attenuation of cardiac inflammation by LIPUS-EVs was reversed by the miR-99a inhibitor (Figure 5F and G). miR-99a inhibition abolished the protective effects of LIPUS-EVs against myocardial fibrosis (Figure 5F and H). We observed that after injecting LIPUS-EVs, EF improved; however, it deteriorated after the miR-99a inhibitor + LIPUS-EVs injection (Figure 5I and J). Plasma BNP levels were significantly higher in the miR-99a+ LIPUS-EVs inhibitor mice than in the NC+ LIPUS-EVs mice (Figure 5K). In addition, we used locked nucleic acid (LNA) anti-mir-99a and antagoMir-99a and obtained similar results (see Supplementary material online, Figures S18A–I and S19A–F). When we inhibited miR-99a, the therapeutic effect of LIPUS-EVs was attenuated.
In conclusion, increased miR-99a expression is a key player in LIPUS-EVs, alleviating iDCM cardiac remodelling and cardiac dysfunction.
3.8 hnRNPA2B1 and caveolin-1 co-mediate the loading of miR-99a to EVs in response to LIPUS
It has been reported that miRNAs are transported into EVs via hnRNPA2B1,25 we observed that hnRNPA2B1 was present in MAECs EVs and that it was upregulated when exposed to LIPUS (Figure 6A). In addition, LIPUS decreased nuclear and increased cytosolic levels of hnRNPA2B1 (Figure 6A and B), indicating hnRNPA2B1 translocation from the nucleus to the cytosol. The si-hnRNPA2B1 was then transfected into MAECs. Under normal conditions and LIPUS treatment, hnRNPA2B1 expression was effectively inhibited (Figure 6C). Additionally, the absence of hnRNPA2B1 prevented EVs-mediated miR-99a secretion and the observed induction in the presence of LIPUS (Figure 6D). Moreover, LIPUS promoted the binding of hnRNPA2B1 and miR-99a. Silencing hnRNPA2B1 reduced miR-99a binding (Figure 6E).
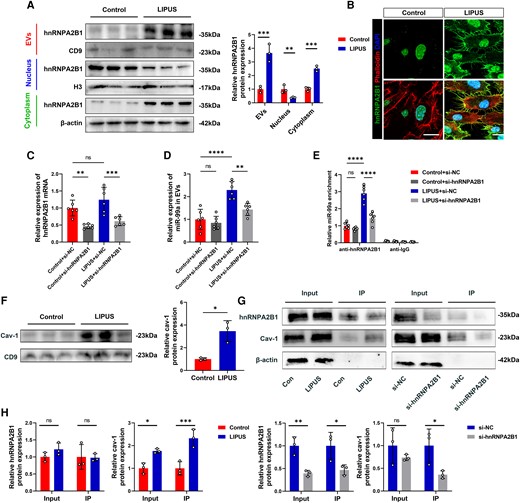
Caveolin-1 interacts with hnRNPA2B1 and traffics together into EVs in response to LIPUS. (A) EVs, nuclear, and cytoplasmic proteins were extracted after LIPUS treatment and subjected to Western Blot analysis (EVs: P = 0.0027; Nuclear: P = 0.0228; Cytoplasm: P = 0.0004, N = 3 independent repeats). (B) hnRNPA2B1 and phalloidin immunofluorescence staining observed under confocal microscope (scale bars = 10 μm). (C) Detection the effect of transfection of si-hnRNPA2B1 in MAECs (P = 0.0030 vs. Control + si-NC; P = 0.0006 vs. LIPUS + si-NC). (D) Detection of miR-99a expression in EVs after transfection with si-hnRNPA2B1 (P < 0.0001 LIPUS + si-NC vs. Control + si-NC; P = 0.0021 vs. LIPUS + si-NC). (E) Detection of miR-99a enrichment after the use of anti-hnRNPA2B1(P < 0.0001 LIPUS + si-NC vs. Control + si-NC; P < 0.0001 vs. LIPUS + NC). (F) Proteins were extracted after LIPUS treatment and subjected to Western Blot analysis (P = 0.0418). (G, H) The samples were immunoprecipitated (IP) with an anti-hnRNPA2B1 antibody (cav-1: Input: P = 0.0063; IP: P = 0.0095 vs. Control; IP: P = 0.0437 vs. si-NC; hnRNPA2B1: Input: P = 0.0072; IP: P = 0.0437 vs. si-NC) (F and H, N = 3 independent repeats; C-E, n = 6). Results are expressed as the mean ± SD; student's t-test (A, F, H) or one-way ANOVA with Bonferroni post hoc test (C, D, E).*P < 0.05; **P < 0.01; ***P < 0.001; ****P < 0.0001.
Caveolin-1, a major component of EVs, is involved in various protein trafficking pathways.26 Moreover, caveolin-1 is upregulated in ECs when exposed to LIPUS, modulating EC function.27 Caveolin-1 levels in EVs increased significantly in response to LIPUS, along with hnRNPA2B1 (Figure 6F). Following LIPUS therapy, the interaction between hnRNPA2B1 and caveolin-1 increased. However, deleting hnRNPA2B1 prevented caveolin-1 binding during LIPUS stimulation (Figure 6G and H). Therefore, LIPUS induces miR-99a trafficking into EVs by promoting nuclear translocation of hnRNPA2B1 and interacting with caveolin-1.
3.9 miR-99a modulates CD4+ T-cell differentiation and glycolysis by targeting mTOR and TRIB2
Subsequently, we investigated the downstream mechanism of miR-99a in regulating CD4+ T cells and metabolic reprogramming and differentiation. We found that 16 genes overlapped by combining the TargetScan, Tarbase, and microT databases. We focused on mTOR and TRIB2 because they are important in controlling T-cell function and autoimmune diseases.28,29 We used qPCR and Western Blotting to confirm that miR-99a overexpression could limit mTOR and TRIB2 expression in CD4+ T cells, with the opposite findings observed when miR-99a was inhibited (Figures 7A and B). Notably, after LIPUS treatment, the expression of mTOR and TRIB2 in iDCM mice decreased (Figure 7C). Also, the activation of the mTOR pathway was modulated with miR-99a treated (see Supplementary material online, Figure S20). The luciferase assay showed that treatment with the mimic miR-99a significantly reduced luciferase activity, whereas treatment with an inhibitor of miR-99a increased luciferase activity. Moreover, mTOR and TRIB2 mutant 3′ UTRs did not modify luciferase activity in response to the miR-99a mimic or inhibitor (Figure 7D).
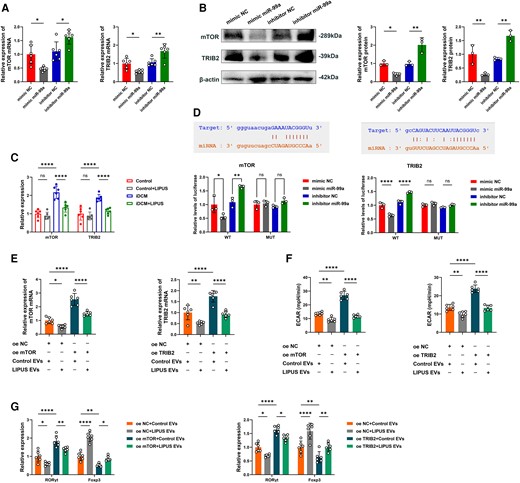
EVs miR-99a controls CD4+ T-cell inflammatory responses by targeting mTOR and TRIB2. (A) Relative mRNA expression of the target gene mTOR and TRIB2 in CD4+ T cells treated with mimic NC, mimic miR-99a, NC inhibitor, or miR-99a inhibitor (mTOR: P = 0.0160 vs. mimic NC; P = 0.0204 vs. inhibitor NC; TRIB2: P = 0.0419 vs. mimic NC; P = 0.0031 vs. inhibitor NC). (B) Representative blots showing protein expression of the target gene mTOR and TRIB2 in CD4+ T cells treated with mimic NC, mimic miR-99a, NC inhibitor, or miR-99a inhibitor (mTOR: P = 0.0481 vs. mimic NC; P = 0.0021 vs. inhibitor NC; TRIB2: P = 0.0091 vs. mimic NC; P = 0.0039 vs. inhibitor NC, N = 3 independent repeats). (C) Relative mRNA expression of mTOR and TRIB2 in CD4+ T cells before and after LIPUS treatment in Control and iDCM mice (mTOR: P < 0.0001 vs. Control; P < 0.0001 vs. iDCM; TRIB2: P < 0.0001 vs. Control; P < 0.0001 vs. iDCM). (D) The matched base pairs in the binding region of miR-99a and the reporter plasmids containing the wild-type mTOR and TRIB2. Relative luciferase reporter activity of vectors carrying the luciferase gene and a fragment of mTOR and TRIB2 3′UTR with wild- or inhibitor, or miR-99a inhibitor (mTOR WT: P = 0.0142 vs. mimic NC; P = 0.0018 vs. inhibitor NC; TRIB2 WT: P < 0.0001 vs. mimic NC; P < 0.0001 vs. inhibitor NC). (E) Relative mRNA expression of the target gene mTOR and TRIB2 in CD4+ T cells treated with transfected with mTOR or TRIB2 and incubated with EVs (mTOR: P = 0.0429 oe NC + LIPUS-EVs vs. oe NC + Control EVs; P < 0.0001 vs. oe mTOR + Control EVs; TRIB2: P = 0.0087 oe NC + LIPUS-EVs vs. oe NC + Control EVs; P < 0.0001 vs. oe mTOR + Control EVs). (F) ECAR was measured in CD4+ T cells treated with transfected with mTOR or TRIB2 and incubated with EVs (mTOR: P = 0.0028 oe NC + LIPUS-EVs vs. oe NC + Control EVs; P < 0.0001 vs. oe mTOR + Control EVs; TRIB2: P = 0.0019 oe NC + LIPUS-EVs vs. oe NC + Control EVs; P < 0.0001 vs. oe mTOR + Control EVs). (G) Levels of RORγt mRNA and Foxp3 mRNA expression in CD4+ T cells treated with transfected with mTOR or TRIB2 and incubated with EVs (mTOR RORγt: P = 0.0108 oe NC + LIPUS EVs vs. oe NC + Control EVs; P < 0.0001 oe mTOR + Control EVs vs. oe NC + Control EVs; P = 0.0036 oe mTOR + LIPUS EVs vs. oe mTOR + Control EVs; mTOR Foxp3: P < 0.0001 oe NC + LIPUS EVs vs. oe NC + Control EVs; P = 0.0021 oe mTOR + Control EVs vs. oe NC + Control EVs; P = 0.0307 oe mTOR + LIPUS EVs vs. oe mTOR + Control EVs; TRIB2 RORγt: P = 0.0338 oe NC + LIPUS EVs vs. oe NC + Control EVs; P < 0.0001 oe TRIB2 + Control EVs vs. oe NC + Control EVs; P = 0.0339 oe TRIB2 + LIPUS EVs vs. oe TRIB2 + Control EVs; TRIB2 Foxp3: P < 0.0001 oe NC + LIPUS EVs vs. oe NC + Control EVs; P = 0.0085 oe TRIB2 + Control EVs vs. oe NC + Control EVs; P = 0.0062 oe TRIB2 + LIPUS EVs vs. oe TRIB2 + Control EVs; A and C–G, n = 6). Results are expressed as the mean ± SD; one-way ANOVA with Bonferroni post hoc test; *P < 0.05; **P < 0.01; ****P < 0.0001.
LIPUS-EVs can reduce mTOR and TRIB2 expression. However, the expression of mTOR and TRIB2 was rescued by the overexpression plasmids (Figure 7E). We also observed that overexpression of mTOR and TRIB2 increased the ECAR levels in CD4+ T cells. But LIPUS-EVs can abrogate these effects (Figure 7F). Importantly, mTOR and TRIB2 reduced Treg cell counts while increasing Th17 cell counts, whereas LIPUS-EVs reversed these effects (Figure 7G). Thus, we determined that miR-99a directly targets mTOR and TRIB2. Through modulating mTOR and TRIB2, miR-99a controls the differentiation and glycolysis of CD4+ T cells.
4. Discussion
In this study, we found that LIPUS reduced myocardial fibrosis and improved cardiac remodelling in iDCM mice. LIPUS therapy also improved left ventricular function and structure in iDCM mice. These basic findings are consistent with previous study findings revealing that LIPUS can alleviate left ventricular remodelling,14,15 which is one of the main determinants of prognosis in iDCM.3 There is a similar pathogenesis in iDCM mice and patients. Although the initial triggers for human myocarditis and EAM differ, the transition to CD4+ T-cell-mediated autoimmune responses may sustain after eradication of the causative agent, which is a common feature of iDCM. There is substantial evidence to support that some forms of myocarditis and DCM in humans are caused by pathogenic autoimmune responses. Many patients with DCM have antibodies against a variety of cardiac antigens, particularly cardiac myosin. Therefore, the EAM mice model is considered the best mouse model to represent as much as possible the progression from myocarditis to iDCM.4 The similarity of iDCM model and DCM patients indicated that the LIPUS may be useful in improving the prognosis of patients in the clinic.
CD4+ T cells have been linked to the pathogenesis and progression of iDCM. Th17 cells promote iDCM progression by producing cytokines such as IL-17 and IL-21. In contrast, Treg cells slow the progression of iDCM by producing anti-inflammatory cytokines, including IL-10.30 The balance of effector and regulatory T cells (Teff/Treg balance) is disrupted in iDCM progression, putting the myocardium at risk. Th17 cells proliferate in cardiac tissues, but Treg cells, which regulate the immune response, are downregulated after iDCM.7,9,10 In this study, LIPUS did not seem to have a therapeutic effect on day 21. When we extended the treatment time, we found that LIPUS decreased the percentage of Th17 cells while increasing Treg cells in the cardiac tissues of iDCM mice, accompanied by lower IL-17A and higher IL-10 levels, indicating that LIPUS therapy has immune-regulatory effects in iDCM mice. Therefore, we suggest that long-term LIPUS therapy be used to delay disease progression in patients with DCM, as reported by other studies.15 Moreover, we hypothesized that the use of LIPUS would also be used to treat other CD4+ T cells dis-balanced caused autoimmune diseases, e.g. experimental autoimmune myositis,31 which is warranted in future studies. In addition, IL-17A is dispensable for myocarditis but essential for the progression to DCM.30 LIPUS decreases the differentiation of Th17; therefore, using LIPUS during the peak of inflammation may have minimal effect.
In recent years, the close relationship between the metabolism and function of CD4+ T cells has been highlighted in several autoimmune diseases, including iDCM.18 Our previous study found that glycolysis activation is linked to T-cell subtype differentiation, ultimately affecting the disease severity in iDCM mice.7 We observed decreased ECAR levels in cardiac CD4+ T cells after LIPUS therapy in this study. Therefore, we suggest LIPUS therapy to delay iDCM by CD4+ T-cell immune metabolic reprogramming.
LIPUS stimulated cells that are sensitive to mechanical vibrations, prompting them to produce EVs containing anti-inflammatory substances.16 EVs are sensitive to mechanical stimulation and important in intercellular communications through various paracrine and endocrine pathways.14,16 In this study, the number of EVs produced by ECs increased after LIPUS therapy. The EVs produced can then be internalised by CD4+ T cells, promoting CD4+ T-cell differentiation into anti-inflammatory Treg cells. More importantly, these EVs attenuated cardiac remodelling and cardiac inflammation in mice. These findings revealed the therapeutic role of LIPUS in iDCM mice by promoting EVs efflux.
Next, we explored the mechanism of EV-miRNA exocytosis in response to LIPUS stimulation. Recent research has revealed that miRNA-loaded EVs allow cells to communicate with one another.32 A study revealed that hnRNPA2B1 could regulate the loading of specific miRNAs into EVs.25 Following LIPUS treatment, we discovered a decrease in nuclear hnRNPA2B1 and an increase in cytoplasmic and EVs hnRNPA2B1. Caveolin-1 is a caveolae scaffolding protein that interacts with signalling proteins to regulate membrane trafficking. Membranous caveolin-1 can translocate hnRNPA2B1-bound miRNAs into EVs.19 Similarly, our findings showed that LIPUS modulates caveolin-1/hnRNPA2B1 to selectively promote the incorporation of specific miRNAs into budding epithelial EVs. Therefore, we explained how mechanical stimulation by LIPUS influences cellular and molecular signals involved in EV-miRNA trafficking. Besides, caveolin-1 is widely expressed in human cell types to exert diverse functions. For example, caveolin-1 is related to the homeostasis of Th17/Treg cells in respiratory inflammation. Downregulation of caveolin-1 was accompanied by an increase in Treg and a decrease in Th17 expression.33 Therefore, it may also be a key target for LIPUS in the treatment of other diseases.
We found that LIPUS promotes the efflux of EVs carrying relevant regulatory miRNAs as a key pathway for CD4+ T-cell differentiation and proliferation. EV-derived miRNAs alter gene expression and influence the functions of the recipient T cells.18 miR-99a is a metabolism- and immunity-related miRNA that has been linked to various cancers and immune cell regulation.34 Furthermore, miR-99a regulates T-cell differentiation.27 Our research also confirmed that EV-miR-99a is a key molecule involved in T-cell differentiation and suppresses cardiac inflammation of LIPUS therapy.
miRNAs regulate complex physiological processes by directing the expression of functional genes. The mTOR signalling cascade is crucial for T-cell homeostasis regulation.35 Inhibiting mammalian mTOR activity induces de novo FOXP3 expression or expands pre-existing natural Treg cells.36 Tribbles family proteins function as adaptors, connecting the MAPK pathway to C/EBP transcriptional control. Upregulation of TRIB2 in the tribbles family is a potential pro-inflammatory pathway linked to autoimmune disorders.37 Our bioinformatics research consistently revealed that mTOR and TRIB2 were miR-99a targets in CD4+ T cells. We discovered that miR-99a suppressed the expression of mTOR and TRIB2 and altered the glycolytic process of T cells by regulating the above-mentioned genes. Ultimately, it affected the differentiation of T cells and altered the disease process. mTOR and TRIB2 have been consistently identified as miR-99a targets in CD4+ T cells based on our bioinformatics research. We found that miR-99a suppresses the expression of mTOR and TRIB2 and alters the glycolytic process of T cells by regulating the genes, as mentioned above. Ultimately, this affects T-cell differentiation and alters disease processes.
Shock wave therapy (SWT), which applies pulses of energy into a fluid environment and then propagates the harnessed energy until it meets the target tissue, is also a physiotherapy strategy. Both SWT and LIPUS are commonly used in rehabilitation medicine. A previous study found that SWT can also stimulate the production of reparative EVs in mice with ischaemic heart disease.38 Although the physical properties of these two waves are different, the mechanisms of action have many similarities. It can be said that cardiovascular physical therapy has great prospects. There are now several LIPUS-related clinical studies, mainly in the direction of opening the blood–brain barrier, stimulating the growth of bone and soft tissue repair, and stimulating nerves. In this study, the power was tightly controlled and no additional damage was observed. In addition, LIPUS irradiation was precisely targeted to the heart, with minimal systemic side effects. All these prove that LIPUS is a non-invasive, effective, and convenient treatment.
This study has some limitations that should be acknowledged. First, we confirmed the efficacy of LIPUS therapy over a 28-day treatment period. Longer therapeutic periods and improved therapy parameters will likely result in improved efficacy. Second, cardiac immunomodulation in iDCM mice is very complex. Though CD4+ T cells are identified as critical drivers for iDCM development, and we focused on CD4+ T cells in this study, it cannot completely explain how LIPUS alleviates iDCM. Third, the LIPUS-induced EC-Cav-1/hnRNPA2B1-EV-miR-99a-CD4+ T-cell inhibition pathway was identified in this study. It should be admitted that the impact of LIPUS on disease may be multifaceted. We have revealed one of the important potential mechanisms of iDCM in this study. Since the critical role of LIPUS on remission of iDCM is elucidated. The complex underlying mechanism should be further be exploited in the future. Finally, it is necessary to use knockout mice to elucidate the molecular mechanism of LIPUS.
In conclusion, we revealed that LIPUS is a promising therapeutic modality for iDCM. LIPUS stimulates ECs to produce EVs, which are internalised by CD4+ T cells to induce immune and metabolic reprogramming. LIPUS induces the selective carriage of miR-99a in EVs and directly inhibits mTOR and TRIB2, suppressing CD4+ T-cell inflammatory responses. We also revealed that miR-99a is loaded into EVs in ECs via hnRNPA2B1 and caveolin-1 binding. Our findings demonstrated that LIPUS therapy attenuated cardiac inflammation and remodelling in iDCM mice. This finding may provide a new non-invasive, nonpharmacological therapy for patients with iDCM, guide clinical treatment, and improve prognosis.
Our results show that iDCM progression can be improved after irradiation with LIPUS. The LIPUS-treated mice had improved cardiac function and structure. On a molecular level, LIPUS promotes the secretion of miR-99a-carrying EVs from the endothelial cells to affect the differentiation and proliferation of CD4+ T cells. In patients with myocarditis, performing LIPUS irradiation may be a novel non-invasive and nonpharmacological therapeutic approach to prevent further iDCM progression and improve the quality of prognosis.
Supplementary material
Supplementary material is available at Cardiovascular Research online.
Authors’ contributions
P.S., M.Z., X.L., and J.T. conceived and designed the experiments. P.S., Y.L., YF.L., H.J., M.G., and S.F. performed most experiments. P.S., Y.L., YF.L., H.J., and M.Z. wrote the manuscript. S.C. provided LIPUS technological support. P.S., S.J., X.W., Z.T., C.W., P.W., F.G., S.C., Y.L., and P.Z. analysed the data. The authors agree to be responsible for the content of the work.
Acknowledgements
We thank SXULTRASONIC Ltd. Kerry Rehabilitation Medicine Research Institute (Shenzhen) team for excellent technological support of LIPUS.
Funding
This work was supported by the National Natural Science Foundation of China (grant number 82102068 to P.S., grant number 82270525 to M.Z., grant number U22A20346 to X.L.). Postdoctoral Fellowship Program of CPSF under (grant number GZB20230184 to P.S.). China Postdoctoral Science Foundation (grant number 2023M740944 to P.S.). Heilongjiang Province Key research and Development Plan Project (grant number GA21D007 to X.L.). The Natural Science Foundation of Heilongjiang Province (grant number YQ2020H016 to M.Z.).
Data availability
All data generated or analysed during this study are included in this published article and its Supplementary information.
References
Author notes
Ping Sun, Yi Li, Yifei Li and Huan Ji contributed equally.
Conflict of interest: none declared
