


Abstract
To investigate the predictive ability of direct plasma renin and aldosterone concentrations as well as their ratio [aldosterone-to-renin (ARR)] for incident hypertension in the general population.
Concentration of renin and aldosterone were measured by a chemiluminescence immunoassay using the fully automated LIAISON® platform (DiaSorin) among 5362 participants of the population-based Gutenberg Health Study, who were normotensive and had no clinically overt cardiovascular disease at baseline. During a follow-up period of 5 years, 18.6% (n = 996) developed a new-onset hypertension. Comparing extreme quartiles of biomarker distribution, the relative risk (RR) for incident arterial hypertension was found to be 1.58 [95% confidence interval (CI) 1.25–2.00; P = 0.00015; Q1 vs. Q4ref] for renin; 1.29 (95% CI 1.05–1.59, P = 0.018; Q4 vs. Q1ref) for aldosterone and 1.70 (95% CI 1.33–2.12; P < 0.0001; Q4 vs. Q1ref) for ARR after multivariable adjustment in men. In females, only high ARR was independently predictive for incident hypertension over 5 years [RR 1.29 (95% CI 1.04–1.62); P = 0.024]. Even in the subgroup of individuals having biomarker concentrations within the reference range, high ARR was predictive for new-onset hypertension in men [RR 1.44 (95% CI 1.13–1.83); P = 0.003]. Finally, synergistic effects of co-prevalent obesity and ARR on incident hypertension were also demonstrated, resulting in markedly higher risk estimates as seen for biomarker alone [RR of 2.70 (95% CI 2.05–3.6) for Q4 of ARR and having body mass index ≥ 30 kg/m2 vs. low ARR (Q1ref) and normal weight; P < 0.0001].
Among normotensives from the general population ARR possesses a stronger predictive value for incident hypertension than renin or aldosterone alone. The prediction of arterial hypertension by ARR was even stronger in obese subjects.
1. Introduction
The renin–angiotensin–aldosterone system (RAAS) plays a fundamental role in the development of cardiovascular disease (CVD) and arterial hypertension in particular. Pharmacological interventions modulating the RAAS activity have become a leading therapeutic strategy in CVD management over the past decades.1 Although RAAS represents a key regulator of body fluid, electrolyte and blood pressure (BP) homeostasis,1 only a limited number of population-based epidemiological studies estimated the predictive ability of aldosterone,2–4 renin,3–5 and the aldosterone-to-renin ratio (ARR)3,5 for incident hypertension. Furthermore, no sex-specific data exist in this context, although both aldosterone and renin have been demonstrated to possess distinct sex-specific interactions.6
One potential limitation of wide-spread use of RAAS biomarkers during the last years was related to several analytical challenges in renin and aldosterone measurements.7–9 For instance, renin is also strongly dependent on the angiotensinogen concentration, therefore being not reliably applicable during pregnancy, glucocorticoid excess, liver disease, adrenal insufficiency, heart failure, or use of various antihypertensive medications.10 In case of aldosterone, there is still considerable inter-method variability, with higher values obtained from the immunoassays11 than those from the liquid chromatography–tandem mass spectrometry (LC-MS/MS), which represent a gold standard method for aldosterone measurement to date. In addition, there are several pre-analytical issues, which should be taken into account to quantify aldosterone precisely.
The aim of the present analysis was to investigate sex-specifically a predictive value of aldosterone, direct renin concentration and ARR, determined by a fully automated chemiluminescence immunoassay (CLIA) for incident hypertension in the general population. Further aims were to evaluate whether these biomarkers remain predictive for new-onset hypertension even within their reference ranges or whether prognostic assessment of hypertension risk by RAAS biomarkers might be modulated by co-prevalence of traditional cardiovascular risk factors (CVRFs) such as e.g. obesity.
2. Methods
2.1 Study design
The Gutenberg Health Study (GHS) is an age-, sex-, and residence stratified, prospective, population-based, single-centre cohort study. The study sample was drawn randomly from the governmental local registry offices in the city of Mainz and the district of Mainz-Bingen, Germany. Between 2007 and 2012, a total of 15 010 participants aged 35–74 years were enrolled to the GHS. The study was approved by the local ethics committee and the data safety commissioner before study initiation and is in accordance with the principles outlined in the declaration of Helsinki. Participation was voluntary and written informed consent was obtained from each subject upon entry into the study. Details of the study design have been reported elsewhere.12
2.2 Data assessment and follow-up
A total of 12 423 participants attended the follow-up investigation at the study centre 5 years after enrolment (between 2012 and 2017) (Figure 1). Individuals with prevalent arterial hypertension [defined as mean systolic blood pressure (SBP) of ≥140 mmHg and/or a mean diastolic blood pressure (DBP) of ≥90 mmHg or intake of antihypertensive drugs] at baseline as well as subjects using BP lowering medications at baseline were excluded from the present analysis. Further exclusion criteria were: prevalent CVD [defined as history of myocardial infarction (MI), coronary artery disease, congestive heart failure, atrial fibrillation or stroke] at baseline as well as missing data on analysis-relevant covariates at baseline and at the index examination. That resulted in a total sample of 5362 normotensive individuals at baseline without clinically apparent CVD (2417 men/2945 women) (Figure 1).
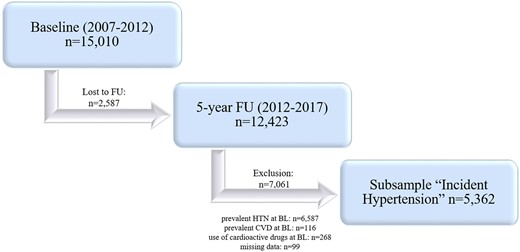
Study design. BL, baseline; CVD, cardiovascular disease; FU, follow-up; HTN, hypertension. Prevalent hypertension: SBP ≥140 mmHg and/or DBP ≥90 mmHg or anti-HTN drug intake. Prevalent CVD: myocardial infarction, coronary heart disease, congestive heart failure, atrial fibrillation, and stroke.
2.3 Blood pressure measurements and outcome definition
At physical examination, brachial SBP and DBP were measured at Omron 705CP-II (Japan) after at least 5 min of rest on the left arm of the seated participant. At least three consecutive BP measurements were undertaken. To identify possible BP differences between two arms, the first measurement was carried out on the right and left arm simultaneously. For the analysis, averaged values of the 2nd and 3rd standardized measurements after 8 and 11 min of rest were used to avoid a white-coat hypertension effect.
The same standardized protocol and device were used at the follow-up examinations 5 years later. Incident arterial hypertension was defined as mean SBP ≥140 mmHg or DBP ≥90 mmHg or both and/or intake of anti-hypertensive drugs at follow-up visit.
2.4 Data collection, definition of cardiovascular risk factors and diseases
Aspects of data collection and definitions of CVRFs and diseases have been reported previously.12,13 For additional details and information, please see the Supplementary material online.
2.5 Laboratory methods
Venous blood was drawn under standardized conditions after an overnight fasting period in a sitting position. All samples were immediately stored at −80°C after blood draw until further analysis. All routine laboratory parameters were determined by standard methods in the central laboratory of the University Medical Center Mainz.
Details on determination of direct plasma renin and plasma aldosterone concentrations have been reported earlier.12 Briefly, direct renin and aldosterone concentrations were measured by CLIA using fully automated LIAISON® platform (DiaSorin, Dietzenbach, Germany). To avoid a cryoactivation of prorenin, all samples were thawed at 37°C and immediately processed for the analysis. According to the manufacturer’s instructions the analytical range for renin was 1.96–500 μU/mL and for aldosterone 1.91–100 ng/dL. The inter-assay coefficients of variation (CVs) (n = 75) of aldosterone measurements were 13.2% at 7.1 ng/dL and 7.8% at 29.6 ng/dL using manufacturer-provided control aldosterone plasma samples at high and low concentration, as well as 9.7% at 11.6 ng/dL by ‘in-house human’ plasma pool. For direct renin, corresponding inter-assay CVs were 7.8% at 21.0 µU/mL, 7.7% at 100.6 µU/mL and 11.0% at 14.9 µU/mL. The intra-assay CVs (n = 20) were for aldosterone 2.4–3.9% at 28.8 ng/dL, 2.9–6.3% at 11.1 ng/dL and for renin 2.8–3.6% at 94.3 µU/mL, 4.1–5.3% at 15.4 µU/mL. All analyses were run in a blinded fashion.
2.6 Statistical analysis
The present analysis was conducted sex-specifically. Continuous variables were reported by means with standard deviation or median values with 25th/75th percentiles (interquartile range), where appropriate.
Multivariable-adjusted poisson regression analysis was carried out to evaluate the predictive role of baseline renin, aldosterone, and ARR for incident hypertension. All biomarkers were analysed as categorical variables in sex-specific quartile (Q) of their distribution. For aldosterone and ARR, Q1 served as a referent quartile; for renin Q4 was used as a reference. Results are reported as relative risk (RR) with 95% confidence intervals (CIs). A basic model was adjusted for age only. In the second model CVRFs (i.e. smoking, diabetes mellitus, obesity, dyslipidaemia, family history for MI/stroke) and estimated glomerular filtration rate (eGFR) were taken into account. In females, additional adjustment for sex-specific confounders [i.e. information on menopausal status, intake of oral contraceptives and hormone replacement therapy (HRT)] was done. For aldosterone and renin, a third model was calculated with additional adjustment for renin if aldosterone was used for the analysis and vice versa. This analysis was further repeated after exclusion of subjects with biomarkers’ values lying outside the reference limits. Age and sex-specific reference limit was defined on the basis of our previous analysis12 as a 95th percentile of biomarkers’ distributions among subjects with low cardiovascular risk (i.e. in those without traditional CVRFs and/or prevalent CVD) and after exclusion of hypokalaemia (<3.5 mmol/L), renal insufficiency (eGFR <60 mL/min), cancer, and intake of analyte modifying medications.13
To investigate a synergistic effect of ARR and co-prevalence of CVRFs and obesity in particular on the risk of future hypertension, combined variables were created. Subjects were classified into 12 categories according to quartiles of ARR distribution and body mass index (BMI) groups [normal weight (BMI of <25 kg/m2), overweight (BMI ≥25/<30 kg/m2), obesity (BMI ≥ 30 kg/m2)]. Due to small sample size within the investigated subgroups, no sex-specific analysis was done to ensure an adequate statistical power. Those with normal weight and lowest quartiles of aldosterone/ARR or upper renin quartile were chosen as a reference group.
Due to the explorative nature of the study, a threshold of statistical significance was not defined and P-values should therefore be interpreted as a continuous measure of statistical evidence, with lower values reflecting stronger association. All statistical analyses were performed using R version 3.14.2 software (http://www.r-project.org).
3. Results
Overall, 5362 normotensive GHS-participants were included in the present analysis. The baseline characteristics of the study population are summarized in Table 1. The mean age of the study sample was 49.5 (±9.9) years; 54.9% of study participants were women. In general, males demonstrated higher values of SBP (Δ5.7 mmHg) and DBP (Δ3.3 mmHg) at baseline than females. Plasma aldosterone at baseline was found to be 7.30 (5.57/9.62) ng/dL (median (Q1/Q3)), with only marginal differences between sexes. In contrast, renin concentration differed between men and women with the median values of 13.60 (8.40/20.50) µU/mL in males vs. 8.90 (5.10/14.10) µU/mL in females. Consequently, ARR was approximately 1.6-fold higher in women as compared to men (Table 2).
Baseline demographic and clinical characteristics of the study participants (n = 5362)
| Men | Women | |
|---|---|---|
| (n = 2417) | (n = 2945) | |
| Age, years | 49.5 ± 10.0 | 49.5 ± 9.8 |
| BMI, kg/m2 | 25.8 (23.8/28.1) | 24.0 (21.8/26.9) |
| Heart rate, b.p.m. | 66.0 ± 9.7 | 69.0 ± 9.3 |
| Systolic BP, mmHg | 126.3 ± 11.2 | 120.6 ± 13.2 |
| Diastolic BP, mmHg | 80.1 ± 7.6 | 76.8 ± 7.8 |
| Diabetes mellitus, % | 3.1 | 2.1 |
| Obesity, % | 12.9 | 11.6 |
| Smoking, % | 24.2 | 20.3 |
| Dyslipidaemia, % | 30.7 | 14.5 |
| FH of MI/stroke, % | 18.0 | 19.4 |
| Prevalent CKD,a % | 0.7 | 1.5 |
| HRT, % | – | 6.2 |
| OC intake, % | – | 8.5 |
| Menopause, % | – | 49.6 |
| eGFR, mL/min/1.73m2 | 94.8 ± 12.0 | 91.3 ± 12.6 |
Data are expressed as mean ± standard deviation (SD) or medians (Q1/Q3).
b.p.m., beats per minute; BMI, body mass index; BP, blood pressure; CKD, chronic kidney disease; eGFR, estimated glomerular filtration rate; FH, family history; HRT, hormone replacement therapy; MI, myocardial infarction; OC, oral contraceptives.
Medical records.
Sex-specific distribution of renin, aldosterone, and aldosterone-to-renin ratio at baseline
| Total study sample | Subjects with incident hypertensiona | Event-free subjects | |
|---|---|---|---|
| (n = 5362) | (n = 996) | (n = 4366) | |
| Direct renin concentration (µU/mL) | |||
| Men | 13.60 (8.40/20.50) | 11.60 (7.10/18.21) | 14.20 (8.80/21.00) |
| Women | 8.90 (5.10/14.10) | 7.50 (4.29/12.62) | 9.10 (5.30/14.30) |
| Aldosterone concentration (ng/dL)b | |||
| Men | 7.09 (5.45/9.33) | 7.10 (5.58/9.51) | 7.09 (5.40/9.28) |
| Women | 7.47 (5.67/9.80) | 7.34 (5.64/9.48) | 7.50 (5.69/9.85) |
| Aldosterone-to-renin ratio (ng/dL/µU/mL) | |||
| Men | 5.38 (3.52/8.62) | 6.35 (4.10/10.36) | 5.14 (3.34/8.05) |
| Women | 8.58 (5.45/14.34) | 9.64 (5.78/17.28) | 8.42 (5.41/13.82) |
Data are expressed as medians with their interquartile ranges.
Five-year incident hypertension 18.6%: men: 21.8% (n = 526), women: 16.0% (n = 470).
Conversion factor to SI units (pmol/L) is 27.74.
During the 5-year follow-up period, 18.6% (n = 996) of the study participants [men: 21.8% (n = 526), women: 16.0% (n = 470)] developed incident hypertension. Subjects with incident hypertension demonstrated markedly lower renin and higher ARR values at baseline, similarly for both sexes (Table 2). Differences in aldosterone concentration between subjects with and without incident hypertension were only marginal.
The prognostic role of biomarkers for new-onset hypertension was analysed sex-specifically by regression analyses. In men, an inverse association between direct renin concentration and incident hypertension was observed. Low renin levels (first quartile of renin distribution, Q1) were associated with a 58% increased risk for the development of hypertension compared to high renin concentration (fourth quartile of renin distribution, Q4) in a multivariable model adjusted for age, traditional CVRFs, eGFR, and aldosterone (Table 3). Aldosterone, in contrast, was only moderately predictive for new-onset hypertension, both in the age-adjusted model as well as after multivariable adjustment for potential confounders including renin. For ARR, the RR for incident hypertension comparing extreme quartile of biomarker distribution (Q4 vs. Q1ref) was found to be 1.70 (95% CI 1.33–2.12; P = <0.0001) in the fully adjusted model.
Sex-specific risk of incident hypertension by concentration of direct renin, aldosterone, and aldosterone-to-renin ratio
| Adjustment for age | Additional adjustment for traditional CVRFa, eGFR and hormonal statusb (where applicable) | Additional adjustment for concentration of aldosterone or renin, respectivelyc (where applicable) | ||||
|---|---|---|---|---|---|---|
| Relative risk (95% CI) | P-values | Relative risk (95% CI) | P-values | Relative risk (95% CI) | P-values | |
| MEN | ||||||
| Direct renin concentration | ||||||
| Per 1 SD | 0.83 (0.78–0.88) | <0.0001 | 0.84 (0.79–0.89) | <0.0001 | 0.82 (0.78–0.88) | <0.0001 |
| Q1 | 1.49 (1.20–1.87) | 0.00041 | 1.49 (1.19–1.86) | 0.00054 | 1.58 (1.25–2.00) | 0.00015 |
| Q2 | 1.30 (1.04–1.64) | 0.023 | 1.29 (1.03–1.62) | 0.030 | 1.35 (1.07–1.71) | 0.013 |
| Q3 | 1.05 (0.83–1.34) | 0.68 | 1.05 (0.82–1.34) | 0.71 | 1.08 (0.84–1.38) | 0.55 |
| Q4REF | – | – | – | – | – | – |
| Aldosterone concentration | ||||||
| Per 1 SD | 1.05 (0.97–1.12) | 0.22 | 1.02 (0.95–1.10) | 0.57 | 1.08 (0.99–1.16) | 0.061 |
| Q1REF | – | – | – | — | – | – |
| Q2 | 1.26 (1.02–1.56) | 0.031 | 1.26 (1.02–1.56) | 0.032 | 1.29 (1.05–1.59) | 0.018 |
| Q3 | 1.08 (0.86–1.35) | 0.50 | 1.05 (0.84–1.32) | 0.66 | 1.13 (0.90–1.42) | 0.30 |
| Q4 | 1.22 (0.98–1.51) | 0.081 | 1.14 (0.91–1.42) | 0.26 | 1.28 (1.02–1.60) | 0.031 |
| Aldosterone-to-renin ratio | ||||||
| Per 1 SD | 1.22 (1.15–1.30) | <0.0001 | 1.20 (1.13–1.28) | <0.0001 | ||
| Q1REF | – | – | – | – | – | – |
| Q2 | 1.31 (1.02–1.69) | 0.032 | 1.27 (0.99–1.63) | 0.066 | – | – |
| Q3 | 1.48 (1.17–1.89) | 0.0013 | 1.44 (1.13–1.83) | 0.0030 | – | – |
| Q4 | 1.76 (1.39–2.22) | <0.0001 | 1.70 (1.33–2.12) | <0.0001 | – | – |
| WOMEN | ||||||
| Direct renin concentration | ||||||
| Per 1 SD | 0.88 (0.81–0.95) | 0.0017 | 0.88 (0.81–0.95) | 0.0015 | 0.88 (0.81–0.95) | 0.0014 |
| Q1 | 1.32 (1.02–1.70) | 0.034 | 1.33 (1.03–1.72) | 0.030 | 1.04 (0.82–1.31) | 0.77 |
| Q2 | 0.97 (0.74–1.28) | 0.84 | 0.98 (0.74–1.30) | 0.89 | 0.98 (0.78–1.24) | 0.86 |
| Q3 | 0.95 (0.72–1.25) | 0.71 | 0.97 (0.73–1.27) | 0.80 | 0.87 (0.68–1.11) | 0.26 |
| Q4REF | – | – | – | – | – | – |
| Aldosterone | ||||||
| Per 1 SD | 0.98 (0.90–1.07) | 0.70 | 0.99 (0.90–1.08) | 0.75 | 1.03 (0.93–1.13) | 0.59 |
| Q1REF | – | – | – | – | – | – |
| Q2 | 1.01 (0.81–1.26) | 0.94 | 1.00 (0.81–1.25) | 0.98 | 1.03 (0.82–1.28) | 0.83 |
| Q3 | 1.03 (0.82–1.28) | 0.80 | 0.99 (0.79–1.24) | 0.95 | 1.04 (0.83–1.30) | 0.75 |
| Q4 | 0.99 (0.79–1.25) | 0.94 | 0.99 (0.78–1.25) | 0.90 | 1.08 (0.85–1.37) | 0.55 |
| Aldosterone-to-renin ratio | ||||||
| Per 1 SD | 1.12 (1.04–1.22) | 0.0041 | 1.13 (1.04–1.22) | 0.0026 | ||
| Q1REF | – | – | – | – | – | – |
| Q2 | 0.95 (0.75–1.21) | 0.69 | 1.01 (0.80–1.29) | 0.93 | – | – |
| Q3 | 0.93 (0.75–1.19) | 0.55 | 0.97 (0.76–1.24) | 0.82 | – | – |
| Q4 | 1.25 (1.00–1.56) | 0.054 | 1.29 (1.04–1.62) | 0.024 | – | – |
CI, confidence interval; CVRFs, cardiovascular risk factors; eGFR, estimated glomerular filtration rate; Q, quartile; REF, reference; SD, standard deviation.
Cardiovascular risk factors include smoking, diabetes, obesity, dyslipidaemia, family history for MI/stroke.
Hormonal status includes menopausal status and OC/HRT intake (in females only).
Additionally adjusted for renin if aldosterone used as independent variable and vice versa.
In contrast, among females neither renin nor aldosterone were predictive for the development of hypertension. Only high ARR values were borderline associated with incident hypertension with a RR of 1.29 (95% CI 1.04–1.62; P = 0.024) after multivariable adjustment.
Subgroup analysis of subjects with biomarkers’ concentrations within the reference ranges revealed that the top quartile of ARR distribution in men still possessed predictive ability for incident hypertension with ∼40% increased risk compared to the referent group [RR 1.44 (95% CI 1.13–1.83), P = 0.0030] (Supplementary material online, Table S1).
Finally, we were interested whether assessment of hypertension risk using RAAS biomarkers might be modulated by co-prevalence of traditional CVRFs and obesity in particular. Combination of both obesity and the highest ARR quartile was associated with approximately 2.7-fold increased risk for new-onset hypertension [RR 2.70 (95% CI 2.05–3.60); fully adjusted model; P < 0.0001] compared to the subjects with normal weight and low ARR (reference). For instance, being obese and having low ARR values (i.e. Q1 of ARR distribution) resulted in a RR for incident hypertension of 1.68 (95% CI 1.16–2.44; P = 0.0065) (Figure 2, exemplary for ARR, combined analysis for both sexes together). Again, the weaker synergistic effects with obesity were seen if renin or aldosterone were considered separately. So, for presence of obesity and low renin values (i.e. Q1), a RR for new-onset hypertension was found to be 2.35 (95% CI 1.75–3.15); fully adjusted model; P < 0.0001, compared to the subjects with normal weight and high renin concentration (reference). In case of aldosterone, being obese and having high aldosterone values (Q4) was associated with approximately 2.2-fold increased risk of hypertension development [RR 2.22 (95% CI 1.70–2.91) in fully adjusted model; P < 0.0001] compared to the subjects who were lean and had low (Q1) aldosterone values at baseline (data not shown).
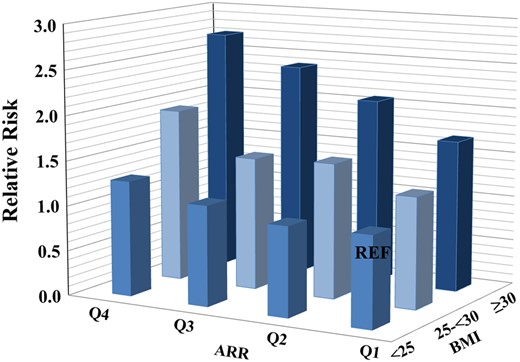
Synergistic effects of aldosterone-to-renin ratio and body weight on incident hypertension. n = 5362. ARR, aldosterone-to-renin ratio; BMI, body mass index; Q, quartile; REF, reference.
4. Discussion
Among normotensive men and women from the general population ARR possesses a much stronger predictive value for the development of hypertension within a 5-year period than renin or aldosterone alone. More importantly, high ARR values remained predictive for new-onset hypertension among male subjects with biomarker concentrations within the reference range. Finally, the present data demonstrated a strong synergistic effect of co-prevalence of obesity and high ARR, resulting in the highest (almost three-fold increased) risk for new-onset hypertension in a primary prevention setting.
The current study represents the first and largest population-based investigation so far examining the role of the renin–aldosterone system in the development of hypertension among normotensive subjects at baseline. More importantly, no sex-specific data exist so far on such relationship, although aldosterone and especially renin possesses important sex-specific interactions.6 Only one recently published study by Yang et al.14 raised this important issue showing a sex-specific association between ARR and BP in adolescents and young adults.
Although ARR has been revealed as strongest predictor in the present analysis, the importance of low renin concentration in early onset of hypertension should not be underestimated, especially when considering that low renin rather than high aldosterone might be a key determinant of the ARR-associated increased risk of future hypertension. Unfortunately, the exact pathophysiological mechanism, which might lead to significant decrease in renin concentration, could not be elucidated within the present analysis. The possible triggers of such low-renin state might be an expansion of circulating volume as a consequence of high salt intake or even sodium retention due to relative aldosterone excess (i.e. aldosterone values within the normal range, being however inappropriately elevated in relation to low renin concentration). However, whether a low-renin profile is a consequence of increased overall volume status or represents an isolated pathophysiological condition,15 leading to hypertension development is still unknown and should be matter of further investigations.
To date, only limited number of studies2–5 considered RAAS biomarkers at baseline as the strong predictors of BP progression and incident hypertension in the general population. The main evidence on the relation of RAAS biomarkers to longitudinal changes in BP and new-onset hypertension came from the Framingham cohort,2,5 where higher aldosterone2 and ARR5 values at baseline were demonstrated as the independent predictors of BP progression and incident hypertension in multivariable analysis. The association between RAAS biomarkers and incident hypertension was further confirmed by a nested case-control study of 1984 French non-hypertensive volunteers, who followed for 5 years.3 Again, ∼20% increase in the odds of developing hypertension on follow-up has been seen for aldosterone and ARR per 1 SD increment in biomarker.3 The decreased renin concentration was independently related to BP progression5 but demonstrated only borderline significance for new-onset hypertension.3,5 More recently, however, Brown et al.4 have demonstrated a higher incidence rate of new-onset hypertension among Multi-Ethnic Study of Atherosclerosis (MESA) participants with suppressed renin phenotype compared to those with indeterminate and unsuppressed renin concentration. Interestingly, high aldosterone concentration was predictive for future hypertension only in the setting of low renin concentration.4
The results of the present analysis confirmed an importance of increased ARR for hypertension development3,5 and surprisingly demonstrated a slight discrepancy with regard to the predictive values of aldosterone and renin, as seen by other investigations earlier,2,5 which might be related to the differences in study design as well as to the method, used for renin/aldosterone assessment. Indeed, only a moderate relation of aldosterone to incident hypertension was seen within the present analysis. However, in combination with overweight or obesity increased aldosterone concentration at baseline was related to hypertension onset. That observation was at least in part in line with a study by Vasan et al.,2 who investigated rather overweight subjects at baseline. In general, obesity represents a powerful risk factor for incident hypertension16 and activation of RAAS is considered so far as one of the meaningful underlying mechanism linking obesity to hypertension.17 Obesity-related dysfunction of adipose tissue results in secretion of several aldosterone-releasing factors,18 thereby promoting aldosterone production by the adrenal cortex. Furthermore, a local aldosterone production by adipocytes has been also reported.19
Within the present analysis, additional estimation of the ARR in obese subjects significantly improved the ability to estimate future risk of hypertension. Thus, a higher RR for the incidence of hypertension was revealed for the combination of both predictors compared to the single parameter, where RR increased from 1.5 to 1.7 for a single parameter (i.e. for hypertension predicted by obesity or by the top quartile of ARR only) to 2.7 for their combination. The observed effect of obesity and increased ARR for hypertension prediction emphasizes that such subjects might be at greatest risk for new-onset hypertension and probably required more intensive and short-term follow-up examinations or even early initiation of non-pharmacological intervention to promote physical activity or restriction of sodium intake.
To the best of our knowledge, the present analysis represents the first study reporting a prognostic relevance of the ARR, determined by measuring direct renin and aldosterone simultaneously using a fully automated CLIA on the LIAISON® platform. Methodological pitfalls in the measurement of these biomarkers by conventional assays are essential in limiting their broad utility in daily praxis. Whereas activity assays measure only active renin, CLIA determines the actual concentration of renin in plasma, being therefore independent on angiotensinogen concentration. In addition, the usage of well-characterized renin calibrators in CLIA (calibrated against an International Reference Standard) has already led to the first standardization efforts.20 Finally, the automatization of CLIA results in immediate sample processing with a laboratory ‘turnaround time’ about 40 min.21
This study has some limitations which have to be pointed out. The generalizability of the results is limited by inclusion of only normotensive mid-Europeans aged 35–74 years. The studied biomarkers were collected independently of the time of day and were measured at only one time point, and could therefore not be corrected for potential diurnal or circadian variations.22 Further limitation of the present analysis is that no data on salt intake or urinary sodium excretion in the present population are available. Moreover, primary aldosteronism, which might affect up to 6% of hypertensive subjects from the general population,23 as well as other secondary forms of hypertension could not be excluded from the analysis, since no confirmatory testing could be done due to the study design. In women usage of oral contraceptive agents or HRT might result in distortion of renin concentration.24 The HRT use might also increases ARR especially if direct renin concentration and not it activity is used to calculate the ratio.25 However, within the present analysis both, decreased renin concentration and increased ARR remained related to incident hypertension even after multivariable adjustment with additional correction for hormonal influence.
The current study has several strengths. The GHS represent one of the largest population-based investigations so far evaluating the role of RAAS biomarkers for prediction of hypertension sex-specifically. Simultaneous assessment of studied biomarkers within the same blood sample minimize analytical imprecision of ARR, as seen for conventional methods, where the ARR is usually calculated from two (in case of plasma renin activity even three) separate measurements by two different assays. The present analysis was restricted to subjects without antihypertensive medication at baseline examination, thereby eliminating any possible drug-related bias and especially aldosterone breakthrough.26
5. Conclusion
The present study revealed that increased ARR at baseline appeared to be a strong predictor of incident hypertension over a 5-year period. This relationship was driven mainly by a decrease in renin concentration, thereby suggesting lower renin profile as an important triggering factor for new-onset hypertension in the general population. Our data further suggest that ARR, even within the reference range, may be an independent biomarker of future hypertension risk. In obese subjects, additional determination of ARR might be helpful in identifying individuals being at very high risk for a future development of arterial hypertension.
Supplementary material
Supplementary material is available at Cardiovascular Research online.
Authors’ contributions
N.A. contributed to the analysis and interpretation of data and drafted/revised the manuscript. I.M.H. contributed to the acquisition and interpretation of data, revised the manuscript for intellectual content. A.S. performed statistical analysis, contributed to the interpretation of data and revised the manuscript for intellectual content. O.H. revised the manuscript and provided critical input. V.H.S. contributed to the acquisition of data, revised the manuscript and provided critical input. M.P-N. revised the manuscript and provided critical input. J.H.P. revised the manuscript and provided critical input. H.B. revised the manuscript and provided critical input. N.P. contributed to discussion and revised the manuscript. M.B. contributed to discussion and revised the manuscript. K.J.L. contributed to discussion and revised the manuscript. T.M. contributed to the study design, study oversight and critical revision of the manuscript. P.S.W. contributed to the study design, interpretation of data, study oversight and critical revision of the manuscript.
Funding
This work was supported by the government of Rhineland-Palatinate (‘Stiftung Rheinland Pfalz für Innovation’, contract No. AZ 961-386261/733), the research programmes ‘Wissen schafft Zukunft’ and ‘Schwerpunkt Vaskuläre Prävention’ of the Johannes Gutenberg-University of Mainz, and its contract with Boehringer Ingelheim and Philips Medical Systems including an unrestricted grant for the GHS as well as through the grants from the Initiative Health Economy Rhineland-Palatinate by the Ministry of Health and the Ministry of Economics, Rhineland-Palatinate, Germany (AZ.623-1) and the Federal Ministry of Education and Research, Germany (BMBF, 01EO1003). P.S.W. and T.M. are PI’s of the DZHK (German Center for Cardiovascular Research), Partner Site Rhine-Main, Mainz, Germany.
Data availability
The analysis presents clinical data of a large-scale population-based cohort with ongoing follow-up examinations. This project constitutes a major scientific effort with high methodological standards and detailed guidelines for analysis and publication to ensure scientific analyses on the highest level. Therefore, data are not made available for the scientific community outside the established and controlled workflows and algorithms. To meet the general idea of verification and reproducibility of scientific findings, we offer access to data at the local database in accordance with the ethics vote on request at any time. The GHS steering committee, which comprises a member of each involved department and the head of the GHS, convenes once a month. The steering committee decides on internal and external access of researchers and use of the data and biomaterials based on a research proposal to be supplied by the researcher. Interested researchers make their requests to the head of the GHS (P.S.W., [email protected]).
Translational perspective
These findings may help in a better understanding of importance of aldosterone–renin imbalance for the development of new-onset hypertension among normotensive subject and identify individuals at greatest risk, who probably required more intensive preventive measures.
Acknowledgements
We are indebted to the study participants of the Gutenberg Health Study and to all co-workers, who are involved in the planning and conduct of the study.
References
Author notes
Thomas Münzel, Philipp S. Wild contributed equally to the study.
Conflict of interest: none declared.
