


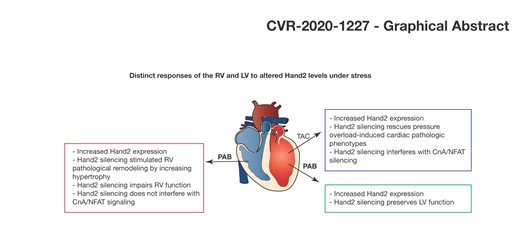
Abstract
Research on the pathophysiology of right ventricular (RV) failure has, in spite of the associated high mortality and morbidity, lagged behind compared to the left ventricle (LV). Previous work from our lab revealed that the embryonic basic helix-loop-helix transcription factor heart and neural crest derivatives expressed-2 (Hand2) is re-expressed in the adult heart and activates a ‘foetal gene programme’ contributing to pathological cardiac remodelling under conditions of LV pressure overload. As such, ablation of cardiac expression of Hand2 conferred protection to cardiac stress and abrogated the maladaptive effects that were observed upon increased expression levels. In this study, we aimed to understand the contribution of Hand2 to RV remodelling in response to pressure overload induced by pulmonary artery banding (PAB).
In this study, Hand2F/F and MCM- Hand2F/F mice were treated with tamoxifen (control and knockout, respectively) and subjected to six weeks of RV pressure overload induced by PAB. Echocardiographic- and MRI-derived haemodynamic parameters as well as molecular remodelling were assessed for all experimental groups and compared to sham-operated controls. Six weeks after PAB, levels of Hand2 expression increased in the control-banded animals but, as expected, remained absent in the knockout hearts. Despite the dramatic differences in Hand2 expression, pressure overload resulted in impaired cardiac function independently of the genotype. In fact, Hand2 depletion seems to sensitize the RV to pressure overload as these mice develop more hypertrophy and more severe cardiac dysfunction. Higher expression levels of HAND2 were also observed in RV samples of human hearts from patients with pulmonary hypertension. In turn, the LV of RV pressure-overloaded hearts was also dramatically affected as reflected by changes in shape, decreased LV mass, and impaired cardiac function. RNA-sequencing revealed a distinct set of genes that are dysregulated in the pressure-overloaded RV, compared to the previously described pressure-overloaded LV.
Cardiac-specific depletion of Hand2 is associated with severe cardiac dysfunction in conditions of RV pressure overload. While inhibiting Hand2 expression can prevent cardiac dysfunction in conditions of LV pressure overload, the same does not hold true for conditions of RV pressu re overload. This study highlights the need to better understand the molecular mechanisms driving pathological remodelling of the RV in contrast to the LV, in order to better diagnose and treat patients with RV or LV failure.
1. Introduction
Heart failure (HF), roughly described as the inability of the heart to pump blood, is a leading cause of morbidity and mortality worldwide, currently affecting more than 26 million people.1 Commonly, HF is classified in left (LV) and right ventricular (RV) failure, depending on which ventricle is failing. The majority of the studies are focused on LV failure, whereas RV failure has received less attention. Therefore, it is not surprising that the knowledge on LV failure is greater and more accurate than on RV failure. Likewise, most of the therapies for HF are directed to the LV and commonly also administered to patients suffering from RV failure. As RV failure remains associated with poor prognosis,2 new RV-specific therapies are urgently needed. However, our limited understanding on RV molecular pathophysiological mechanisms remains an obstacle in the development of new and more efficient drugs.
The RV has not been systematically investigated on the cellular and molecular level most likely because of the widely held opinion that the conditions governing RV and LV failure are identical or very similar and, as such, most concepts of RV failure have been shaped by the studies of the LV. However, embryological and physiological differences exist between both ventricles that support the hypothesis that gene expression patterns and their consequences differ between RV and LV failure. In fact, from embryonic development to the adult organism, both ventricles are exposed to different stimuli, including different haemodynamic forces and unique patterns of gene expression. RV is characterized by thinner walls, continuous coronary flow and is classically connected to a low-resistance pulmonary circulation, rendering it more sensitive to pressure-overload than volume-overload.3,4
The vertebrate heart forms from two populations of cardiac progenitor cells: the primary and the secondary heart field. The primary heart field gives rise to the cardiac crescent, left ventricle and atria.5–7 The secondary heart field gives rise to the outflow tract, the right ventricle and atria.5,8 During these embryological processes, transcription factors are locally expressed in the developing heart and while some can be found in both the primary and secondary heart fields, others show specific expression patterns in just one of them. T-box 5 (TBX5) is mostly expressed in the primary heart field with some residual expression in the RV trabeculae, but not free wall (reviewed in Steimle & Moskowitz, 2017).9 The basic helix-loop-helix transcription factor heart and neural crest derivatives expressed-1 (HAND1), expressed mainly in the primary heart field, is also found in the secondary heart field-derived myocardial outflow tract and pericardium (reviewed in George & Firulli, 2019).10 In turn, heart and neural crest derivatives expressed-2 (HAND2), islet-1, fibroblast growth factor-8, fibroblast growth factor-10, and paired-like homeodomain-2 are mostly expressed in the secondary heart field.11–14 In mice, from embryonic day 7.75, Hand2 expression is detectable within the cardiac crescent and it becomes robustly expressed within the secondary heart field pharyngeal mesoderm that underlies and contributes to the growing heart tube.12,15 During cardiac looping, myocardial expression of Hand2 is very low but very accentuated in the endocardium.16,17 Loss-of-function studies in mice revealed the importance of these transcription factors during development of the heart. Without proper expression of Hand1, normal development of the LV is disrupted due to a proliferation defect, and causing the mutants to die from extra-embryonic effects.13,14,18 While, Hand2-null mutants show RV deficient vascularization and hypoplasia,19,20 its overexpression in ventricles leads to absence of intraventricular septum, both observations indicating that Hand2 expression is critical for patterning of ventricles.21 Interestingly, two studies reported that individuals with pulmonary stenosis and congenital heart disease carry a loss-of-function mutation of the HAND2 gene,22,23 suggesting HAND2 as a potential key player in RV failure pathology. Furthermore, previous work from our lab and others revealed that Hand2 re-expression in the adult mouse heart activates a ‘foetal gene programme’ and contributes to pathological cardiac remodelling under conditions of LV pressure overload.24–26Hand2 overexpression induces hypertrophic growth of the LV and bi-chamber dilation, again suggesting a role for this transcription factor in adult RV remodelling.24 In agreement, ablation of cardiac expression of Hand2 conferred protection to cardiac stress and abrogated the maladaptive effects that were observed upon increased expression levels.24
RV failure is a complex condition with an important impact on cardiovascular disease that still lacks accurate understanding and consequently, an efficient treatment. Here, we aim to elucidate the molecular mechanisms underlying RV failure, and decipher the intricate role of Hand2 on RV hypertrophy, by functional and molecular characterization of hearts from mice with cardiac-specific Hand2 ablation and that were exposed to conditions of RV pressure overload.
2. Methods
Experimental procedures were reviewed and approved by the Institutional Animal Care and Use Committees and authorized by the Animal Experimental Committee of the local government in accordance to the Dutch law (DEC 2012-172) and European Directive 2010/63/EU. In addition, the investigation conforms to the Guide for the Care and Use of Laboratory Animals published by the US National Institutes of Health (NIH Publication No. 85-23, revised 1985). Approval from the Sydney Heart Bank was received for use of human RV samples (HREC #2814; HREC #7326). The use of human RV autopsy samples was approved by and performed according to guidelines of the ethics committee of Amsterdam UMC, location VUmc, and conformed to the Declaration of Helsinki principles.
2.1 Animal models and pulmonary artery banding surgery
Mice harbouring a floxed allele of Hand2 (Hand2F/F) in a B6129F1 background were described previously,27 and crossbred with mice harbouring a tamoxifen-regulated form of Cre recombinase (MerCreMer) under control of the murine Myh6 promoter (MHC–MerCreMer; MCM mice)28 in a B6129F1 background to generate MCM–Hand2F/F mice. Hand2F/F and MCM–Hand2F/F were treated with either vehicle (10/90 v/v ethanol/peanut oil, Sigma P2144) or tamoxifen (45 mg kg−1 per day) by daily intraperitoneal injections for five consecutive days. Both male and female, adult MCM–Hand2F/F mice and Hand2F/F mice (10–12 weeks of age) were used for functional and histological analyses.
Pulmonary artery banding (PAB) was performed, as described below, in mice older than 8 weeks from both genders. Animals were anaesthetized with isofluorane/air mixture (5% induction; 2–3% maintenance), and subsequently analgesia with buprenorphine (0.01 mg/kg s.c.) was injected. Animals were placed in a supine position on a heating pad (37°C) and intubated with a 20G catheter and ventilated with room air using a Harvard mini-ventilator (model 687, Hugo Sachs, Germany; respiratory rate 180 breaths per minute and a tidal volume of 125 μL). The pulmonary artery was approached by a left lateral thoracotomy and banded with a 7–0 suture by tying over a 23G needle. Post-operative pain relief was provided with buprenorphine (0.01 mg/kg s.c.) twice daily for 2–3 consecutive days if necessary. Sham-operated animals underwent the same procedure without PAB. All protocols were reviewed and approved by the Animal Care and Use Committee of the University of Maastricht and Animal Experiments Committee of the University of Groningen and were performed according to the rules formulated in the Dutch law on care and use of experimental animals.
2.2 Haemodynamic analyses
Haemodynamic function was assessed at Week 2 and Week 6 after sham or PAB surgery, by cardiac magnetic resonance imaging (MRI) during anaesthesia with isoflurane (induction 5%; 1.5–3% maintenance) and warming at 37°C. Echocardiography to assess the PAB gradient was performed using a Vivid Dimension 7 and i13L-transducer (GE Healthcare, Waukesha, WI, USA) from a short-axis view at aortic level, at Week 2 and Week 6 after sham or PAB surgery. MRI was performed by using a vertical 9.4 T 89-mm diameter bore scanner (Bruker BioSpin, Etllingen, Germany) equipped with 1500 mT/m gradient set (Bruker BioSpin GmbH, Ellingen, Germany). Respiratory and heart rate were derived using a pressure pad placed under the chest of the mouse. The longitudinal axis of the RV was determined with two- and four-chamber scout scans, where after axes were adjusted to actual axes. Slices of longitudinal axis, four-chamber view, and 10 or 11 slices of the short-axis of 1 mm and no slice gap were obtained. Slices were derived including complete apex and base of the right ventricle. Cine imaging was performed with a retrospectively-triggered (self-gated) gradient-echo sequence (Paravision 4.0 and IntraGate, Bruker Biopspin GmBH) with the following settings: TR = 6.8 ms, TE = 1.9 ms, number of movie frames =15, slice thickness =1 mm, matrix =256 ×256 and field of view =30 ×30. The myocardium was manually segmented by drawing the epicardial and endocardial contours, excluding the papillary muscles using QMass (version MR 7.6, Medis Medical Imaging Systems, Leiden, The Netherlands). Semiautomatic segmentation was used to determine end-diastolic volume (EDV), end-systolic volume (ESV), and wall thickness (WT). Stroke volume (SV) was calculated as EDV−ESV. Ejection fraction (EF) was calculated as (EDV−ESV)/EDV×100. Cardiac output (CO) was calculated manually as SV × mean observed heart rate. Septal flattening is expressed by the eccentricity index, both end-diastolic and end-systolic, which was calculated by dividing the diameter of the LV diameter parallel to the intraventricular septum by the diameter perpendicular to the intraventricular septum derived from short-axis at the mid-papillary level.
2.3 Tissue sampling
Animals were sacrificed by cervical dislocation and the heart, liver, and lung were excised, rinsed with ice-cold PBS and snap-frozen for further mRNA or protein expression analyses. From the hearts, we further dissected the left and right ventricle as well as the septum separately. In some cases, the hearts were perfusion-fixed with 4% paraformaldehyde for paraffin embedment. All mouse cardiac tissue samples were collected after 6 weeks of PAB.
2.4 RNA isolation, cDNA conversion, and Real-time RT–PCR
Total RNA was isolated from mouse heart tissue using Direct-zol™ reagent (ZYMO) according to manufacturer’s instructions. RNA (1 ug) was then reverse-transcribed with either M-MLV reverse transcriptase (Promega, Madison, WI, USA). Quantitative real-time polymerase chain reaction (qPCR) was performed on a BioRad iCycler (Biorad) using SYBR Green reagent (VWR). Transcript quantities were compared using the relative Ct method, where the amount of target normalized to the amount of endogenous control (L7) and relative to the control sample is given by 2–ΔCt. Primer sequences for mRNA detection are depicted in Supplementary material online, Table S1.
2.5 Western blot analysis
SDS-PAGE electrophoresis and blotting were performed as previously described.24 In short, whole tissue or cell lysates were produced in RIPA buffer supplemented wtih PhosSTOP (Roche) and Protease inhibitor cocktail (Roche). Subsequently, samples were boiled in 4× Leammli buffer, including 2% β-mercaptoethanol, for 5 min at 95°C. SDS-PAGE and Western blotting were performed using the Mini-PROTEAN 3 system (Bio-Rad). Blotted membranes were blocked in 5% BSA/TBS-Tween. Primary antibody labelling was performed overnight at 4°C. Secondary IgG–horseradish peroxidase (HRP)-conjugated antibodies were applied for 2 h at room temperature. After each antibody incubation, blots were washed for 3 ×10 min in TBS-Tween. Images were generated using Supersignal West Dura Extended Duration ECL Substrate (Pierce) and the LAS-3000 documentation system (FujiFilm Life Science). Stripping was performed with Restore Western blot stripping buffer (Pierce). Outputs were normalized for loading and results are expressed as an n-fold increase over the values of the control group in densitometric arbitrary units. Primary antibodies that were used included rabbit polyclonal anti-Hand2 (sc-22818, Santa Cruz, 1:200), rabbit monoclonal anti-COL1A (E8I9Z, Cell Signaling Technology, 1:1000), rabbit polyclonal anti-VEGFR2 (#2472, Cell Signaling Technology, 1:1000), goat polyclonal anti-ENG (AF1320, R&D Systems, 1:1500), rabbit monoclonal antibody to PAI1 (ab222754, Abcam, 1:500), mouse monoclonal anti-alpha-tubulin (ab7291, Abcam, 1:5000), and mouse monoclonal anti-GAPDH (Millipore, 1: 10 000). Secondary antibodies included polyclonal rabbit anti-mouse IgG–HRP (DAKO, 1:5000) and polyclonal swine anti-rabbit IgG–HRP (DAKO, 1:5000).
2.6 Histology, immunohistochemistry, and immunofluorescence
For histological analysis, hearts were perfusion-fixed with 4% paraformaldehyde, embedded in paraffin and cut into 4-μm sections. Paraffin sections were stained with haematoxylin and eosin for routine histological analysis, Sirius Red for detection of fibrillar collagen and FITC-labelled wheat germ agglutinin (WGA, Sigma) to visualize and quantify the cell cross-sectional area (CSA). Modification of Isolectine B4 staining with additional fluorescence labelled-streptavidin (Dylight 595-conjugated streptavidin, Jackson Thermo, 1:100) and counterstaining with FITC-labelled WGA was performed to assess capillary to cardiomyocyte ratios. Collagen deposition, cell CSA, and capillary density were determined using ImagePro software and ImageJ software. Slides were visualized using a Leica DM2000 and a Leica DM3000 microscope for bright field and fluorescence imaging, respectively.
2.7 Library construction and sequencing
Total RNA was extracted using Direct-zol™ reagent (ZYMO), following the manufacturer’s procedure. The total RNA quality and quantity were analysed by a Bioanalyzer 2100 and RNA 6000 Nano LabChip Kit (Agilent, CA, USA) with RIN number >7.0. Approximately 10 µg of total RNA was used to remove ribosomal RNA according to the manuscript of the Epicentre Ribo-Zero Gold Kit (Illumina, San Diego, USA). Following purification, the ribo-minus RNA fractions is fragmented into small pieces using divalent cations under elevated temperature. Then, the cleaved RNA fragments were reverse-transcribed to create the final cDNA library in accordance with a strand-specific library preparation by dUTP method. The average insert size for the paired-end libraries was 300 ± 50 bp. And then, we performed the pair-end 2 × 150 bp sequencing on an illumina Hiseq 4000 platform housed in the LC Sciences (Hangzhou, China) following the vendor’s recommended protocol.
2.8 Bioinformatics analysis
For transcripts assembly, firstly, Cutadapt29 and perl scripts in house were used to remove the reads that contained adaptor contamination, low-quality bases, and undetermined bases. Then, sequence quality was verified using FastQC (http://www.bioinformatics.babraham.ac.uk/projects/fastqc/). We used Bowtie230 and Tophat231 to map reads to the genome of Mus musculus (Version: v88). The mapped reads of each sample were assembled using StringTie.32 Then, all transcriptomes from six samples were merged to reconstruct a comprehensive transcriptome using perl scripts and gffcompare (https://github.com/gpertea/gffcompare/). After the final transcriptome was generated, StringTie32 and Ballgown33 were used to estimate the expression levels of all transcripts. To analyse the differential expression, StringTie32 was used to perform expression level for mRNAs by calculating FPKM {FPKM=[total_exon_fragments/mapped_reads(millions) ×exon_length(kB)]}. The differentially expressed mRNAs were selected with log2 (fold change) >1 or log2 (fold change) <−1 and with parametric F-test comparing nested linear models (P-value <0.05) by R package Ballgown.33
2.9 Statistical analysis
All data are presented as mean ± standard error of mean. Statistical analyses were performed using prism software (GraphPad Software Inc.) and consisted of one-way analysis of variance (ANOVA), followed by Tukey’s multiple comparison tests, when comparing more than two experimental groups, or of unpaired Student’s t-test when comparing two experimental groups. Probability values P < 0.05 were considered statistically significant.
3. Results
3.1 Cardiac-specific deletion of Hand2 augments RV susceptibility to increased pressure overload induced by PAB
When analysing HAND2 expression on RV tissue from patients with pulmonary hypertension (PH), we identified a significant increase of the protein in patients, compared to healthy individuals (Figure 1A), suggesting a role for the HAND2 gene in the onset/development of the disease. To assess the contribution of Hand2 to the response of the RV to pressure overload, we induced deletion of a floxed Hand2 (Hand2F/F) allele using a tamoxifen-inducible Cre recombinase protein fused to two mutant oestrogen-receptor ligand-binding domains [F] under control of the cardiac-specific α-myosin heavy chain promoter (MCM-Hand2F/F) in adult mice, as described by us before.24Hand2F/F (control) and MCM-Hand2F/F (knockout) mice were subjected to sham or PAB surgery for 6 weeks, a period during which cardiac function was assessed by echocardiography at Day 5 and MRI at Weeks 2 and 6 (Figure 1B). Whereas 5 days after PAB surgery, both Hand2F/F and MCM-Hand2F/F mice displayed a similar increase in PA gradients (Figure 1C), the knockout mice showed a slight decrease in pressure 6 weeks after banding, even though it was not statistically significant. In control mice, RV pressure overload-induced myocardial Hand2 expression by 3.5-fold in the RV and three-fold in the LV (Figure 1D). Elevated expression of Hand2 in control mice subjected to PAB, is accompanied by impaired RV function as reflected by functional parameters, assessed by MRI at Week 6 (Figure 1E– L and Table 1). These results suggest that lowering Hand2 expression could protect the heart from RV pressure overload, as also shown previously for mouse models of LV pressure overload.24Hand2 silencing, however, resulted in further impairment of RV remodelling and function as reflected by increased RV EDV and ESV, respectively (Figure 1F and G and Table 1) and a subsequent decrease in RV EF (Figure 1H and Table 2). Impaired RV function was also associated with increased RV mass (Figure 1J and K and Table 1). No differences were observed within the different experimental groups regarding the response to stress between females and males (data not shown).
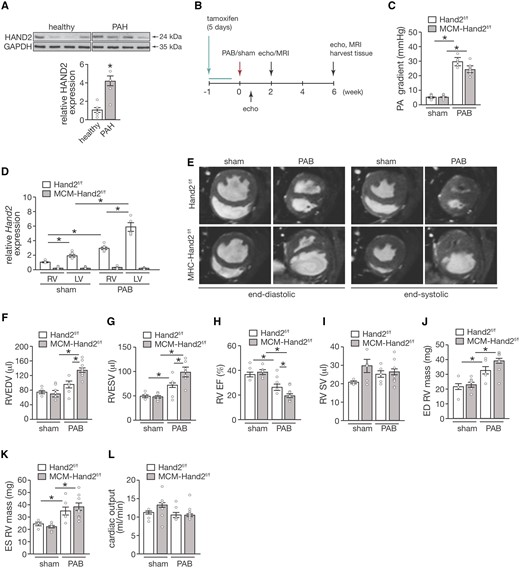
Cardiac-specific depletion of Hand2 sensitizes the RV to pressure overload. (A) Western blot analysis of HAND2 and GAPDH as loading control in human heart tissue from healthy controls and pulmonary arterial hypertension patients. (B) Design of the in vivo study; (C) assessment of pulmonary artery pressure gradient in control (Hand2F/F) and knockout (MCM-Hand2F/F) mice 5 days after either sham or PAB surgery; (D) quantitative real-time PCR analysis of Hand2 expression in RV tissue from Hand2F/F and MCM-Hand2F/F animals either after sham or PAB surgery; (E) representative images of short-axis plan in end-diastole and end-systole hearts obtained by cardiac resonance image from Hand2F/F and MCM-Hand2F/F animals either after sham or PAB surgery Cardiac function was assessed in hearts from Hand2F/F and MCM-Hand2F/F animals either after sham or PAB surgery, and followed by quantitative analysis: (F) RV EDVs and (G) RV ESVs; (H) RV EF; (I) RV SV; (J) RV end-diastolic mass; (K) RV end-systolic mass; and (L) CO. Data are from 5–10 animals per group. Statistical analysis using one-way ANOVA with Tukey’s multiple comparisons test. ∗P<0.05 between indicated groups (error bars are SEM).
MRI assessment of right ventricle function parameters of Hand2F/F and MCM-Hand2F/F mice at 2 and 6 weeks of sham or PAB
| Hand2F/F | MCM- Hand2F/F | |||||||
|---|---|---|---|---|---|---|---|---|
| Sham | PAB | Sham | PAB | |||||
| 2 weeks | 6 weeks | 2 weeks | 6 weeks | 2 weeks | 6 weeks | 2 weeks | 6 weeks | |
| Stroke volume (µL) | 27.0 ± 3.2 | 21.1 ± 1.1 | 24.0 ± 2.1 | 24.9 ± 2.4 | 26.9 ± 2.3 | 23.8 ± 4.0 | 25.9 ± 1.8 | 23.1 ± 2.8 |
| Cardiac output (mL/min) | 14.1 ± 1.3 | 11.1 ± 1.3 | 10.0 ± 0.9* | 10.4 ± 0.8* | 12.9 ± 0.8 | 13.3 ± 1.3 | 11.9 ± 0.6 | 10.6 ± 1.0* |
| ED volume (µL) | 71.2 ± 8.9 | 72.0 ± 6.8 | 84.1 ± 12.5 | 91.7 ± 13.5 | 66.5 ± 3.1 | 68.8 ± 6.1 | 116.9 ± 7.4*# | 117.8 ± 10.7*# |
| ES volume (µL) | 44.1 ± 5.8 | 50.9 ± 6.1 | 60.1 ± 14.4 | 66.7 ± 12.7* | 39.5 ± 3.9 | 45.1 ± 2.5 | 91.0 ± 6.2*# | 94.7 ± 10.2*# |
| ED mass (mg) | 22.6 ± 1.7 | 22.3 ± 4.7 | 30.1 ± 3.2* | 32.9 ± 3.8* | 22.2 ± 2.8 | 23.2 ± 2.0 | 33.9 ± 2.6* | 37.8 ± 2.0* |
| ES mass (mg) | 20.4 ± 2.1 | 24.3 ± 2.2 | 29.9 ± 4.9 | 36.3 ± 4.7* | 19.9 ± 2.4 | 21.6 ± 1.4 | 34.4 ± 1.2* | 37.6 ± 3.1* |
| EF (%) | 38.1 ± 1.9 | 38.2 ± 3.8 | 28.6 ± 2.0 | 26.1 ± 2.4* | 40.9 ± 3.0 | 34.8 ± 2.3 | 22.3 ± 1.3*# | 19.4 ± 2.1*# |
Data are expressed as means ± SEM. ED, end-diastole; ES, end-systole; RV, right ventricle; EF, ejection fraction.
P < 0.05 vs. sham group.
P < 0.05 vs. experimental group. n.s.=5–10 animals per group.
Morphometric characteristics of Hand2F/F and MCM-Hand2F/F mice subjected to 6 weeks of sham or PAB
| Hand2F/F | MCM- Hand2F/F | |||
|---|---|---|---|---|
| Sham | PAB | Sham | PAB | |
| n | 5 | 6 | 6 | 10 |
| HW/BW (mg/g) | 5.6 ± 0.5 | 7.3 ± 0.7* | 5.9 ± 0.7 | 7.9 ± 0.3* |
| HW/TL (mg/mm) | 7.9 ± 0.5 | 9.2 ± 0.4 | 7.9 ± 0.6 | 10.0 ± 0.4* |
| RVW (mg) | 29.2 ± 2.1 | 39.3 ± 1.1* | 26.5 ± 3.1 | 44.4 ± 3.9* |
| IVS+LV (mg) | 127.1 ± 7.1 | 151.8 ± 9.0* | 138.3 ± 5.2 | 150.2 ± 10.3* |
| Fulton index | 0.18 ± 0.02 | 0.25 ± 0.01* | 0.19 ± 0.03 | 0.30 ± 0.02*# |
Data are expressed as means ± SEM. HW, heart weight; BW, body weight; TL, tibia length; RVW, right ventricle weight; IVS, intraventricular septum; LV, left ventricle.
P < 0.05 vs. sham group.
P < 0.05 vs. experimental group. n.s.=5–10 animals per group.
Overall, these data suggest an increase in sensitivity of the RV to pressure overload when Hand2 is silenced.
3.2 Cardiac-specific silencing of Hand2 exacerbates hypertrophic growth of the RV in response to pressure overload
Hypertrophy of the right heart was assessed by the Fulton index, the ratio of RV weight to LV plus septum weight (RV/LV+S). Whereas an increased Fulton index was observed 6 weeks after PAB in both control and knockout animals, compared to sham (Figure 2A and Table 2), the effect was more profound in the absence of Hand2 expression. These observations were confirmed by increased CSA of cardiomyocytes derived from banded-knockout hearts when compared banded-control hearts (Figure 2B and C). Hypertrophic RV remodelling was associated with significantly increased mRNA expression of hypertrophic ‘foetal’ cardiac genes encoding natriuretic peptides atrial natriuretic factor (Nppa) and brain natriuretic peptide (Nppb), alpha-skeletal actin 1 (Acta1), and β-myosin heavy chain (Myh7) (Figure 2D– G). Furthermore, an increase in mRNA levels of regulator of calcineurin isoform 4 (Rcan1.4) confirms activation of calcineurin/NFAT signalling in the RV response to pressure overload, which was not affected by Hand2 silencing (Figure 2H). At 6 weeks post-PAB, both control and Hand2 knockout animals displayed similar levels of collagen deposition and formation of fibrotic lesions (Figure 2I and J). In line, no significant differences were observed for mRNA expression levels of the pro-fibrotic markers collagen type I (Col1A), transforming growth factor beta (Tgfb), and endoglin (Eng) between the banded animals (Figure 2K– M). This was also reflected at the protein levels, where no significant changes were observed for all the above markers nor plasminogen activator inhibitor-1 (PAI1), as readout of TGFβ signalling activation34 (Figure 2N). Remarkably, despite silencing of Hand2 resulting in lower levels of pro-fibrotic markers in the RV of sham animals, these levels significantly rose to control levels upon subjection to PAB.
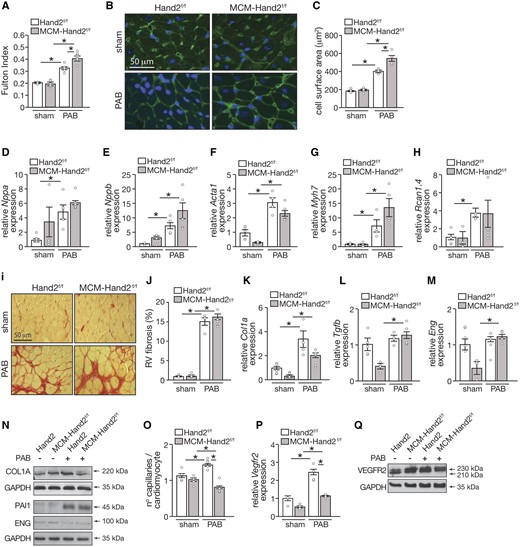
Assessment of RV remodelling induced by PAB upon cardiac depletion of Hand2. (A) Fulton’s index values (ratio of RV weight to LV plus septal weight) of Hand2F/F and MCM-Hand2F/F animals either after sham or PAB surgery; (B) high-magnification of representative images of histological sections stained for WGA; and (C) quantification of CSA in (B), n =30 microscopic field/heart, 3 hearts. (D–H) Quantitative real-time PCR analysis was performed to assess the expression levels of several genes known to be related to cardiac hypertrophy in RV tissue from Hand2F/F and MCM-Hand2F/F animals either after sham or PAB surgery: (D) Nppa; (E) Nppb; (F) Acta1; (G) β-myosin heavy chain; (H) regulator of Calcineurin 1 Isoform 4; (I) high-magnification of representative images of histological sections stained for Sirius Red; (J) quantification of collagen deposition in (I), n =30 microscopic field/heart, 3 hearts. Quantitative real-time PCR analysis of (K) collagen type I alpha 1 chain; (L) Tgfb and (M) Eng; (N) representative images of western blot analysis of COL1A, PAI-1, ENG, and GAPDH as loading control in RV tissue of Hand2F/F and MCM-Hand2F/F animals subjected to either sham or PAB surgery (O) Capillaries in RV sections of Hand2F/F and MCM-Hand2F/F mice subjected to either sham or PAB surgery were identified by isolectin B4 immunohistochemistry combined with WGA and, from the images obtained, we determined the ratio of capillaries per cardiomyocyte ratios; (P) quantitative real-time PCR analysis of Vegfr2 expression levels in the RV of Hand2F/F and MCM-Hand2F/F animals, subjected to either sham or PAB surgery. (Q) Representative images of western blot analysis of VEGFR2 and GAPDH as loading control in RV tissue of Hand2F/F and MCM-Hand2F/F animals subjected to either sham or PAB surgery. Data are from 5–10 animals per group, except for the western blots where protein lysates from 3–5 hearts per group were pulled in one sample. Statistical analysis using one-way ANOVA with Tukey’s multiple comparisons test. ∗P<0.05 between indicated groups (error bars are SEM).
As RV capillary rarefaction is a phenomenon that leads to maladaptive RV remodelling, we assessed the capillary to myocyte ratio of the RV in our different experimental groups. While histochemical analysis and respective quantification reflected higher capillary to myocyte ratio in control mice subjected to RV stress, a significant decrease was observed in Hand2 knockout animals, under the same conditions (Figure 2O). These results were somewhat corroborated by the expression levels of vascular endothelial growth factor receptor 2 (Vegfr2). Whereas in control mice subjected to PAB there was a clear increase in VEGFR2 expression, the increase in the knockout mice was only mild, even if significant (Figure 2P and Q), and not able to promote adequate angiogenesis (Figure 2O).
Taken together, these data indicate that silencing of Hand2 induces exacerbated hypertrophy while also impairing microvascular remodelling under conditions of RV pressure overload.
3.3 Effects of cardiac silencing of Hand2 in the function and morphology of the LV under conditions of RV pressure overload
Based on interventricular interaction, any changes in RV shape will have consequences for the LV. While, we observed increased eccentricity for the banded animals at both end-diastole and end-systole, no differences were observed between control and knockout mice (Figure 3A and B). Increased LV eccentricity index reflects increased pressure of the RV and represents septal flattening, which affects LV function and remodelling. Pressure-overloaded animals, independent of the genotype, displayed decreased LV end-diastolic and -systolic volumes and subsequent decrease in SVs and CO (Table 3). No changes in systolic function were observed, as reflected by preserved LV EF throughout the different experimental groups (Table 3). Whereas animals subjected to PAB seem to display larger cardiomyocytes, this effect was not significant in the control or knockout mice (Figure 3C). In agreement, a clear up-regulation of the stress cardiac genes Nppa, Nppb, and Myh7 in the LV of control-banded animals was observed but the expression levels remained at baseline in banded-knockout animals (Figure 3D– F). A significant down-regulation in Acta1 mRNA expression levels in the LV, after PAB, was observed, independently of the genotype and in contrast to what was observed for the RV (Figures 2F and 3G). While a clear increase in Rcan1.4 was observed in the LV of control hearts upon RV pressure overload, Rcan1.4 mRNA levels were significantly decreased in the knockout LVs, under similar conditions, compared to the control LVs (Figure 3H). Although increased collagen deposition and fibrotic lesions were observed in the LVs of the control mice subjected to PAB, this was not observed in knockout animals (Figure 3I and J). Similar results were obtained regarding mRNA and/or protein expression levels of Col1a, Tgfb, Pai1, and Eng in the LV tissue (Figure 3K– N).
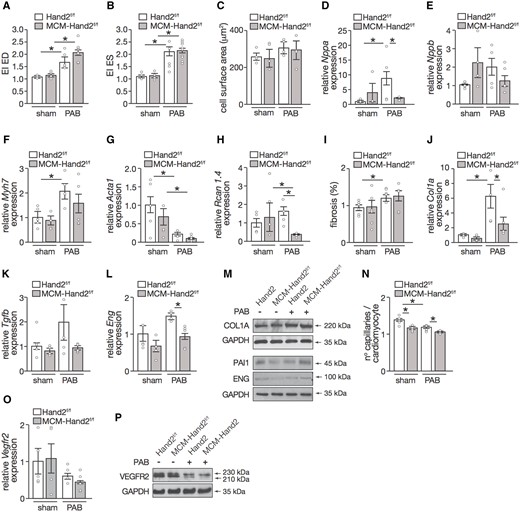
Assessment of LV remodelling induced by PAB upon cardiac depletion of Hand2. (A) Assessment of LV eccentricity index at end-diastole and (B) end-systole; (C) quantification of cardiomyocyte CSA from images of histological sections stained for WGA, n =30 microscopic field/heart, 3 hearts. (D–H) Quantitative real-time PCR analysis was performed to assess the expression levels of several genes known to be related to cardiac hypertrophy in RV tissue from Hand2F/F and MCM-Hand2F/F animals either after sham or PAB surgery: (D) Nppa; (E) Nppb; (F) β-myosin heavy chain; (G) Acta1; (H) regulator of Calcineurin 1 Isoform 4; (I) quantification of collagen deposition from images of histological sections stained for Sirius Red, n =30 microscopic field/heart, 3 hearts. (J–L) Quantitative real-time PCR analysis of (J) collagen type I alpha 1 chain; (K) TGFb and (L) Eng; (M) representative images of western blot analysis of COL1A, PAI-1, ENG, and GAPDH as loading control in LV tissue of Hand2F/F and MCM-Hand2F/F animals subjected to either sham or PAB surgery (N) capillaries in RV sections of Hand2F/F and MCM-Hand2F/F animals subjected to either sham or PAB surgery were identified by isolectin B4 immunohistochemistry combined with WGA and, from the images obtained, we determined the ratio of capillaries per cardiomyocyte ratios; (O) quantitative real-time PCR analysis of Vegfr2 expression levels in the RV of Hand2F/F and MCM-Hand2F/F animals, subjected to either sham or PAB surgery. (P) Representative images of western blot analysis of VEGFR2 and GAPDH as loading control in LV tissue of Hand2F/F and MCM-Hand2F/F animals subjected to either sham or PAB surgery. Data are from 5–10 animals per group, except for the western blots where protein lysates from 3–5 hearts per group were pulled in one sample. Statistical analysis using one-way ANOVA with Tukey’s multiple comparisons test. ∗P<0.05 between indicated groups (error bars are SEM).
MRI assessment of LV function parameters of Hand2F/F and MCM-Hand2F/F mice at 2 and 6 weeks after PAB
| Hand2F/F | MCM- Hand2F/F | |||||||
|---|---|---|---|---|---|---|---|---|
| Sham | PAB | Sham | PAB | |||||
| 2 weeks | 6 weeks | 2 weeks | 6 weeks | 2 weeks | 6 weeks | 2 weeks | 6 weeks | |
| Stroke volume (µL) | 35.2 ± 0.9 | 32.3 ± 2.0 | 27.3 ± 3.9 | 23.3 ± 1.3* | 38.6 ± 2.7 | 35.6 ± 2.4 | 21.7 ± 1.8* | 22.1 ± 1.4* |
| Cardiac output (mL/min) | 18.4 ± 0.4 | 16.9 ± 1.8 | 11.4 ± 1.7* | 9.8 ± 0.5* | 18.6 ± 0.8 | 17.1 ± 1.2 | 9.9 ± 0.7* | 10.2 ± 0.6* |
| ED volume (µL) | 92.7 ± 2.8 | 91.5 ± 7.7 | 58.9 ± 9.4* | 53.7 ± 4.9* | 86.3 ± 2.8 | 84.5 ± 4.5 | 47.5 ± 2.8* | 52.2 ± 4.7* |
| ES volume (µL) | 57.5 ± 3.4 | 59.3 ± 6.1 | 31.6 ± 6.2* | 30.4 ± 3.9* | 47.7 ± 2.8 | 48.8 ± 3.2 | 25.7 ± 1.7* | 30.0 ± 4.4* |
| ED mass (mg) | 53.7 ± 7.1 | 53.0 ± 1.5 | 38.3 ± 4.1* | 39.3 ± 3.2* | 54.1 ± 3.2 | 59.1 ± 3.2 | 37.8 ± 1.9* | 40.3 ± 1.5* |
| ES mass (mg) | 59.1 ± 4.5 | 57.7 ± 6.7 | 43.2 ± 3.8 | 42.8 ± 4.1 | 60.3 ± 4.0 | 63.4 ± 4.6 | 40.2 ± 2.1* | 43.0 ± 2.2* |
| EF (%) | 38.1 ± 1.9 | 35.5 ± 1.7 | 47.4 ± 3.8 | 44.0 ± 2.0 | 44.6 ± 2.5 | 42.3 ± 1.9 | 45.5 ± 2.6 | 42.4 ± 3.0 |
2 or 6 weeks of sham or PAB.
Data are expressed as means ± SEM. ED, end-diastole; ES, end-systole; LV, left ventricle; EF, ejection fraction.
P < 0.05 vs. sham group.
n.s.=5–10 animals per group.
When assessing the capillary density of the LV in our different experimental groups, we observed higher capillary density in the control mice compared to the knockout animals, in both sham and PAB groups, despite a decrease in the overloaded groups (Figure 3O). The lower capillary density observed at baseline in the Hand2 knockout animals was even more reduced upon RV stress (Figure 3O). This was in line with the expression profile of Vegfr2, which although not significant, did show a trend to decrease in the absence of Hand2, either at baseline or under RV stress conditions (Figure 3P and Q).
These data suggest that RV pressure overload results in deformation of the LV with preserved LV function. Furthermore, while silencing of Hand2 seems to ameliorate the molecular maladaptive response of the LV to RV stress, vascular remodelling remains slightly impaired.
3.4 Mechanisms underlying pressure overload-induced RV pathological remodelling
During RV failure, pathological remodelling is activated, as observed by an increase in cardiomyocyte hypertrophy and fibrosis, followed by a decline in cardiac function. To obtain more insight into the molecular and cellular mechanisms driving RV remodelling induced by pressure overload, we performed total RNA-sequencing in RV tissue derived from control (Hand2F/F) animals subjected to either sham or PAB surgery. Transcriptomic analysis revealed 1399 genes to be differentially expressed, either up- or down-regulated, between the two groups (Figure 4A and Supplementary material online, Table S2). Generation of a heatmap representing the 100 most differentially expressed transcripts between the experimental groups disclosed 17 down-regulated and 83 up-regulated genes in the banded WT animals (Figure 4B). To confirm the sequencing data, we have analysed the mRNA levels of several randomly selected genes from both the most significantly up- and down-regulated genes by qPCR. From the down-regulated ones, we have determined the mRNA expression levels of 6-Phosphofructo-2-kinase/fructose-2,6-biphosphatase (Pfkfb1), Aquaporin 4 (Aqp4) and Centromere protein F and while all of them were decreased in mice subjected to PAB, only Pfkfb1 and Aqp4 were significantly changed (Supplementary material online, Figure S1a). From the up-regulated ones, we have determined the mRNA expression levels of Collagen type VIII alpha 1 chain (Col8a1), Small proline rich protein 1A, and ADAM metallopeptidase domain 8 (Adam8) and, also here, while all of them were increased in mice subjected to PAB, only Col8a1 and Adam8 were significantly changed (Supplementary material online, Figure S1a). Among the top up-regulated genes in the sequencing data, we found several collagens and fibrotic related genes (Collagen type VIII, type IV and type XVI alpha 1 chain, Col8a1, Col4a1, and Col16a1; Periostin, Postn; and Transforming growth factor beta-3) but also hypertrophic (natriuretic peptide A and B, Nppa and Nppb, respectively; Myocilin) and inflammatory genes (Interleukin 17 receptor C and Chemokine C-motif ligand 21A serine) (Figure 4B). After compiling our list of PAB-associated genes, we undertook a gene ontology (GO) enrichment analysis of this gene set, processing genes in terms of their associated molecular function. The top 20 GO terms based on biological processes and ranked by fold-enrichment are shown in Figure 4C. This top-rank included biological processes, such as ‘extracellular matrix-receptor interaction, collagen trimer, neutrophil chemotaxis, cell adhesion and chemokine signalling, receptor binding and activity’. The KEGG pathway analysis results revealed that the differentially expressed genes were highly associated with several pathways, including ‘TNF-signaling pathway’, ‘hypertrophic cardiomyopathy’, ‘dilated cardiomyopathy’, ‘ECM-receptor interaction’ as well as ‘chemokine signaling’ (Figure 4D). These results indicate that cardiac remodelling induced by PAB involves genes that are directly related to fibrosis, ECM remodelling, vascular function, and inflammation, in agreement with the RV and LV phenotypes observed in mice that were subjected to PAB.
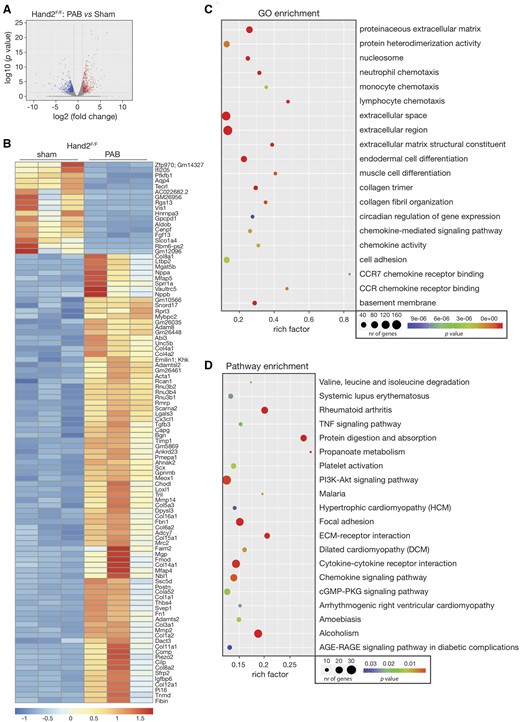
Transcriptional changes in the pressure-overloaded RV. RNA-sequencing was performed to assess the transcriptomic changes in RV tissue from control (Hand2F/F) animals subjected to either sham or PAB surgery for 6 weeks. (A) Volcano plot representation of differential expression of genes in the RV of sham and banded animals. Red and blue points mark the genes with significantly increased or decreased expression, respectively, in Hand2F/F sham to Hand2F/F PAB (FDR<0.01). The x-axis shows log2-fold expression changes and the y-axis the log10-fold likelihood of a gene being differentially expressed; (B) heatmap of the 100 top differentially expressed genes in the RV tissue of Hand2F/F sham compared to Hand2F/F PAB showing log2 FPKM (colour scale) values of dysregulated genes, with red and blue colours representing increased and decreased expression, respectively; (C) number of differentially expressed genes enriched in GO terms with P-value and rich factor shown in a scatterplot. The summarized GO terms are related to the biological processes upon PAB in the heart. Rich factor=number of differentially expressed genes in GO term/total number of genes in GO term. The larger the rich factor, the higher enrichment is. Circle size is proportional to the frequency of the GO term, whereas colour indicates the log10P-value (red higher, blue lower); (D) KEGG pathway analysis of differentially expressed genes with P-value and rich factor shown in a scatterplot. Differentially enriched pathways in the RV tissue of control animals subjected to PAB, in comparison to sham.
3.5 Mechanisms underlying the role of Hand2 in pressure overload-induced RV pathological remodelling
Next, and to better understand how RV remodelling induced by pressure overload is affected by Hand2 silencing, we performed RNA-sequencing to assess the transcriptomic changes in total RNA from RV tissue derived from control or knockout animals subjected to PAB. Transcriptome analysis identified 1783 transcripts potentially regulated by Hand2 (Figure 5A and Supplementary material online, Table S3). Generation of a heatmap representing the 100 most differentially expressed transcripts between the 2 experimental groups revealed 33 down-regulated and 67 up-regulated genes in the RV of Hand2 knockout mice (Figure 5B and Supplementary material online, Table S3). To confirm the sequencing data, we have analysed the mRNA levels of several randomly selected genes from both the most significantly up- and down-regulated genes by qPCR. From the down-regulated ones, we have determined the mRNA expression levels of Caveolin 1, Matrix metallopeptidase 15, and Adam8 and could confirm decreased expression levels in mice subjected to PAB for all of them (Supplementary material online, Figure S1b). From the up-regulated ones, we have determined the mRNA expression levels of Nebulette, Flavin containing dimethylaniline monooxygenase 2, and Ankyrin repeat domain 1 and while all of them showed a trend for increasing in mice subjected to PAB, these results were not significant (Supplementary material online, Figure S1b). The sequencing data revealed that upon silencing of Hand2, RV stress resulted in down-regulation of genes that are mostly associated with cellular components related to nucleic acid binding, regulation of transcription, and transcription factor activity (U3B small nuclear RNA 2, GINS complex subunit 2, Telomerase RNA component, and Transcription factor 7) and cell adhesion genes (Adam8, Angiopoietin-like protein 4, Rho GDP dissociation inhibitor alpha, Ankyrin repeat domain 63, and Ephrin B3) (Figure 5B and C). In turn, the up-regulated genes are associated with hypertrophy (Nppb; Myotrophin, and Dmd) and cell cycle inhibitors (Interferon activated gene 205 and cell division cycle 73) (Figure 5B and C). Interestingly, genes, such as Bone morphogenetic protein receptor, type II, Rho-associated coiled-coil containing protein kinase 2, and Tissue inhibitor of metalloproteinase 3, previously associated with PH, showed an even higher expression in the absence of Hand2. Furthermore, GO and pathway (KEGG) enrichment analysis associated the observed gene expression patterns with regulation of transcription, muscle cell differentiation, cellular response to hypoxia, as well as with development of different types of cancer and different signalling pathways in cancer, platelet activation, p53 signalling pathway, and cell communication through gap junctions (Figure 5C and D). These results reveal the role of Hand2 in specific molecular and cellular processes that key in the response of the RV to pressure overload.
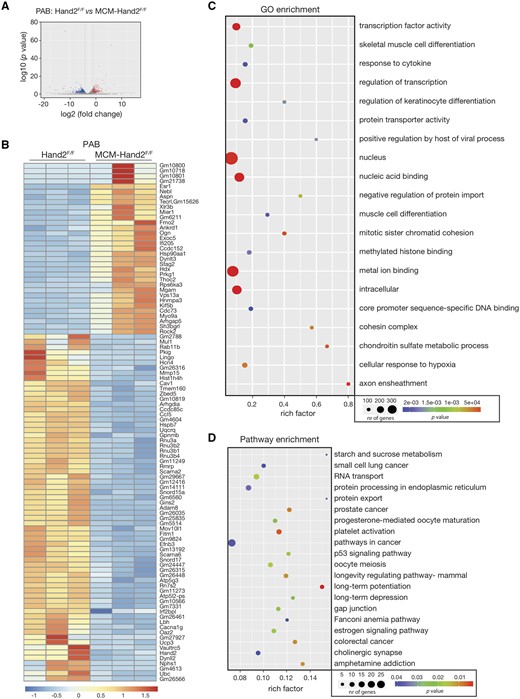
Hand2-dependent transcriptional changes in the pressure-overloaded RV. RNA-sequencing was performed to assess the transcriptomic changes in RV tissue from control (Hand2F/F) and knockout (MCM-Hand2F/F) animals subjected to PAB. (A) Volcano plot representation of differential expression of genes in the RV of Hand2F/F vs. MCM-Hand2F/F. Red and blue points mark the genes with significantly increased or decreased expression, respectively (FDR<0.01). The x-axis shows log2fold-expression changes and the y-axis the log10fold-likelihood of a gene being differentially expressed; (B) heatmap of the 100 top differentially expressed genes in the RV tissue of Hand2F/F sham compared to Hand2F/F PAB showing log2 FPKM (colour scale) values of dysregulated genes, with red and blue colours representing increased and decreased expression, respectively; (C) number of differentially expressed genes enriched in GO terms with P-value and rich factor shown in a scatterplot. The summarized GO terms are related to the biological processes upon PAB in the heart. Rich factor=number of differentially expressed genes in GO term/total number of genes in GO term. The larger the rich factor, the higher enrichment is. Circle size is proportional to the frequency of the GO term, whereas colour indicates the log10 P-value (red higher, blue lower); (D) KEGG pathway analysis of differentially expressed genes with P-value and rich factor shown in a scatterplot. Differentially enriched pathways in the RV tissue of knockout animals subjected to PAB, in comparison to control animals subjected to PAB.
4. Discussion
Here, we aimed to unravel the role of Hand2 in RV remodelling and establish whether this transcription factor has a similar contribution to the remodelling of both ventricles in response to pressure overload. We demonstrated that RV pressure overload, by subjecting control animals (Hand2F/F) to PAB, results in increased Hand2 expression levels in both RV and LV ventricles, with the LV revealing higher levels of expression compared to the RV. Although Hand2 is known to be expressed throughout the atrial and ventricular myocardium with its highest expression in the developing RV, these results are in line with our previous work where we have shown, in adult hearts, higher Hand2 expression levels in the LV compared to the RV in both resting and stress conditions.24 Whereas Hand2 participation in adult myocardial remodelling has not been thoroughly studied and understood, our studies indicate that ventricular pressure overload, either on the right or left side, induces Hand2 expression in both ventricles, with the LV showing the highest levels. However, this contrasts with a study in mice and rats where induction of cardiac hypertrophy either by phenylephrine treatment for 3–5 days or aortic banding for 5, 14, and 21 days resulted in reduced Hand1 and Hand2 RV expression levels.25 In this study, we assessed Hand2 expression at 6 weeks after PAB and therefore, we cannot exclude a different expression pattern in the first days/weeks after banding as first response to the sudden cardiac stress.
As previously observed by us,24 one would expect that correcting the expression levels of Hand2, which is elevated in disease, would reduce maladaptation and confer protection. Nevertheless, a loss-of-function mutation in the Hand2 gene results in increased RV volumes at both end-diastole and end-systole, as well as decreased EF and CO in mice subjected to RV pressure overload, compared to controls, indicating an inability of the RV to adapt to pressure overload. Impaired cardiac function was associated with increased hypertrophic growth of the RV, reflected by increased heart weight to body weight ratios, increased Fulton index as well as elevated cardiomyocyte CSA. The fact that no differences were observed between male and female mice in their response to RV stress highlights the differences regarding female predisposition to PH or right HF between animals and humans. In rats, females seem to be less predisposed to develop PH and RV remodelling.35 In humans, and even though women are more susceptible to PH than man, their RV function is better preserved.36,37
While collagen deposition reached similar levels in both control and Hand2-knockout mice subjected to RV stress, absence of Hand2 inhibits expression of fibrosis-related genes markers early in the disease process. TGFb signalling is involved in tissue repair and scar formation38 and not only it is an important regulator of vascular remodelling and inflammation of the lung39 and kidney,40 it also regulates hypertrophy and fibrosis in the heart.41–43 While Eng is an established regulator of vascular remodelling,44,45 it also plays a critical role in the development of fibrosis by serving as a coreceptor for TGFb signalling.46,47 Their expression profiles confirm the similar collagen deposition observed in the banded animals, independently of the genotype and the fact that the Hand2 knockout hearts display more severe hypertrophic phenotypes. These results, together with the observed increase in some of the hypertrophic gene markers, strongly suggest that absence of Hand2 expression, under pressure overload of the RV, drives cardiac remodelling towards a more hypertrophic phenotype, without exaggerated fibrosis. Nevertheless, such a phenotype is characterized by a stronger impairment of cardiac function as reflected by the altered functional parameters measured by MRI.
Due to the pericardium and the common ventricular septum (ventricular interdependence), alterations in loading conditions of the RV are known to influence septal reconfiguration and motion towards the LV48,49 and, in this way, affect LV performance by altering the LV pressure–volume curve.50,51 Assessing the eccentricity index of the LV shape reflects the abnormal motion of the intraventricular septum depending on the type of RV overload, whether systolic or diastolic.52 In our study, animals that were subjected to PAB revealed an index significantly >1.0 at both systole and diastole, which confirms right pressure overload52 and subsequent abnormal leftward septal motion and configuration. But was the LV affected? In control mice, RV pressure overload did affect the LV as cardiomyocyte hypertrophy and mRNA expression of hypertrophic markers and pro-fibrotic genes were increased. In the absence of Hand2 expression, the hypertrophic response was lost, with decreased cardiomyocyte CSA and associated gene expression. Whereas these results indicate some degree of protection, conferred by depletion of Hand2, analysis of LV function by MRI, revealed a decrease in LV volumes as well as in LV mass, reduced SVs and CO, explained by decreased preloading of the LV due to right-sided pressure overload. Previous studies have shown that impaired cardiac function is not always accompanied by transcriptional activation of the ‘classical’ marker genes associated either with hypertrophy or fibrosis and that it only happens once hypertrophy and/or fibrosis start to develop.53,54 The fact that control mice subjected to RV pressure overload developed LV cardiomyocyte hypertrophy, but Hand2 knockout hearts did not, might be explained by the absence/presence of transcriptional alterations of hypertrophic markers. In those studies, it was speculated that the absence of transcriptional deregulation and no alterations at the cellular level, such as hypertrophy and/or fibrosis, could facilitate recovery of cardiac function by specific treatments53–55 or eventually reversing the stress. If this is the case in our study, remains to be clarified.
As LV diastolic filling is diminished in patients, and animal models, with PH,56–59 this may cause a decrease in preloading of the LV and atrophy, and ultimately HF. In fact, reduction in LV mass was reported in disorders that are associated with chronic RV pressure overload, dysfunction, and altered LV diastolic filling.60,61 LV atrophy is characterized by less prominent transcriptional changes in hypertrophic genes. This supports our findings in the Hand2-depleted animals subjected to PAB where we observed decreased LV mass, no hypertrophy, and no dramatic changes in hypertrophic gene expression. Whether the LV under these conditions becomes atrophic remains to be investigated as we would have to look at the IVS and LV separately as well as analyses the cardiomyocyte length and width in more detail.
We have previously identified differentially expressed transcripts of cardiac Hand2 target genes in pressure-overloaded LVs from Hand2 F/F and MCM-Hand2 F/F animals.24 Besides identifying several genes that had not previously been associated with cardiac hypertrophy, we also noticed a variety of genes involved in TGFb signalling as well as genes with defined functions during embryonic cardiac development.24 Although RV remodelling due to increased pressure load is associated with increased expression of genes known to be involved in hypertrophy, fibrosis, and angiogenesis, most of those genes were not affected by silencing of Hand2. Unbiased approached gene analysis of Hand2 KO hearts, subjected to RV pressure overload, revealed dysregulation of several other cardiac hypertrophy-associated genes, cell cycle inhibitors, and cellular components related to nucleic acid binding, regulation of transcription and transcription factor activity, as well as cell adhesion genes.
While in the pressure-overloaded RVs of Hand2 KO animals, we observed differential expression of several pro-fibrotic and extracellular matrix component genes, genes involved in angiogenesis and endothelial cell function, sarcomere cytoskeleton genes, proinflammatory genes and also genes associated with cardiac hypertrophy and diastolic function; genes that are associated with embryonic development were not very prominent, in contrast to what we observed in the overloaded LVs, and suggesting that the set of Hand2 target genes that are employed during response of the adult RV to pressure overload are very distinct from the ones engaged during cardiac embryonic development.
Altogether, our data indicate that Hand2 depletion does not confer cardiac protection to RV pressure overload but in contrast, sensitizes the RV to stress. Furthermore, it indicates that modulation of Hand2 expression has opposite effects in each of the ventricles and also supports the notion that each ventricle responds to stress in very dissimilar ways, involving different signalling pathways and different cellular processes. While inhibiting Hand2 expression can prevent cardiac dysfunction in conditions of LV pressure overload, the same does not hold true for conditions of RV pressure overload, emphasizing that it is imperative to better understand the molecular mechanisms driving pathological remodelling of the RV in contrast to the LV, in order to better diagnose and treat patients with RV or LV failure.
Supplementary material
Supplementary material is available at Cardiovascular Research online.
Authors’ contributions
R.F.V., A.M.C.K., L.O., E.M.P., J.M.M.K., K.W.V.D.K., D.S.N., and P.A.d.C.M.: substantial contributions to the conception of the work, acquisition and analysis of the data as well as its interpretation. Authors agreed to be accountable for parts of the work they have done.
R.V.F., A.M.C.K., and P.A.d.C.M.: drafted the work.
C.D.R., P.M.F., G.J.D.M.S., A.L., and A.L.-V.: substantial contribution to the design of the work, acquisition of human samples of PAH, and data interpretation.
D.S.N., L.J.D.W., F.S.D.M., I.F.-P., R.M.F.B., and P.A.d.C.M.: substantial contribution to the design of the work and substantial contribution in critically revising the intellectual content of the work.
All authors approved the final version of the work for publication.
Funding
This work was supported by the Foundation for Science and Technology of Portugal (FCT) grant (SFRH/BD/129507/2017 to R.F.V. and PTDC/BIM-MEC/4578/2014 to P.D.C.M.), by the Dutch CardioVascular Alliance (DCVA) awarded to the Phaedra consortium as well as the Impulse Grant 2018 awarded to the Phaedra IMPACT consortium (2012-08, 2014-11 to J.M.M.K., F.S.M., A.L.V., and P.D.C.M.), and by a Dutch Heart Foundation grant (NHS2010B261 to P.D.C.M.).
Data Availability
Any data underlying this article will be shared on reasonable request to the corresponding author.
Translational perspective
RV failure associated with pulmonary hypertension reduces long-term survival rate to 55% within 3 years, suggesting that 3 years after diagnosis almost half of the patients will die. To revert these numbers an adequate RV-specific and, therefore, more efficient treatment is needed. Our work suggests that current therapies and potential mechanisms underlying LV failure may not be suitable for RV failure. While Hand2 deletion is favourable in LV response to stress, it is particularly detrimental in the RV under similar conditions, and thus, highlighting potential severe consequences of not differentiating therapeutic targets or treatment for RV or LV failure.
References
Author notes
Raquel F. Videira, Anne-Marie C. Koop have equally contributed to the manuscript.
Conflict of interest: L.J.D.W. and P.A.d.C.M. are co-founders of Mirabilis Therapeutics BV.
