


Abstract
Heart failure with preserved ejection fraction (HFpEF) is a multifactorial disease that constitutes several distinct phenotypes, including a common cardiometabolic phenotype with obesity and type 2 diabetes mellitus. Treatment options for HFpEF are limited, and development of novel therapeutics is hindered by the paucity of suitable preclinical HFpEF models that recapitulate the complexity of human HFpEF. Metabolic drugs, like glucagon-like peptide receptor agonist (GLP-1 RA) and sodium-glucose co-transporter 2 inhibitors (SGLT2i), have emerged as promising drugs to restore metabolic perturbations and may have value in the treatment of the cardiometabolic HFpEF phenotype. We aimed to develop a multifactorial HFpEF mouse model that closely resembles the cardiometabolic HFpEF phenotype, and evaluated the GLP-1 RA liraglutide (Lira) and the SGLT2i dapagliflozin (Dapa).
Aged (18–22 months old) female C57BL/6J mice were fed a standardized chow (CTRL) or high-fat diet (HFD) for 12 weeks. After 8 weeks HFD, angiotensin II (ANGII), was administered for 4 weeks via osmotic mini pumps. HFD + ANGII resulted in a cardiometabolic HFpEF phenotype, including obesity, impaired glucose handling, and metabolic dysregulation with inflammation. The multiple hit resulted in typical clinical HFpEF features, including cardiac hypertrophy and fibrosis with preserved fractional shortening but with impaired myocardial deformation, atrial enlargement, lung congestion, and elevated blood pressures. Treatment with Lira attenuated the cardiometabolic dysregulation and improved cardiac function, with reduced cardiac hypertrophy, less myocardial fibrosis, and attenuation of atrial weight, natriuretic peptide levels, and lung congestion. Dapa treatment improved glucose handling, but had mild effects on the HFpEF phenotype.
We developed a mouse model that recapitulates the human HFpEF disease, providing a novel opportunity to study disease pathogenesis and the development of enhanced therapeutic approaches. We furthermore show that attenuation of cardiometabolic dysregulation may represent a novel therapeutic target for the treatment of HFpEF.

1. Introduction
Patients with heart failure (HF) are commonly subdivided into those with a reduced (HFrEF) and those with a preserved (HFpEF) ejection fraction.1 The prevalence of HFpEF is expected to steeply increase during the following years, and will likely become the dominant HF-subtype in the near future.2 Prognosis of HFpEF is poor, with a mortality of 10–30% over 5 years, and burden of the disease is substantial.3 Risk factors and pathophysiological processes leading to HFrEF and HFpEF differ largely: HFrEF is mostly seen in men with a history of myocardial infarction or cardiomyopathy, whereas HFpEF is a multifactorial disease expressed as several distinct phenotypes, including a common cardiometabolic phenotype characterized by obesity, type 2 diabetes mellitus (T2DM), hypertension, advanced age, and a female predominance.4–6 In contrast to HFrEF, no currently available evidence-based treatments can improve symptoms and prognosis in HFpEF patients. In addition, the development of novel treatments is hampered by the lack of animal models that can sufficiently represent the complex human HFpEF phenotype.7,8
In this study, we describe the development of a mouse model that features typical aspects of the cardiometabolic HFpEF phenotype. This model is of particular interest for the exploration of novel therapeutic interventions that target the cardiometabolic system in HFpEF, such as glucagon-like peptide receptor agonists (GLP-1 RA) and sodium-glucose co-transporter 2 inhibitors (SGLT2i). GLP-1 is a hormone primarily produced in the intestine with an important role in glycaemic control, body weight, and appetite.9 SGLT2i inhibits reabsorption of glucose in the kidney which results in glycosuria, natriuretic, and diuretic effects.10 Both GLP-1 RA and SGLT2i have emerged as novel and promising cardioprotective drugs, as they reduced the risk of cardiovascular events in patients with T2DM and may reflect a novel promising therapy to improve cardiovascular outcomes and delay the onset and progression of HFrEF.11–15 In addition, several studies have also reported improved diastolic function in animals and patients with HFpEF treated with SGLT2i and GLP-1 RA.14,16,17 However, the effects of these treatments on cardiac structure and function in experimental HFpEF models are lacking. We therefore studied the effects of the GLP-1 RA liraglutide (Lira) and the SGLT2i dapagliflozin (Dapa) on cardiac structure and function in a novel cardiometabolic HFpEF mouse model.
2. Methods
2.1 Animals
All animal studies were approved by the Central Committee of Animal experiments (CCD) licence number AVD105002016487 and the Animal Care and User Committee of the Groningen University (permit number 16487-04-01 and 16487-04-02) and conducted in accordance with the ARRIVE guidelines,18 the general principles governing the use of animals in experiments of the European Communities (Directive 2010/63/EU) and Dutch legislation (The revised Experiments on Animals Act, 2014). Female, 18- to 22-month-old C57BL6/J mice were purchased from Jackson laboratory and provided via the Mouse Clinic for Cancer and Aging (MCCA), Groningen. Mice were housed on a 12 h light/12 h dark cycle with ad libitum access to chow and water. We conducted echocardiography, mini-pump placement, and sacrifice under anaesthesia with oxygen and 2–3% isoflurane, as published before.19,20 Isoflurane is used extensively in rodent research and drug–drug interactions between Lira or Dapa have not been described. Animals were euthanized by dissecting the diaphragm under isoflurane anaesthesia, after which organs were harvested.
2.2 Experimental design
Mice were fed a high-fat diet (HFD; 60% kcal fat, 20% kcal protein, 20% kcal carbohydrates; Research Diets D17041409), or a low-fat equivalent chow (CTRL; 20% kcal fat, 20%kcal protein, 60% kcal carbohydrates; Research diets D17041407) for 12 consecutive weeks, as described.21 After 8 weeks of diet, mice were anaesthetised with oxygen and isoflurane (2–3%), and a mouth mask was put over the nose and mouth of the mice to deliver this mixture throughout the pump placement, which lasted 10 min. The mice were then allowed to wake up and put back in their cage. All mice underwent surgery and an ALZET® osmotic mini-pump (Model 2004) was implanted in a subcutaneous pocket on the back. For Sham-treated mice, the subcutaneous pocket was closed without placement of a pump. Mice were infused with angiotensin II (ANGII) (1.25 mg/kg/day) (Bachem) for 4 weeks, as previously described.22 Mice were randomized to treatment groups based upon body weight, and a total of four experimental groups were studied: (i) CTRL—control diet for 12 weeks, Sham surgery; (ii) CTRL + ANGII—control diet for 12 weeks with 4 weeks of ANGII—infusion via osmotic mini-pump; (iii) HFD for 12 weeks, Sham surgery; (iv) HFD + ANGII—HFD for 12 weeks with 4 weeks of ANGII—infusion via the osmotic mini-pump. A schematic overview of the experiment is shown in Figure 1A.
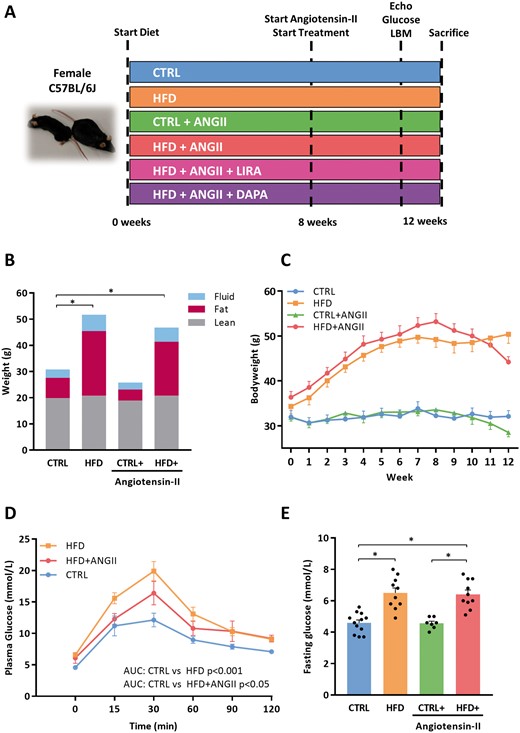
HFD induces obesity and impaired glucose; this phenotype is not affected by addition of ANGII. (A) Overview of experimental design and an example of a CTRL and HFD + ANGII mouse. (B) Body mass composition (fluid, fat, and lean mass) measured by minispec LF90II body composition analyser (n = 7–11 mice). (C) Weight development over time (weeks) (n = 7–11 mice per group). (D) Plasma glucose levels over time (min) after glucose loading (2 g/kg body weight) in an oral glucose tolerance test (n = 7–9 mice per group). To determine glucose tolerance, we calculated AUC per treatment group. (E) Fasting glucose levels per group (n = 6–12 mice per group). AUC, area under the curve; LBM, Lean, fat and fluid Body mass Measurements; CTRL, control chow; CTRL + ANGII, angiotensin II treated group on control chow; HFD, high-fat diet; HFD + ANGII, angiotensin II treated group on high-fat diet. Data are presented as mean + standard errors of the mean. *Kruskal–Wallis test followed by Mann–Whitney U test P <0.05 is considered significant.
2.3 Lira and Dapa treatment
A separate group of mice were subjected to the combinatorial HFD + ANGII intervention. At Week 8, after mini pumps were placed, mice were randomly assigned to receive treatment for 28 days. Administration of subcutaneous Lira (1 mg/kg/day, Novo Nordisk) or saline was initiated daily and injection volume was adjusted to body weight daily, this dose has been shown to be effective.23 Dapa (1.5 mg/kg/day, Sigma), a dose previously described24 was mixed with the HFD chow.
2.4 Fasting glucose levels and glucose tolerance
After 12 h of fasting, fasting blood glucose levels were measured using an Accu-Chek Aviva glucose analyser (Roche Diagnostics) in Week 12. A subset of mice was subjected to an oral glucose tolerance test (OGTT) in Weeks 8 and 12 (n = 7–8 per group). After 12 h of fasting mice were administered an oral bolus of glucose (2 g/kg) and repetitive tail vein blood samples were obtained a multiple time points (time from glucose bolus: 0 min; 15 min; 30 min; 60 min; 90 min; 120 min). To determine glucose tolerance we calculated the area under the curve (AUC) per treatment group, as published before.25
2.5 Measurements of body mass composition
Body composition (fat mass, fluid mass, and lean mass) was determined using minispec LF90II body composition analyser (Bruker Optics) 2 days prior to sacrifice. The procedure was performed according to the guidelines provided by the supplier.
2.6 Echocardiography
Three days prior to sacrifice, 2D transthoracic echocardiography [Vevo 3100 system with 40-MHz MXX550D linear array transducer (FUJIFILM VisualSonics)] was performed to assess cardiac dimensional and functional parameters, as described.20 Briefly, mice were anaesthetised with oxygen and isoflurane (2–3%), and a mouth mask was put over the nose and mouth of the mice to deliver this mixture throughout the echocardiography, which lasted 15 min. The mice were then allowed to wake up and put back in their cage. Parasternal short-axis views were obtained at left ventricular (LV) mid-papillary level. Vevo LAB software version 3.1.1 (FUJIFILM VisualSonics) was used to measure fractional shortening (FS), LV ejection fraction, LV wall thickness (LVPW), and LV dimensions (LV internal diameter in diastole, LV internal diameter in systole). LV parasternal long-axis B-mode images were obtained with 300 frames per second for offline speckle tracking analysis (VEVO strain).
Myocardial performance, and specifically myocardial deformation was determined by global longitudinal systolic strain (GLS) analysis. Reverse peak longitudinal strain rate (RPLSR) was used to measure the speed of myocardial deformation during (early) relaxation. Three consecutive cardiac cycles were analysed, and semi-automated tracing of the endocardium was performed. LV GLS and reverse strain rates were calculated using speckle tracking algorithms and frame by frame endocardial border tracking according to the guidelines provided by the supplier (VEVO systems). A blinded observer performed all measurements.
2.7 Aortic catheterization and pressure measurements
Mice were anaesthetised with oxygen and isoflurane (2–3%), and a mouth mask was put over the nose and mouth of the mice to deliver this mixture throughout the procedure. Before sacrifice, in vivo pressure measurements were performed by aortic catheterisation to measure blood pressures. A catheter (Mikro-Tip pressure catheter 1.4F, Millar Instruments, TX, USA) was inserted via the left carotid artery and aortic pressures were measured.19,26–28 Aortic maximal pressure, aortic minimal pressure, and aortic mean pressure were registered.
2.8 Tissue procurement and organ morphometry
Following aortic catheterisation, mice were anaesthetised with isoflurane and blood was collected by apical puncture, collected in EDTA tubes, spun down and plasma was stored. The thoracic cavity was opened by cleavage of the sternum, the diaphragm was cut, and the heart was excised and rinsed in icecold 1 M potassium chloride (KCl) (Merck Millipore). Right ventricle and atria were dissected from LV, and all compartments were weighed and stored separately. LV mid-ventricular transverse sections were fixed in 4% paraformaldehyde before paraffin embedding, as described previously.29 The remainder of the LV was snap-frozen for molecular analysis. Lungs were excised and their wet weight was measured. Additionally, liver, spleen, and kidneys were excised, weighed, and partly snap-frozen for molecular analyses and partly fixed in 4% neutral buffered formalin and then processed and embedded in paraffin.
2.9 Quantitative real-time polymerase chain reaction
Total RNA from LV tissue was extracted using TRI Reagent® (Sigma-Aldrich), as described.27,30 From total RNA, 0.5 μg was reverse transcribed to produce cDNA using the RNeasy Mini kit (Qiagen Inc., Valencia, CA, USA). cDNA was subjected to quantitative real-time polymerase chain reaction (PCR) using the C1000 Thermal Cycler CFX384 Real-Time PCR Detection System (Bio-Rad) using iQ SYBR green super mix (Bio-Rad). Quantification of gene expression levels was performed with Bio-Rad CFX Manager 2.0. All gene expression levels were normalised to the reference gene 36B4 and were presented as fold change to the control group. Primer sequences that were used for quantitative PCR analyses are displayed in Supplementary material online, Table S3.
2.10 Immunohistochemistry on paraffin-embedded LV tissues
Mid-transverse LV sections, kidney sections, and lung sections were processed and prepared according to previously described protocols. 19,27,31Paraffin-embedded LV tissues were cut into 4 μm sections for histological analyses. Stained sections were automatically scanned using a Nanozoomer 2.0-HT digital slide scanner (Hamamatsu, Japan).
To quantify fibrosis, Masson trichrome staining was performed. The amount of fibrosis per section was determined using Aperio’s ImageScope software and was quantified as percentage of the entire section at 40× magnification as described.28
Capillary density was determined with antibodies against CD31 with subsequent incubation of IgG secondary antibodies coupled to peroxidase followed by diaminobenzidine staining. Total amount of capillaries was quantified per mm2. Capillary density was calculated by manually counting five squares of 100 µm2 in stained sections using Aperio’s ImageScope software.
Pulmonary vasculature remodelling was determined using Verhoeff-Van Gieson staining kit (Sigma-Aldrich), as per manufacturer's instructions.31
2.11 Immunofluorescence on paraffin-embedded LV tissues
Cardiomyocyte cross-sectional area (CSA) (µm2) was visualized with immunofluorescent with germ agglutinin fluorescein isothiocyanate (Sigma-Aldrich) staining. Fluorescent images were made at 20× magnification using a Leica AF6000 microscope. CSA was measured of ±30–50 cardiomyocytes per animal, using Fiji software. The observer were blinded to the conditions.
2.12 Plasma biomarkers
The O-Link mouse exploratory panel (Olink Proteomics, Uppsala, Sweden) was used to measure plasma levels of 92 proteins in a broad range of biological function and pathways. Measurement of these 92 biomarkers was performed using a validated proximity extension assay. The protein concentrations were reported as normalized protein expression (NPX), which are relative units on a log2-scale. The abbreviations, full names, and uniProt ID-codes of the 92 biomarkers are presented in Supplementary material online, Table S4. The difference in biomarker levels between groups was compared using Mann–Whitney tests and expressed as log2-fold change values. For biological relevance a cut-off of 0.5-fold change was chosen. The P-values were corrected for multiple comparisons using the Benjamini–Hochberg and Bonferroni method with a false discovery cut-off of 5%. These analyses were carried out using R v.3.6.0. Plasma levels of growth differentiation factor 15 (GDF-15), fibroblast growth factor 21 (FGF-21), vascular endothelial growth factor, tissue inhibitor of metalloproteinases 1 (TIMP-1), and P-selectin were measured using multiplex assays (Luminex R&D systems) according to manufacturer's instructions.
2.13 RNA-sequencing
RNA was extracted from pulverized LV tissue using Lysing matrix D beads (MP Biomedicals) and standard TRIzol extraction (ThermoFisher scientific). RNA quality was determined using RNA Pico Chips on Bioanalyzer 2100 (Agilent) and TruSeq stranded mRNA libraries (Illumina) were generated from high-quality total RNA (RNA integrity number > 8.0). Samples were subjected to single-end sequencing on Next Seq 500 platform (Illumina). Reads were aligned to mouse reference genome (mm10) using STAR 2.4.2a32 and read count analysis was performed using htseq-count 0.6.1.33 Differential expression analysis was performed using DeSeq2 1.24.0.34 Gene set enrichment analysis (GSEA) was performed using Fgsea 1.10.035 and MsigDB v6.2.36 GSEA gene ontology terms with focus on biological process and Kyoto Encyclopedia of Genes library annotation were used. The analysed data can be found in NCBI GEO, GSE153923.37
2.14 Statistical analysis
All values are presented as means ± standard errors of the mean. Normality of data was tested with the Shapiro–Wilk test. Grubbs test was performed to identify statistically significant outliers, and outliers were removed if appropriate. One-way analysis (ANOVA), followed by the Tukey test was performed for multi-group comparison. Kruskal–Wallis test was done for multi-group analysis for variables that were not-normally distributed, followed by Mann–Whitney U test to correct for intra-group comparisons. All statistical analyses were performed using GraphPad Prism version 7.02 or SPSS version 23. A P-value of <0.05 was considered statistically significant.
3. Results
3.1 A combination of HFD and ANGII infusion results in cardiometabolic dysregulation with impaired glucose handling and obesity
HFD resulted in a steep and significant increase in body weight within 8 weeks (+60%, P < 0.001) (Figure 1B and C). This increase was mostly due to a significant increase in fat mass (CTRL: 7.76 ± 0.7 g and HFD: 24.70 ± 1.2 g P < 0.001) (Figure 1B). HFD also impaired glucose handling, resulting in higher glucose levels during OGTT (AUC 1100 and 1569, respectively) and significantly elevated fasting glucose levels (Figure 1D and E). Concomitant infusion of ANGII (during an HFD) did not affect body weight or glucose levels (Figure 1B and E).
3.2 Combination of HFD + ANGII results in concentric hypertrophy with preserved FS and diastolic dysfunction
None of the perturbations HFD or ANGII or HFD + ANGII impaired FS (Figure 2A). A single perturbation of either HFD or ANGII induced concentric hypertrophy, and this remained in the HFD + ANGII group (Figure 2B and C). However, in the HFD + ANGII group concentric hypertrophy was even more pronounced and deformation of the myocardium (GLS) was most impaired in this group (CTRL vs. CTRL + ANGII P = 0.007, CTRL vs. HFD + ANGII P < 0.001) (Figure 2D). The combination of HFD + ANGII also reduced myocardial deformation in diastole (RPLSR) and especially the combination of both perturbations resulted in marked diastolic dysfunction (P = 0.009) (Figure 2E).
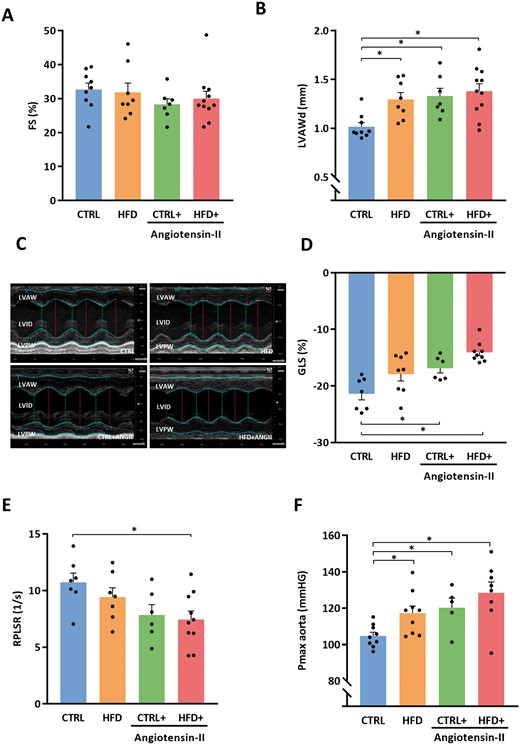
Combination of HFD + ANGII results in a phenotype of concentric LV hypertrophy with preserved FS and diastolic dysfunction. (A) FS (systolic function) (n = 7–11 mice per group). (B) LVAWd (n = 7–11 mice per group). (C) Representative M-mode echocardiographic images of LV. (D) GLS as marker of myocardial deformation per treatment group (n = 6–9 mice per group). (E) Quantification of RPLSR as marker of diastolic function (n = 6–10 mice per group). (F) Pmax aorta measured by intracardiac pressure measurements (n = 5–9 mice per group). FS, fractional shortening; LVAWd, left ventricular anterior wall thickness in diastole; RPLSR, reverse peak longitudinal strain rate; GLS, global longitudinal strain; CTRL, control chow; CTRL + ANGII, angiotensin II treated group on control chow; HFD, high-fat diet; HFD + ANGII, angiotensin II treated group on high-fat diet; Data are presented as mean + standard errors of the mean. *Kruskal–Wallis test followed by Mann–Whitney U test P <0.05 is considered significant.
3.3 Mice subjected to HFD and ANGII infusion have significantly elevated blood pressure, as well as higher LV weights, atria weights, and lung weights
LV weight increased due to HFD (Figure 3A), while atrial weights were not influenced by single perturbations with HFD or ANGII infusion (Figure 3B). Lung weight increased after ANGII infusion, but not in HFD alone (Figure 3C). The combinatorial model of HFD + ANGII consistently increased lung weights and atria weights and maximal aortic pressure (Figure 3F and Supplementary material online, Table S1B).
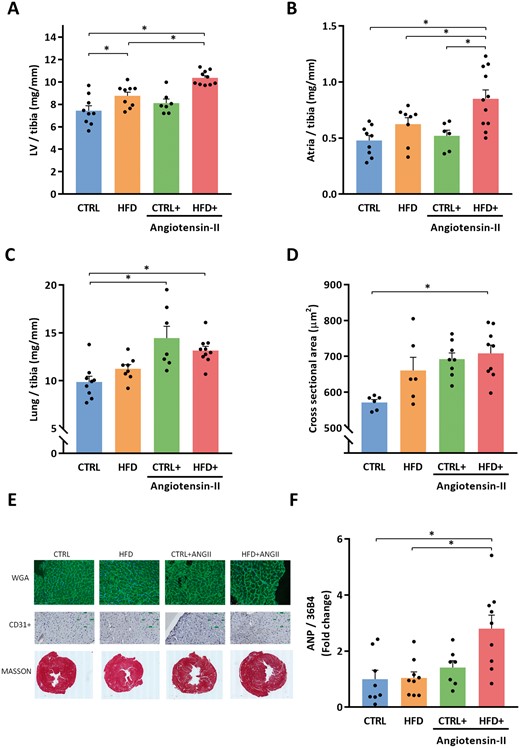
Combination of HFD + ANGII increases left ventricular, atrial and pulmonary weights and increased myocardial cross-sectional area, and cardiac stress marker ANP. (A) LV/tibia, left ventricle weight corrected for tibia length (n = 7–10 mice per group). (B) Atria weight/tibia length (n = 6–11 mice per group). (C) Lung weight/tibia length (n = 7–10 mice per group). (D) Cross-sectional area of cardiomyocytes quantified by WGA-FITC staining (30–50 cells per animal, n = 6–9 mice per group). (E) Representative images of histological staining depicting the cardiomyocyte size (WGA), capillary density (CD31+), and fibrosis (Masson). (F) LV mRNA expression levels of ANP (n = 7–9 mice per group). ANP, atrial natriuretic peptide; CTRL, control chow; CTRL + ANGII, angiotensin II treated group on control chow; HFD, high-fat diet; HFD + ANGII, angiotensin II treated group on high-fat diet. Data are presented as mean + standard errors of the mean. *Kruskal–Wallis test followed by Mann–Whitney U test P <0.05 is considered significant.
3.4 Combination of HFD + ANGII reduces angiogenesis, induces cardiac hypertrophy and is associated with significantly more cardiac fibrosis
The CSA of cardiomyocytes was significantly increased (Figure 3D and E), while the capillary density was significantly decreased in the HFD + ANGII group (Table 1, A). In addition, cardiac fibrosis and the expression of pro-fibrotic genes was significantly increased in the HFD + ANGII group compared to CTRL mice (Figure 3E and Table 1, A and B). Furthermore, atrial natriuretic peptide (ANP) gene expression levels in the left ventricle were significantly increased in the HFD + ANGII group (Figure 3F).
Histology and RNA expression
| CTRL | HFD | CTRL + ANGII | HFD + ANGII | |
|---|---|---|---|---|
| A) Histology | n = 8 | n = 8 | n = 7 | n = 9 |
| LV fibrosis (fold change) | 1.0 ± 0.1 | 1.0 ± 0.1 | 1.4 ± 0.1 | 2.1 ± 0.2a,b |
| Capillary density (number/mm2) | 25.8 ± 1.3 | 25.4 ± 0.8 | 21.3 ± 1.2 | 18.8 ± 0.9a |
| B) LV RNA expression levels | n = 8 | n = 9 | n = 7 | n = 9 |
| ANP | 1.0 ± 0.3 | 1.0 ± 0.2 | 1.4 ± 0.2 | 2.8 ± 0.5a,b |
| Col1a1 | 1.0 ± 0.1 | 1.8 ± 0.2 | 2.3 ± 0.3 | 2.7 ± 0.3a,b |
| Col3a1 | 1.0 ± 0.2 | 1.6 ± 0.2 | 1.6 ± 0.1 | 2.6 ± 0.3a,b |
| TIMP-1 | 1.0 ± 0.2 | 1.9 ± 0.4 | 3.3 ± 0.4 | 5.1 ± 0.9a,b |
| Gal-3 | 1.0 ± 0.1 | 1.1 ± 0.1 | 1.2 ± 0.1 | 2.3 ± 0.3a,b |
| IL-6 | 1.0 ± 0.5 | 0.3 ± 0.0 | 0.7 ± 0.1 | 2.4 ± 0.7 |
HFD + ANGII + SALINE | HFD + ANGII + LIRA | HFD + ANGII + DAPA | ||
| C) LV RNA expression levels | n = 13 | n = 13 | n = 13 | |
| ANP | 2.4 ± 0.5 | 0.9 ± 0.2a | 3.3 ± 0.5 | |
| Col1a1 | 2.6 ± 0.4 | 1.2 ± 0.2a | 2.5 ± 0.4 | |
| Col3a1 | 1.7 ± 0.1 | 1.1 ± 0.1a | 2.1 ± 0.2 | |
| TIMP-1 | 2.7 ± 0.5 | 1.3 ± 0.3a | 3.2 ± 0.4 | |
| Gal-3 | 2.0 ± 0.3 | 0.9 ± 0.2a | 1.4 ± 0.1 | |
| IL-6 | 2.9 ± 0.6 | 1.8 ± 0.4a | 2.8 ± 0.4 |
Data are presented as means ± standard error of the mean. (A) Histology. LV fibrosis = histological analysis of fibrosis by Masson staining. Capillary density is number of positive CD31 cells per mm2. (B and C) LV RNA expression. Gene expression was normalized to 36B4 and presented as fold change to CTRL. Statistical testing was performed with Kruskal–Wallis test followed by Mann–Whitney U test.
ANP, atrial natriuretic peptide; Col1a1, collagen 1a1; Col3a1, collagen 3a1; CTRL, control chow; CTRL + ANGII, angiotensin II treated group on control chow; Gal-3, galectin-3; HFD, high-fat diet; HFD + ANGII, angiotensin II treated group on high-fat diet; HFD + ANGII + Dapa, high-fat diet + angiotensin II with dapagliflozin treatment; HFD + ANGII + Lira, high-fat diet + angiotensin II with daily liraglutide injection; HFD + ANGII + Saline, high-fat diet + angiotensin II with daily saline injections; IL-6, interleukin-6; TIMP-1, tissue inhibitor of metalloproteinases 1.
Compared to CTRL.
Compared to HFD.
3.5 The effect of HFD + ANGII on extracardiac tissue
To determine the effect of HFD + ANGII on extracardiac tissue we analysed kidney and pulmonary tissue. Although HFD + ANGII increased gene expression levels of markers that are related to kidney injury and inflammation (KIM-1 and clusterin), there was no increase of renal fibrosis on a histological level (Supplementary material online, Figure S2). In line with these findings, we also observed no changes in altered remodelling in pulmonary vessels, as displayed by similar degrees of vascular muscularization, collagen deposition, and (neo)intimal development in all intervention groups (Supplementary material online, Figure S3).
3.6 HFD + ANGII results in inflammation and metabolic dysregulation
To better understand the effects of HFD and ANGII on the entire organism, we assessed a large panel of biomarkers. We observed that 21 plasma biomarkers were significantly changed in the HFD + ANGII group (Table 2). Among these biomarkers were pro-inflammatory and vascular calcification markers, such as TNF Receptor Superfamily Member 12A (TNFRSF12A) and vascular Osteprotegerin (TNFRSF12B), as well as apoptosis-related proteins (FAS, CASP3, SNAP23). Also, fibrosis and related secreted cytokines such as transforming growth system (TGF-B) factors, Activins (ACVRL1), and Follistatins (FSTL-3) were elevated in the HFD + ANGII group. In an additional assay (the Luminex assay) we detected several markers of inflammation and fibrosis, among which GDF-15, FGF-21, TIMP-1, and P-selectin, that were all significantly higher in the HFD + ANGII group (Supplementary material online, Figure S1).
Biomarkers profile of the HFD + ANGII group
| HFD + ANGII vs. CTRL | ||
|---|---|---|
| Biomarkers | NPX | P-value |
| EPO | 1.770 | 0.0022a |
| TNFRSF12A | 1.336 | 0.0000a |
| IL10 | 1.064 | 0.0010a |
| CASP3 | 0.946 | 0.0036a |
| SNAP29 | 0.885 | 0.0007a |
| FLI1 | 0.853 | 0.0070a |
| EDA2R | 0.845 | 0.0002a |
| GHRL | 0.833 | 0.0013a |
| PLIN1 | 0.770 | 0.0045a |
| CA13 | 0.715 | 0.0086a |
| TNFRSF11B | 0.665 | 0.0045a |
| AXIN1 | 0.663 | 0.0036a |
| GDNF | 0.564 | 0.0000a |
| ACVRL1 | 0.537 | 0.0005a |
| KITLG | 0.525 | 0.0017a |
| FSTL3 | 0.483 | 0.0000a |
| FAS | 0.475 | 0.0005a |
| APBB1IP | 0.318 | 0.0000a |
| TGFB1 | 0.311 | 0.0086a |
| LGMN | 0.290 | 0.0106a |
| IL23R | −0.485 | 0.0005a |
Significantly altered biomarkers obtained with O-link mouse panel expressed at log2 fold change. NPX are normalized protein expression (NPX) wherein a high value correspondent to higher protein expression in the HFD + ANGII group (n = 11–12 mice per group). The difference in biomarkers levels were determined on log2 fold change values by volcano plot. Statistical testing was performed with Kruskal–Wallis test followed by Mann–Whitney U test.
CTRL, control chow; HFD + ANGII, angiotensin II treated group on high-fat diet; IL, interleukin; NPX, normalized protein expression.
P-values controlled for false discovery rate using the Benjamini–Hochberg method (≤5%).
3.7 HFD + ANGII results in gene enrichment of extracellular matrix components, immune system signalling, TGF-B signalling, and energy house holding pathways
Given the differences in biomarkers levels, thereafter we performed RNA-sequencing on HFD + ANGII and CTRL heart tissues followed by Gene Set Enrichment Analysis (GSEA) to identify functional biological processes and pathways that were affected. In general, the extent of upregulated genes for the comparison of HFD + ANGII vs. CTRL group belonged to the collagen gene family. Upregulated genes in HFD + ANGII group were significantly enriched for ‘extracellular structure organization’ and ‘focal adhesion’ pathways, mostly driven by increased collagen gene family expression. Furthermore, increased expression of TGF, TNF, and tyrosine phosphatase gene families revealed enrichment of inflammatory response pathways such as ‘TGF-beta signalling’. Downregulated pathways included ‘oxidative phosphorylation’ and ‘mitochondrial respiratory chain complex’, marked by decreased expression of all components of the mitochondrial complex I–IV (e.g. SDHA, COX, NDUF, and UQCRC1). A full list with top 25 of enriched pathways and the lead edge genes can be found in Supplementary material online, Table S5.
Given the unfavourable metabolic and inflammatory profile we observed in our model we decided for treatment with metabolic modulators, i.e. the GLP-1 RA Lira and the SGLT2i Dapa.
3.8 Effects of Lira and Dapa on food intake, body weight and fat mass, and plasma glucose levels
Treatment with Lira reduced body weight with 30%, mainly by a decrease in fat mass, whereas treatment with Dapa slightly reduced body weight (Figure 4A and B). All mice had an average food intake of 3 g/day of the CTRL or HFD diet, respectively. During the first days of Lira treatment, mice ate less. This however normalized to the average food intake after 7-10 days. In contrast, food intake remained unchanged in Dapa treated mice. Treatment with Lira and Dapa improved insulin sensitivity and glucose tolerance and significantly lower fasting glucose levels as compared to non-treated mice (Figure 4D and E).
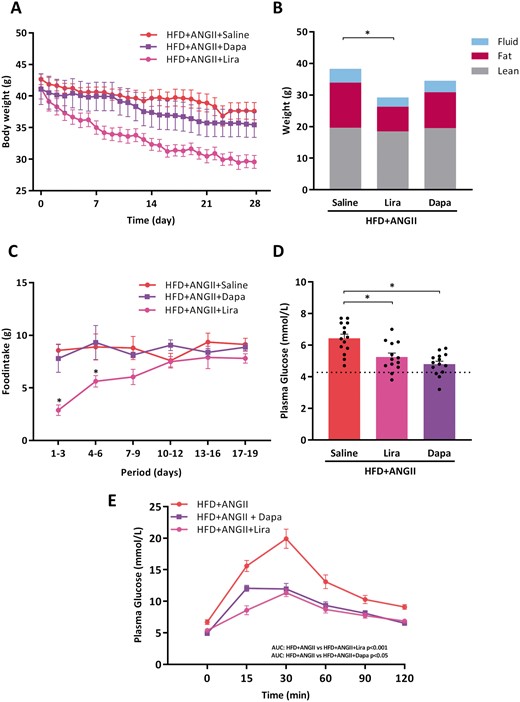
Effects of Lira and Dapa on body weight, glucose tolerance test, and food intake. (A) Body weight from start of treatment over time (days) (n = 13–14 mice per group). (B) Body mass composition (fluid, fat, lean mass) measured by minispec LF90II body composition analyser (n = 13–14 mice per group). (C) Total food intake per 3 days (n = 13–14 mice per group). (D) Fasting glucose levels per group measured 2 days before sacrifice (n = 13–14 mice per group). Dotted line represents control reference value. (E) Plasma glucose levels over time (min) after glucose loading (2 g/kg body weight) in an oral glucose tolerance test (n = 9–10 mice per group). To determine glucose tolerance, we calculated area under the curve (AUC) per treatment group. LBM, Lean, fat and fluid Body Mass Measurements; dotted lines represents control reference values; HFD + ANGII + Dapa, high-fat diet + angiotensin II with dapagliflozin treatment; HFD + ANGII + Lira, high-fat diet + angiotensin II with daily liraglutide injection; HFD + ANGII + Saline, high-fat diet + angiotensin II with saline injections. Data are presented as mean + standard errors of the mean. *Kruskal–Wallis test followed by Mann–Whitney U test P <0.05 is considered significant.
3.9 Effect of treatment with Lira and Dapa on cardiac function and structure
Figure 5A–C displays the effect of Lira or Dapa on echocardiography parameters of cardiac structure and function. We validated that FS remains normal in untreated HFD + ANGII mice, and this remained unchanged after treatment with Lira or Dapa (Figure 5A). LVPW was reduced in Lira treated mice compared to untreated animals (Figure 5B). Wall thickness did not significantly change in Dapa-treated animals. GLS (Figure 5C) was reduced in untreated mice and was improved both in Lira-treated mice and Dapa-treated mice.

Effects of treatment with Lira or Dapa on cardiac function, cardiac structure, and cardiac remodelling. (A) FS (systolic function) (n = 8–13 mice per group). (B) LVAWd (n = 12–14 mice per group). (C) GLS as marker of myocardial deformation (n = 9–13 mice per group). (D) LV/tibia, left ventricle weight corrected for tibia length (n = 13 mice per group). (E) Atria/tibia = atria weight corrected for tibia length (n = 13–15 mice per group). (F) Lung weight/tibia length (n = 13–14 mice per group). FS, fractional shortening; GLS, global longitudinal strain; LVAWd, left ventricle anterior wall thickness in diastole; dotted lines represents control reference values; HFD + ANGII + Dapa, high-fat diet + angiotensin II with dapagliflozin treatment; HFD + ANGII + Lira, high-fat diet + angiotensin II with daily liraglutide injection; HFD + ANGII + Saline, high-fat diet + angiotensin II with saline injections . Data are presented as mean + standard errors of the mean. *Kruskal–Wallis test followed by Mann–Whitney U test P <0.05 is considered significant.
3.10 Effect of treatment with Lira on cardiac hypertrophy and lung congestion
Treatment with Lira significantly reduced LV, atrial weight, and lung weights (Figure 5D–F), Treatment with Dapa did not attenuate LV, nor atrial, nor lung weights. Lira reduced mRNA gene expression levels of ANP compared to controls, while Dapa did not (Table 1, C). Lira reduced fibrosis and pro-inflammatory genes in our HFpEF mouse model (Table 1, C).
3.11 Treatment with Lira attenuates cardiac hypertrophy and reduces the amount of fibrosis
We observed a reduced amount of cardiac fibrosis in mice treated with Lira or Dapa (Figure 6A and D). Treatment with Lira also increased capillary density (Figure 6B and D) with a concomitant decrease in cardiomyocyte size (Figure 6C and D). Treatment with Dapa had no effect on capillary density or cardiomyocyte size (Figure 6B–D).
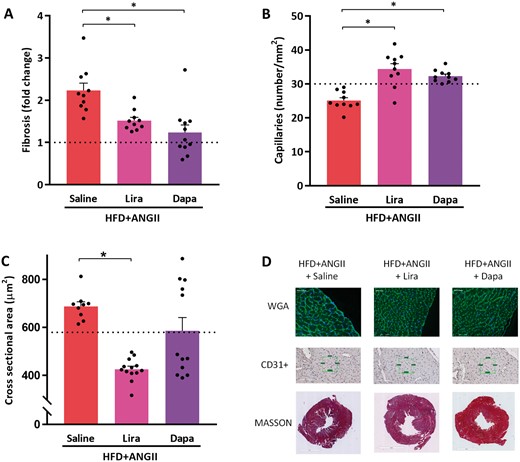
Treatment effects of Lira or Dapa on cardiac fibrosis and cardiac hypertrophy. (A) Histological analysis of fibrosis, expressed in fold-change compared to reference control values (n = 10–11 mice per group). (B) Capillary density determined by number of capillaries per mm2 positive stained by CD31+ (n = 10 mice per group). (C) Cross-sectional area of cardiomyocytes quantified by WGA-FITC staining (30–50 cells per animal, n = 9–13 mice per group. (D) Representative images of histological staining depicting the cardiomyocyte size (WGA), capillary density (CD31+), and fibrosis (Masson). Dotted lines represents control reference values; HFD + ANGII + Dapa, high-fat diet + angiotensin II with dapagliflozin treatment; HFD + ANGII + Lira, high-fat diet + angiotensin II with daily liraglutide injection; HFD + ANGII + Saline, high-fat diet + angiotensin II with saline injections. Data are presented as mean + standard errors of the mean. *Kruskal–Wallis test followed by Mann–Whitney U test P <0.05 is considered significant.
4. Discussion
We describe the development of a multiple hit mouse model of HFpEF. We combined a number of perturbations, including advanced age, female sex, and an HFD with ANGII infusion (1.25 mg/kg/day). The combination of these factors resulted in a cardiometabolic HF phenotype that resembles the human HFpEF phenotype to a large extent. Specifically, this multifactorial model resulted in concentric LV hypertrophy, elevated blood pressure, increased LV fibrosis, and collagen deposition, with functionally preserved FS, but reduced diastolic function; as well as left atrial enlargement, pulmonary congestion, and raised natriuretic peptides—all hallmarks of clinical HFpEF. Furthermore, this model induces a cardiometabolic unfavourable profile including obesity and impaired glucose handling and metabolic dysregulation. Additionally, in this cardiometabolic HFpEF mouse model, we demonstrate that treatment with the GLP-1 RA Lira attenuated the cardiometabolic dysregulation. Lira improved GLS, reduced cardiac hypertrophy, and reduced atrial weights, fibrosis, and inflammation and attenuates pulmonary congestion. The SGLT2i Dapa also improved GLS and tissue fibrosis, but had less clear effects on cardiac structure or function.
Although HFpEF is no longer synonymous with diastolic HF we performed echocardiographic characterization of diastolic function in our model. A recent paper of Schnelle et al.38 showed that the routine assessment of E/A and E/e′ ratio in the mouse heart is unreliable, given that the E and A peaks are often fused with high heart rate. E/e′ prime was also reported to be difficult to assess and highly variable. On the other hand, GLS and RPLSR were identified as the preferred indices of diastolic dysfunction in the mouse and human heart.39–41 The impaired GLS and RPLSR, in combination with atrial enlargement, concentric LV hypertrophy and fibrosis, and lung congestion, as detected in our mouse model, are in accordance with contemporary clinical HFpEF criteria as commonly observed.42–44
HFpEF is a multifactorial disease which aetiology is not fully understood. Although HFpEF patients can have various phenotypes, they do share several common cardiac features including impaired diastolic function with increased fibrosis. But many patients also have extracardiac manifestations such as T2DM and obesity.6 Therefore, the importance of a combinatorial definition is recognized by the two most recent HFpEF scores.45,46 When we compared our model with the American H2FPEF score (Table 3) our model recapitulates obesity, advanced age, elevated blood pressure, and diastolic dysfunction. Mice do not spontaneously develop atrial fibrillation or pulmonary hypertension, so these criteria cannot be met in murine models. Also, according to HFA–PEFF score our model scores a definite diagnosis of HFpEF (5 points, Table 3), with abnormalities in all the three categories of this score: functional abnormalities (abnormal GLS), structural remodelling (LV hypertrophy and atrial enlargement), and elevated natriuretic peptides.46
Comparison of clinical diagnostic criteria with the HFpEF model
| Clinical diagnostic criteria | Features of the mouse model | |
|---|---|---|
| H2FPEF score45 | ||
| Obesity | ✓ | Increased body weight |
| Atrial fibrillation | x | Not applicable |
| Age >60 | ✓ | Female >18 months old C57BL6/J |
| Treatment with 2 antihypertensives | x | Not applicable |
| Echocardiographic diastolic function | ✓ | Atrial weight↑ lung weight↑ and RPLSR ↓ as surrogate for E/e′ |
| Echocardiographic PASP | x | Not feasible in mice |
| HFA–PEFF score46 | ||
| Functional abnormalities | ✓ | 1 point: GLS = 14.1 (≤16%), RPLSR ↓ |
| Structural abnormalities | ✓ | 2 points: concentric LVH↑ and atrial enlargement↑ |
| Elevated natriuretic peptides | ✓ | 2 points: ANP expression↑ |
ANP, atrial natriuretic peptide; GLS, global longitudinal strain; HFpEF, heart failure with preserved ejection fraction; LVH, left ventricle hypertrophy; PASP, pulmonary arterial systolic pressure; RPLSR, reverse peak longitudinal strain rate measured during early filling.
So far, preclinical HFpEF models have mainly focused on the use of single perturbations to mimic the human HFpEF phenotype, and these models have struggled with reproducibility of the myriad of symptoms HFpEF has in humans. For example, a pressure overload model such as transverse aortic constriction results in hypertension and diastolic dysfunction, but this initial diastolic impairment with concentric hypertrophy progresses towards a phenotype of LV dilatation and systolic dysfunction within 4–8 weeks, and such a progression is not typical for the natural course of HFpEF in humans.47–49 Diabetic models—such as leptin-resistant db/db mice—are characterized by obesity and T2DM, but their cardiac phenotype is rather mild when compared to humans.50,51 Additionally, it has been speculated that the acute onset of load and T2DM in these mice—in humans the onset of hypertension or T2DM progresses over decades making HFpEF development a slow process—could explain why single perturbations were not successful to induce HFpEF in experimental settings.
Exploring ageing, the model with senescence-accelerated mice (SAM) did not deliver what was hoped for: albeit a model of slow disease progress due to ageing, SAM developed diastolic dysfunction without hypertension or other comorbidities, thus not reflecting a human HFpEF state.52 Several models of diabetic cardiomyopathy have been developed to investigate the effect of diabetes on cardiac remodelling, but these models are typically useful to ascertain the contribution of a single factor to the HFpEF phenotype.50,53,54 Only recently, an interesting study from Schiattarella et al.55 described a two-hit preclinical mouse model to recapitulate the multi-organ syndrome HFpEF in humans. In this study, mice were subjected to a combination of metabolic stress (obesity and metabolic syndrome) and hypertension induced by suppression of NO synthase with L-NAME. This model differs from our model, and we cannot provide a direct head-to-head comparison between our models. We chose ANGII, as one of the hallmarks of HF is an activated renin–angiotensin–aldosterone system (RAAS). Furthermore, we added advanced age and female sex as additional risk factors for HFpEF. So, although both models may differ in how exactly the HFpEF phenoytpe is obtained, they do share a common ground in the use of multiple hits to induce this disease. We therefore thus advocate that a multifactorial model is required to induce an HFpEF phenotype that resembles the human situation.
Age is the hallmark of HFpEF and it has been demonstrated that older, obese women are at higher risk for development of HFpEF.5,56,57 It is thought that during ageing, the heart becomes more prone to remodelling, and several underlying structural and molecular changes contribute to the development of systolic and diastolic dysfunction.58 Clearly, ageing affects both sexes, and HFpEF also presents in male patients. Therefore, we also subjected male mice to our multi-hit HFpEF model. We observed that aged male mice developed a phenotype that has characteristics of HFrEF, with features of eccentric remodelling, such as LV dilatation and reduced systolic function (Supplementary material online, Figure S3). Therefore, the use of aged female mice appears to result in a phenotype that better mimics the human clinical reality.59 We did not study sex-specific effects in detail, and future studies should identify factors that explain the propensity of female sex towards the HFpEF phenotype, and the propensity of male sex towards HFrEF.
We showed that on a molecular level, our HFpEF phenotype involves genes associated with pathways of fibrosis, inflammation, lipid metabolism, and mitochondrial energy house holding. This is in accordance with observations in humans and these pathways can thus be considered crucial for the development of a cardiometabolic HFpEF phenotype.60,61 Treatment of HFpEF, however, remains challenging as there are no drugs have been shown to effectively reduce morbidity or mortality, and no treatment is recommended in treatment guidelines. Our data reveal that inflammation, fibrotic pathways, and metabolic pathways are involved in the cardiometabolic HFpEF phenotype. Therefore, we hypothesized that targeting these pathways could be a novel and successful intervention strategy. Interventions that target glycaemic control and food intake may attenuate the unfavourable cardiometabolic profile described by us and could potentially exert protective effects on cardiac remodelling to improve the HFpEF phenotype.
GLP-1 is an incretin hormone that is primarily produced in intestine cells. It has an important role in postprandial metabolism, by regulating glucose metabolism through increased insulin-release, inhibiting glucagon secretion, but also regulation appetite and food intake. Although it is not entirely clear how GLP-1 RA confer their cardioprotective properties,62 it is thought that they are the result of indirect benefits that results from weight loss, but also due to direct CV effects that are initiated by vasodilation and increased natriuresis and prevention of cardiac fibrosis.63–66 In line with our results, Bizino et al.67 showed that in humans with T2DM, treatment with Lira unloaded the left ventricle, improved diastolic function, and exerted anti-atherosclerotic effects through an anti-inflammatory mechanism.63 At baseline, these subjects were without HF, albeit at high risk for new-onset HF. The authors from this study speculated that treatment with Lira may postpone onset of HFpEF as it may delay the onset of diabetic cardiomyopathy. These results therefore warrant larger studies that unravel the potential CV benefits of GLP-1 RA in patients with HFpEF with and without T2DM. The ongoing SELECT study will address if semaglutide (an analogue of Lira with a longer half-life) is effective in reducing CV end points, including HF outcomes (NCT03574597).
Dapa is an SGLT2i and acts by inhibiting glucose reabsorption in the proximal tubule of the kidney.68 This results in glycosuria, and a subsequent increase in diuresis. The recent DAPA-HF trial showed that treatment with Dapa, in diabetic and non-diabetic patients with HFrEF, improved HF outcomes.69 Tanaka et al.70 previously showed that improvement of diastolic parameters (GLS and E/e′) in patients with T2DM and chronic HF may be achieved with Dapa, and our data validate this effect in a mouse model. In our study, Dapa lowered glucose levels but did not substantially lower body weight. Likely, in our model, modulation of the primary drivers is necessary to reverse the phenotype. Since female sex and advanced age are clearly not amenable, targeting either the ANGII derived signalling or the obesity is needed at the least to reverse the phenotype. Treatment with Dapa reduced histological fibrosis, as reported by others,71,72 but this effect however, was not paralleled by decreases in pro-fibrotic genes. Since myocardial fibrosis is an extremely dynamic and complex phenomenon,73 the effects of Dapa on fibrosis requires further study. The efficacy of SGLT2 inhibitors is, at least, partly explained by their natriuretic actions. The beneficial effect of Dapa may rather be the result of improved volume homeostasis than due to structural improvements in the heart.74 In our model we have used ANGII to induce high blood pressure, but associated increased sodium retention may have attenuated the efficacy of the SGLT2-inhibitor. In human trials, however, it has been suggested that the beneficial effects of SGLT2 inhibitors are achieved independent from RAAS activation.75 We therefore believe that the use of this dose of ANGII in our multifactorial model, if any, will only have had a very limited effect on the efficacy of Dapa. Alternatively, the brief period of treatment may have been too limited to demonstrate the long-term beneficial effects of Dapa. The ongoing DELIVER trial (NCT03619213) will show if Dapa exerts beneficial effects in patients with HFpEF.
4.1 Limitations
In this study, we used a multiple hit model to induce HFpEF that resembles human HFpEF. Although we were able to design and develop a model that includes ageing, obesity, impaired glucose handling, and female sex, the model is still not representative for the entire spectrum of HFpEF patients. The number of comorbidities in humans with HFpEF often is even larger. For example, HFpEF patients oftentimes suffer from chronic obstructive pulmonary disease and atrial fibrillation, both diseases we could not include. As always, experimental models are limited to the factors that they include. However, we do believe that this model has translational value since it is one of the first that uses multiple perturbations to induce HFpEF, and—as far as we know—is the first to include advanced ageing and female sex.
We did not acquire invasive left ventricle haemodynamics, and as a result we cannot relate the abnormalities in our model to absolute intracardiac pressure levels.19,26–28
Although capillary density was reduced in our model, we did not measure myocardial blood flow.
Sham surgery was performed without placement of a saline-filled mini-pump. Previous studies, comparable to the sham surgeries performed in this experiment, have already revealed that implantation of saline-filled mini pumps does not cause differences in function or molecular signature of the heart.20,22,28
Another limitation of this study is that we only used aged female mice that underwent several perturbations to induce HFpEF. In patients, the HFpEF phenotype is more often found in ageing women and less common in ageing men,76 but future studies are required to investigate potential sex-specific effects.
Mice that were treated with Lira had a reduced food intake and weight loss during the first part of the experiment. Already after 1 week, food intake normalized and food intake became comparable with other groups. We cannot rule out the observed effects of Lira may be explained by caloric restriction. Previous studies, however, have repeatedly shown that the beneficial effects of Lira are independent of weight loss, as Lira also exerts cardioprotective effects in a lower dose that not affects food intake.77,78
4.2 Future perspectives
To date, large randomized trials that aimed to improve morbidity and mortality in HFpEF have been disappointing. Nevertheless, since prevalence of HFpEF is still rising and this HF-subtype is expected to become the major HF-subtype, novel therapeutic strategies are urgently needed. In this study, we show that treatment with the GLP-1 RA Lira (to a large extent) and the SGLT2i Dapa (to a lesser extent) exert cardioprotective effects in a cardiometabolic driven HFpEF mouse model, through modulation of its unfavourable cardiometabolic profile. This provides background for the development of future studies that focus on cardiometabolic HFpEF. Furthermore, in-depth studies are needed to unravel the mechanisms how cardiometabolic dysregulation is associated with the development of HFpEF.
Our cardiometabolic HFpEF model is a preclinical mouse model with enhanced fibrotic and inflammatory state. Systemic chronic inflammation is thought to play an important role in HFpEF79,80 and is hypothesized that anti-inflammatory and anti-fibrotic therapies could also improve HFpEF outcomes. The development of this model may help to design future studies that can be used to evaluate the effect of anti-inflammatory and anti-fibrotic drugs on HFpEF development.
5. Conclusions
In conclusion, we describe a multifactorial cardiometabolic mouse HFpEF model that reflects human HFpEF. This model is unique in its kind, and relies upon multiple perturbations including HFD, ANGII infusion on top of advanced aged and female sex. The combination of perturbations showed herein advocates the use of multiple hit models to achieve translational capacity. Moreover, in this cardiometabolic HFpEF mouse model, treatment with the GLP-1 RA Lira improved cardiometabolic dysregulation, cardiac structure, and function. The SGLT2i Dapa also improved cardiac function and tissue fibrosis, but had no ancillary effects on cardiac structure.
Data availability
The data underlying this article are available in the article and in its online supplementary material. The RNA-sequencing data are available in NCBI GEO, and can be accessed with GSE153923.37
Supplementary material
Supplementary material is available at Cardiovascular Research online.
Authors’ contributions
C.W. and R.A.d.B. conceived the study and study design. C.W. performed the experiments. L.M.G.M. and H.H.W.S. contributed to the main conceptual ideas and proof outline and supervised the work. G.M.-M. analysed the plasma biomarker profile data. C.J.B. performed the RNA-sequencing and helped to analyse results. E.M.S. carried out animal experiments. M.M.D. performed immunohistochemical staining and analysis. A.A.V., B.D.W., and C.S.P.L. interpreted results and provided important intellectual input to the manuscript. All authors discussed the results and provided important intellectual input to the manuscript. All authors read and approved the final version of the manuscript.
Acknowledgements
We would like to thank Noa Keijzer and Esther Haan for excellent technical assistance.
Conflict of interest: The UMCG, which employs the authors (except Dr. Boogerd) has received research grants and/or fees from AstraZeneca, Abbott, Bristol-Myers Squibb, Novartis, Novo Nordisk, and Roche. Dr. de Boer received speaker fees from Abbott, AstraZeneca, Novartis, and Roche. C.S.P.L. is supported by the University of Groningen (Rosalind Franklin fellow), and by a Clinician Scientist Award from the National Medical Research Council of Singapore; has received research support from Boston Scientific, Bayer, Roche Diagnostics, AstraZeneca, Medtronic, and Vifor Pharma; has served as consultant or on the Advisory Board/Steering Committee/Executive Committee for Boston Scientific, Bayer, Roche Diagnostics, AstraZeneca, Medtronic, Vifor Pharma, Novartis, Amgen, Merck, Janssen Research & Development LLC, Menarini, Boehringer Ingelheim, Novo Nordisk, Abbott Diagnostics, Corvia, Stealth BioTherapeutics, JanaCare, Biofourmis, Darma, Applied Therapeutics, MyoKardia, Cytokinetics, WebMD Global LLC, Radcliffe Group Ltd, and Corpus; and serves as co-founder and non-executive director of eKo.ai. The UMCG, which employs A.A.V. has received research grants and/or consultancy fees from Amgen, AstraZeneca, Bayer, Boehringer Ingelheim, Cytokinetics, Merck, MyoKardia, Novartis, Novo Nordisk, Roche Diagnostics. A.A.V. has received consultancy fees from MyoKardia, Bayer, AstraZeneca, Merck, and Boehringer Ingelheim. B.D.W is supported by The Netherlands Organization for Scientific Research (NWO VENI, grant 016.176.147) and the Netherlands Heart Foundation Senior Clinical Scientist Grant (2019T064).
Funding
C.S.P.L. and C.W. are supported by a grant of the UMC Groningen (Rosalind Franklin Fellowship). This work was supported by Novo Nordisk that provided us liraglutide. Aged mice were provided by Gerald de Haan and Ronald van Os through the Mouse Clinic for Cancer and Aging (MCCA), funded by a Large Infrastructure grant from the Netherlands Organization for Scientific Research (NWO). This work was further supported by the Netherlands Heart Foundation (CVON DOSIS, grant 2014-40, CVON SHE-PREDICTS-HF, grant 2017-21; CVON RED-CVD, grant 2017-11; and CVON PREDICT2, grant 2018-30); and the Innovational Research Incentives Scheme program of the Netherlands Organization for Scientific Research (NWO VIDI, grant 917.13.350), by a grant from the leDucq Foundation [Cure PhosphoLambaN induced Cardiomyopathy (Cure-PLaN)] and the European Research Council (ERC CoG 818715, SECRETE-HF). C.J.B. received funding from the European Union’s Horizon2020 research and innovation program under the Marie Skłodowska-Curie grant agreement No 751988.
References
Withaar C, Meems LMG, Markousis-Mavrogenis G, Boogerd CL, Silljé HHW, Schouten EM, Dokter EM, Voors AA, Westenbrink BD, Lam CSP, de Boer RA de. The effects of liraglutide and dapagliflozin on cardiac function and structure in a multi-hit mouse model of heart failure with preserved ejection fraction. 2020. NCBI GEO, GSE153923. https://www.ncbi.nlm.nih.gov/geo/query/acc.cgi?acc=GSE153923 (7 July 2020, date last accessed).
The failure of many treatment modalities for heart failure with preserved ejection fraction (HFpEF) may—at least in part—be explained by the lack of an adequate animal model. The diverse aetiology of HFpEF is still largely neglected in preclinical research. In this study, we developed a murine model that includes advanced age, female sex, in concert with comorbidities: elevated blood pressure, obesity, and type 2 diabetes mellitus. We demonstrate that this model recapitulates the human cardiometabolic HFpEF phenotype. We showed that contemporary glucose-lowering drugs, liraglutide, and dapagliflozin, which are both under study for HFpEF, have positive results. Our model may be useful to evaluate novel cardiometabolic, anti-fibrotic, and anti-inflammatory treatments for HFpEF.
