


Abstract
Several inherited arrhythmic diseases have been linked to single gene mutations in cardiac ion channels and interacting proteins. However, the mechanisms underlying most arrhythmias, are thought to involve altered regulation of the expression of multiple effectors. In this study, we aimed to examine the role of a transcription factor (TF) belonging to the Iroquois homeobox family, IRX5, in cardiac electrical function.
Using human cardiac tissues, transcriptomic correlative analyses between IRX5 and genes involved in cardiac electrical activity showed that in human ventricular compartment, IRX5 expression strongly correlated to the expression of major actors of cardiac conduction, including the sodium channel, Nav1.5, and Connexin 40 (Cx40). We then generated human-induced pluripotent stem cells (hiPSCs) derived from two Hamamy syndrome-affected patients carrying distinct homozygous loss-of-function mutations in IRX5 gene. Cardiomyocytes derived from these hiPSCs showed impaired cardiac gene expression programme, including misregulation in the control of Nav1.5 and Cx40 expression. In accordance with the prolonged QRS interval observed in Hamamy syndrome patients, a slower ventricular action potential depolarization due to sodium current reduction was observed on electrophysiological analyses performed on patient-derived cardiomyocytes, confirming the functional role of IRX5 in electrical conduction. Finally, a cardiac TF complex was newly identified, composed by IRX5 and GATA4, in which IRX5 potentiated GATA4-induction of SCN5A expression.
Altogether, this work unveils a key role for IRX5 in the regulation of human ventricular depolarization and cardiac electrical conduction, providing therefore new insights into our understanding of cardiac diseases.

1. Introduction
Inherited cardiac arrhythmias account for ∼20% of sudden cardiac deaths. Only a small portion of these arrhythmias are monogenic familial diseases, having been successfully linked to rare mutations in cardiac ion channels and related proteins.1 However, pathogeny of inherited cardiac arrhythmias is increasingly thought to be based on complex mechanisms involving polygenic inheritance and/or altered regulation of the expression of multiple effectors.2 In this context, investigating how dysfunction of transcriptional regulators participates in the mechanism of these diseases is of major importance.
The regulation of cardiac electrical transcriptional programme, including ion channels and gap junctions, is a major determinant of proper initiation and propagation of action potential (AP) through the cardiac muscle. In animal models, several transcription factors (TFs) are implicated in cardiac electrical activity and arrhythmias,3 including members of the Iroquois (IRX) family of TFs.4
Autosomal recessive mutations in IRX5, an IRX homeobox TF, is linked to Hamamy syndrome (HMMS, OMIM611174), an inherited congenital disorder. The patients’ cardiac clinical phenotype combines bradycardia and QRS complex prolongation, reflecting a delayed ventricular electrical conduction.5,6 Surprisingly, in mice, deletion of Irx5 leads to a different phenotype, a ventricular repolarization defect, due to the role of Irx5 in controlling potassium channel gene expression.7 Inversely, another murine member of the Irx family, Irx3, is essential for fine regulation of intercellular coupling within the ventricular conduction system, through the regulation of connexins expression.8,9 This suggests that distinct regulatory pathways govern the differences between human and animal cardiac electrical physiology.
In this study, our goal was to decipher whether IRX5 controls human cardiac electrical activity. First, correlative transcriptomic analyses between IRX5 and cardiac electrophysiology genes in human cardiac tissues, suggested that IRX5 may regulate several major actors of cardiac conduction. Then, human-induced pluripotent stem cells (hiPSCs) derived from HMMS patients carrying IRX5 mutations were used to elucidate the role of IRX5 in regulating expression of these actors of cardiac conduction and to uncover a cooperative activity between TFs. This work reveals how loss-of-function (LOF) mutation in one key TF affects the expression of multiple effectors of ventricular electrical conduction and improves our understanding of cardiac disease, paving the way therefore for more effective therapies.
2. Methods
Ethical statement
The study was conducted according to the principles set forth under the Declaration of Helsinki (1989) and European guidelines for clinical and genetic research. Institutional review board approvals of the study were obtained before the initiation of patient enrolment. Regarding the patient-derived biological samples, signed informed consent allowing the experiments to be conducted have been received from all individuals. Any related health information was collected in compliance with applicable law/regulation and with any applicable policy of the ethics committee with jurisdiction over the biological sample collection. All biological samples and their related health information have been provided in coded form such that subjects cannot be identified directly. The provisions of French law, article L1110-4 of the Code de la santé publique, related to the privacy and confidentiality of information regarding patients, have been observed. The transfer of the HMMS-affected patient’s biological samples has complied with all applicable laws as well as legal, regulatory, and ethical requirements in transferring and obtaining such Material and the corresponding informed consents (Authorization IE 2009-505(1)).
2.1 Transcriptional analysis of human and murine tissues
RNA sequencing data in human heart were collected from the GTEx portal website (http://gtexportal.org). Briefly, transcripts per million were downloaded for 297 atrial and 303 ventricular available tissue samples.
Regarding murine samples, all animal experiments obtained local approval and all animal procedures follow the guidelines from Directive 2010/63/EU of the European Parliament on the protection of animals used for scientific purposes. Mice were euthanized in their home cage using CO2 inhalation. Hearts were excised from six 10-week-old C57BL/6 male mice and atria and ventricles were carefully dissected as previously described.10
Two-way hierarchical agglomerative clustering was applied to gene-expression matrices (see Section 2.5.2 below), by centring gene expression values on the values-median and using average linkage-clustering with uncentred correlation (Cluster 3.0). GTEx left ventricular tissues RNA sequencing data of cardiac sodium channels and connexins were ranked according to ascending expression of IRX5. Genes encoding sodium channel subunits and connexins that presented a median GTEx expression level in left ventricular samples >1 transcripts per million were selected. Expression correlations were tested using Pearson correlation package on R software.
2.2 hiPSC generation
Primary dermal fibroblasts were derived from skin biopsies obtained from donors of two different consanguineous families, previously described with HMMS.5,6 The first diseased donor is a 4-year-old boy, homozygous carrier of the c.448G>C IRX5 mutation (p.Ala150Pro annotated as A150P) in whom a QRS prolongation on the ECG was diagnosed. The second donor is a 17-year-old boy belonging to another family harbouring the homozygous c.498C>A IRX5 mutation (p.Asn166Lys annotated as N166K) who presents a prolonged QRS duration on the ECG, in addition to a tiny patent ductus arteriosus. In parallel, fibroblasts from three individuals lacking the IRX5 mutations were used as controls: hiPSCs were generated from an intra-familial control of the patient carrying the A150P-IRX5 mutation, his unaffected sister. hiPSCs were also generated from an extra-familial control of the patient carrying the N166K-IRX5 mutation, who has been chosen because of its match in terms of age, sex, and ethnicity to the patient. A third control hiPSC line, which was not related to both HMMS patients, and that had previously been described, has been also used.11–13 hiPSC lines were generated using Sendai virus method. For each line, two to three hiPSC clones were selected and expanded on stem cell-qualified Matrigel-coated plates (0.1 mg/mL; BD Bioscience) with StemMACS™ iPS Brew XF medium (Miltenyi Biotec).
2.3 hiPSC characterization
For all clones, genomic DNA was extracted and mutations were verified by sequencing using primers specific for the genomic regions surrounding the A150P and N166K mutations (Supplementary material online, Table S1). Pluripotency marker gene expression was assessed using flow cytometry, qRT-PCR, and immunofluorescence as previously described.11 Single nucleotide polymorphism (SNP) analysis of hiPSCs compared to their parental skin fibroblast cells was used to confirm genome integrity after reprogramming. DNA was extracted from somatic and hiPSC samples using the QIAGEN QiaAmp kit, according to the manufacturer’s recommendations. The gDNA was quantified using a nanodrop. About 200 ng of gDNA was outsourced to Integragen Company (Evry, France) for karyotype analysis using HumanCore-24-v1 SNP arrays. This array contains over 300 000 probes distributed throughout the genome with a median coverage of one probe every 5700 bases. All genomic positions were based on Human Genome Build 37 (hg19). Analysis was performed with GenomeStudio software. Chromosome abnormalities were determined by visual inspection of logR ratios and B-allele frequencies (BAF) values and comparing parental cells and hiPS-derived samples. LogR ratio, the ratio between observed and expected probe intensity, is informative of copy number variation (i.e. deletions/duplications), whereas BAF is informative of heterozygosity. SNP data were used to compute copy number variation. In particular, this type of chips allows detecting loss of heterozygosity (LOH), an important concern for hiPSC, which is not detectable with classical CGH arrays.
2.4 Differentiation of hiPSCs into cardiomyocytes
At 80% of cell confluency, hiPSC lines were passaged using Gentle Cell Dissociation Reagent (STEMCELL Technologies) and Y-27632 Rho-kinase inhibitor (STEMCELL Technologies). The matrix sandwich method was used to generate cardiomyocytes (CMs), as previously described.12 From Day 5 of differentiation, cell medium was changed every other day with RPMI-1640 medium supplemented with B27 (with insulin; Thermo Fisher Scientific). After 20–28 days following the beginning of differentiation, spontaneously beating cell clusters were mechanically isolated using a needle and then used for electrophysiological, biochemical, and molecular analyses. All experiments have been performed on at least three independent differentiations for each clone, performed on different hiPS cell passages. Data obtained from the various clones of the three control lines have been pooled and averaged and correspond to the n values provided in the figure legends. For each Hamamy patient, data obtained from the different clones have been pooled and averaged.
2.5 RNA expression
2.5.1 RNA extraction
Samples of total RNA were obtained using the NucleoSpin RNA kit (MACHEREY-NAGEL) following the manufacturer’s specifications.
2.5.2 TaqMan low-density array
TaqMan low-density array (TLDA) studies were conducted using six ventricular and six atrial control murine tissues as well as beating clusters of hiPS-CMs obtained from 12 control and 9 IRX5-mutant CM differentiations. About 1 μg of RNA was reverse transcribed into cDNA using SuperScript IV Vilo Master Mix (Thermo Fisher Scientific). For murine tissues, three specifically designed 384-well TLDA were used: one containing 4× 96 primers and probes for cardiac ion channels10 and two others, each containing a set of 4× 96 primers and probes for cardiac TFs (Supplementary material online, Table S2A). For hiPS-CMs, TLDA probe selection covered gene families implicated in cardiac ion channel expression and regulation, and CM structure (Supplementary material online, Table S2B). Genes with average Ct > 32 in all compared groups were considered undetectable and excluded from the analysis (SCN10A and ABCC8). Average Ct of remaining genes for each sample was used for data normalization.14–16
2.5.3 3′-sequencing RNA profiling
3′-Sequencing RNA profiling (3′-SRP) protocol was performed according to Kilens et al.17 Briefly, the libraries were prepared from 10 ng of total RNA. About 40 RNA samples were extracted from 8 IRX5-mutated and 13 control hiPSC samples (a duplicate for each clone obtained at different cell passages) and 19 samples of corresponding hiPS-CMs. The mRNA poly(A) tail was tagged with universal adapters, well-specific barcodes, and unique molecular identifiers during template-switching reverse transcriptase. Barcoded cDNAs from multiple samples were then pooled, amplified, and tagmented using a transposon-fragmentation approach which enriches for 3′ ends of cDNA. A library of 350–800 bp was run on an Illumina HiSeq 2500 using a HiSeq Rapid SBS Kit v2 (50 cycles; FC-402-4022) and a HiSeq Rapid PE Cluster Kit v2 (PE-402-4002). Read pairs used for analysis matched the following criteria: all 16 bases of the first read had quality scores of at least 10 and the first six bases correspond exactly to a designed well-specific barcode. The second reads were aligned to RefSeq human mRNA sequences (hg19) using bwa version 0.7.4 4. Reads mapping to several positions into the genome were filtered out from the analysis. Digital gene expression profiles were generated by counting the number of unique molecular identifiers associated with each RefSeq genes, for each sample. R package DESeq2 was used to normalize gene expression. Differentially expressed genes were finally clustered using cluster 3.0 software. Enriched biological pathways were assigned for differentially expressed genes in IRX5-mutated vs. control hiPS-CMs. For that, Reactome pathways were attributed to the most variant genes with P-value <0.05.18,19 However, genes encoding for ion channels exhibited low expression levels and therefore they were not taken into consideration for differentially expressed genes analysis. To overcome this issue, P-values for these genes were calculated based on TLDA analysis. Babelomics was then used to calculate enrichment of Reactome pathways for genes differentially expressed in both TLDA and 3′-SRP analyses. Finally, enrichment scores (ES) were calculated.20,21
2.6 Protein expression and interaction
2.6.1 Protein extraction
IRX5, Nav1.5, Connexin 40 (Cx40), and GATA4 expression were evaluated in human left and right ventricular tissues obtained from three non-diseased individuals as previously described.22 Corresponding subendocardial (also containing Purkinje cells) and subepicardial tissue slices were obtained at the cardiac base and snap-frozen in liquid nitrogen. Protein expressions and interactions were also investigated in beating hiPS-CMs at Day 28 of differentiation. For protein extraction, cells were homogenized on ice using lysis buffer containing in mM: 1% Triton X-100; 100 NaCl; 50 Tris–HCl; 1 EGTA; 1 Na3VO4; 50 NaF; 1 phenylmethylsulfonyl fluoride; and protease inhibitors cocktail (P8340, Sigma-Aldrich). Extracted samples were sonicated and centrifuged at 15 000 g for 15 min at 4°C. Protein quantification was carried out using Pierce™ BCA Protein Assay Kit (Thermo Fisher). Immunoblot was finally done using the corresponding primary antibodies (Supplementary material online, Table S3).
2.6.2 Subcellular protein fractionation
To unveil the impact of IRX5 mutations on its cellular localization, nuclear, and cytosolic proteins were separated. For that, cytoplasmic membranes were disrupted on ice in a hypotonic solution including in mM: 500 HEPES, 500 MgCl2, 500 KCl, 0.1 DTT, and protease inhibitor cocktail. Cells nuclei were pelleted by 400 x g centrifugation and the supernatant contained the cytosolic fraction. In order to extract nuclear proteins, a protein extraction buffer was added to pellets followed by sonication.
2.6.3 Co-immunoprecipitation
Co-immunoprecipitation was performed to investigate protein-to-protein interactions between IRX5 and GATA4 in hiPS-CMs. A total of 12.5 μL magnetic Dynabeads® Protein G (Thermo Fisher Scientific) were added to 3 μg anti-IRX5 antibody (WH0010265M1, Sigma-Aldrich) or anti-mouse IgG antibody as control (02-6502, Thermo Fisher Scientific) and conjugated by incubation for 40 min at room temperature with rotation. The complex beads-antibody was cross-linked using 27 mg DMP (dimethyl pimelimidate, Thermo Fisher Scientific), and then incubated for 2 h with 800 µg of total lysate at 4°C. The supernatant was then discarded and the beads were washed with the lysis buffer. Proteins were eluted in 30 µL of a mixture of NuPAGE® Sample Reducing Agent (10×) and LDS Sample Buffer (4×) (Invitrogen) and heated at 60°C. The samples were then loaded onto a 4–15% precast polyacrylamide gel (Bio-Rad).
2.7 Immunofluorescence
hiPSCs or hiPS-CMs at Day 20 of differentiation were dissociated using collagenase II (Gibco) and seeded onto 8-wells iBidi plates (Biovalley) coated with Matrigel (Corning). Twelve days later, cultured cells were immunostained using a staining buffer set according to the manufacturer’s instructions (00-5523-00, Thermo Fisher Scientific). HiPS-CMs were labelled by cardiac differentiation markers or TF. Primary antibodies are listed in Supplementary material online, Table S3. DNA was highlighted using DAPI and pictures were taken using confocal microscopy (Nikon; MicroPICell core facility).
2.8 Chromatin immunoprecipitation
2.8.1 IRX5 binding sites
Promoter DNA sequences were found using Ensembl. Consensus sequences known to mediate IRX TF interaction with DNA23–25 were screened on gene promoters. Each site was verified for its conservation among species using rVista 2.0. Primers surrounding the identified conserved potential binding sites (BS) were designed using Primer 3. Corresponding primer sequences are detailed in Supplementary material online, Table S4.
2.8.2 Chromatin immunoprecipitation
At Day 28 of differentiation, beating CM clusters were isolated and crosslinked. After chromatin sonication, IRX5 antibody (WH0010265M1, Sigma-Aldrich) was added followed by the addition of protein G-coated dynabeads. Following overnight incubation, the chromatin was then eluted and reverse-crosslinked. SYBER green qRT-PCR method was finally performed using the designed primers (Supplementary material online, Table S4) to test for enrichment of the targeted sequences. Results are shown as percentage of input.
To confirm the specificity of IRX5 antibody, HEK293 cells were transfected using plasmids encoding human sequences of WT IRX5, N166K IRX5, and WT IRX3, as well as an empty pcDNA3 plasmid. Testing the potential non-specificity of IRX5 antibody towards IRX3 was performed as IRX3 and IRX5 have been shown to share a high level of transcript and protein homology,26 strong similarities in their expression pattern27 and to have coordinated functional roles.28 (i) Confirming the IRX3 protein expression in all cell samples transfected by IRX3, a band at the expected size for IRX3 (<100 kDa, as IRX3 was Myc-tagged) was indeed obtained (Supplementary material online, Figure S1). (ii) When HEK293 cells were transfected by an empty plasmid or IRX3 plasmid, as expected, on corresponding western blots with IRX5 antibody, no band was detected, demonstrating that IRX5 antibody did not bind other protein than IRX5, including IRX3. (iii) Cells were transfected by IRX5 (left panel) or IRX5-N166K (right panel) plasmids and a unique band of the expected size for IRX5 (∼100 kDa, as IRX5 was GFP-tagged) was observed, further demonstrating that the antibody specifically bound to the WT or mutated forms of IRX5 protein (Supplementary material online, Figure S1).
2.9 Cellular electrophysiology
2.9.1 Cell dissociation
hiPS-CMS were enzymatically dissociated into single cells using collagenase II (Gibco) at 37°C for 20 min. Cells were then incubated at RT for 30 min in Kraft–Bruhe solution containing (in mM): 85 KCl; 30 K2HPO4; 5 MgSO4; 20 glucose; 20 taurine; 5 Na pyruvate; 5 creatine; 2 K2-ATP; 1 EGTA; pH 7.2 adjusted with KOH. Single cells were then plated at low density on Matrigel-coated Petri-dishes (Nunc) and recorded 11–14 days after dissociation.
2.9.2 Data recording and analysis
Stimulation and data recording were performed at 37°C using an Axopatch 200B amplifier controlled by Axon pClamp 10.6 software through an A/D converter (Digidata 1440A) (all Molecular Devices). Data were analyzed using Clampfit 10.6 software. For all cell lines, data were collected from at least three independent differentiations. Experimental details regarding solutions composition are described in Supplementary material online, Table S5.
2.9.3 Current clamp
Action potential recordings were obtained using the amphotericin-B-perforated patch-clamp technique. Patch pipettes were pulled from borosilicate glass capillaries (Sutter instruments) to obtain a tip resistance of 2–3 MΩ. APs were recorded in cells that were first allowed to beat spontaneously and then paced. A stimulus of an amplitude of 30–35 pA/pF during 1 ms (in order to avoid interference with the upstroke phase of the AP) was used at various frequencies, in absence of IK1 injection (see below). Cells were classified as either ventricular-like, atrial-like, or nodal-like, based on several parameters previously described (maximum upstroke velocity, dV/dtmax; AP duration, APD; resting membrane potential, RMP).11 Only ventricular-like cells were selected for further analysis. IK1 current was not observed in hiPS-CMs (not shown), consistent with the observation of phase-4 depolarization in these cells. Without IK1, the APs RMP was about −60 mV (Figure 5B), which corresponds to immature ventricular CMs. Thus electronic expression of the inward rectifier potassium current, IK1, was realized using dynamic patch-clamp.29,30 With 2 pA/pF of in silico Ik1 injection, hiPS-CM membrane resting potential was about −80 mV, closer to physiological RMP of adult ventricular CMs. Averaged parameters were obtained from seven consecutive APs. Both cell stimulation and injection of Ik1 were realized by a custom-made software running on RT-Linux and a National Instrument A/D converter (NI PCI-6221) connected to the current command of the amplifier.
2.9.4 Voltage clamp
INa and ICa, L recordings were performed in the ruptured whole-cell configuration using voltage clamp protocol as depicted in the figures. Pipettes (Sutter instruments) with 1.7–2.5 MΩ tip resistance were waxed before use to decrease pipette capacitive currents. ICa, L, and INa recordings were low-pass filtered at, respectively, 3 and 10 kHz. Holding potentials were, respectively, −80 and −100 mV. The capacitance and series were compensated using a VE-2 amplifier (Alembic Instrument, Qc, Canada). Leak current was subtracted. Current densities were calculated by dividing the current to the membrane capacitance (Cm). Steady-state activation and inactivation curves were fitted using a Boltzmann equation: I/Imax= A/{1.0+exp [(V1/2−V)]/k} with k > 0 for the activation curve and k < 0 for the inactivation curve.
2.9.5 Action potential clamp
In order to record specific currents during AP cycles, and especially during the depolarization phase, cells membrane potential was clamped according to voltage-AP-like protocols. Representative APs acquired from spontaneously beating control hiPS-CMs with (dV/dtmax = 100 V/s; APD90 = 280 ms; RMP=−83 mV) or without (dV/dtmax = 12 V/s; APD90 = 300 ms; RMP=−57 mV) in silico IK1 injection were selected. Activated sodium current during AP was measured by subtracting traces before and after adding 30 µM tetrodotoxin TTX in INa-specific intracellular and extracellular (with 130 mM NaCl concentration) solutions (Supplementary material online, Table S5). ICa, L was considered as the Nifedipine-sensitive (4 µM) calcium current recorded using ICa, L solutions (Supplementary material online, Table S5).
2.10 Luciferase assay
SCN5A BS2− (from −261 to +613 bp of the TSS) and BS2+ (from −261 to +1072 bp from TSS) Plasmids (150 ng), pGL2-Renilla (15 ng) with or without GATA4 expressing vector (150 ng) and with or without either of the wild-type or mutated forms of IRX5 expressing vectors (150 ng) were transfected into HEK293 cells using Lipofectamine 2000 (Thermo Fisher Scientific). DNA quantities were equalized in each condition using empty pcDNA3.1. Cells were harvested 48 h later and luciferase activity was measured using Dual Luciferase reporter assay system (Promega).
2.11 Microscale thermophoresis
Microscale thermophoresis (MST) was used to verify protein interaction with DNA according to Nanotemper instructions. Briefly, HEK293 cells transfected by IRX5-GFP expressing vector were used to produce fluorescently labelled IRX5 protein. Cell lysates were prepared using a buffer containing 20 mM Tris–HCl, 130 mM NaCl, 1% NP40, and protease inhibitors cocktail. Titration series were performed to obtain varying concentrations of SCN5A plasmids. Measurements were accomplished in standard treated capillaries on Monolith NT.115 instrument using 80% of laser power.
2.12 Statistical analysis
Results are expressed as mean±S.E.M. Comparisons were made using Student’s t-test, or two-way ANOVA with Bonferroni post hoc test for repeated measures. Values of P < 0.05 were considered statistically significant. Statistical analyses were performed with GraphPad Prism software.
3. Results
3.1 IRX5 TF expression correlates with conduction genes expression in human cardiac tissues
Transcriptomic analyses were performed to obtain a systemic view of IRX5-driven gene regulations and to direct further functional analyses. In order to identify evolutionary-conserved IRX5-coregulated genes in contractile tissues, expression profiles of cardiac genes including ion channels and TFs were compared between murine and human tissues. Overall, the global gene expression contrast profile between atrial and ventricular murine tissues was conserved in human samples (Figure 1A). The cluster of genes that are more expressed in ventricular tissues, included IRX5 and several genes involved in cardiac conduction, such as SCN5A, which encodes the main cardiac sodium channel Nav1.5 (Figure 1A). Then, the correlations between IRX5 gene expression level and those of sodium channels and connexins (Cx), the two main families of genes implicated in cardiac conduction in humans, were investigated in the ventricles. Interestingly, SCN5A and GJA5, encoding one of the main cardiac Cx, Cx40, showed the strongest correlation coefficient with IRX5, respectively, 0.62 and 0.60 (Figure 1B). In accordance with these results and confirming previous reports,22,31–34 both Nav1.5 and Cx40 shared a gradient of protein expression similar to that of IRX5 throughout the human ventricular wall with a higher level in subendocardium, which also includes Purkinje fibres, as compared to subepicardium (Figure 1C).
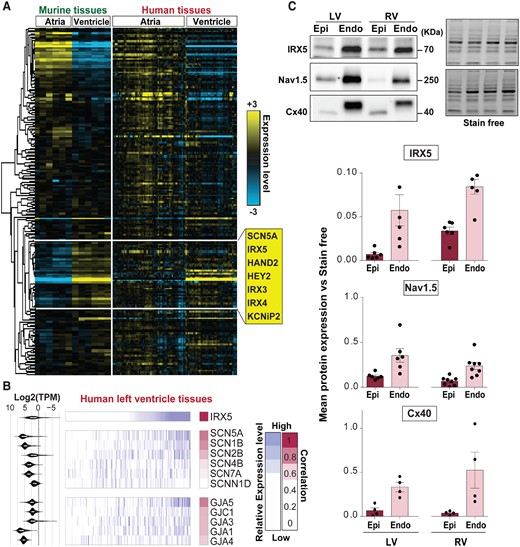
IRX5 TF and conduction genes expression in human cardiac tissues. (A) Heatmap displaying expression level of 212 cardiac genes (ion channels and TFs) in murine atrial and ventricular tissues measured by TLDA (−ΔCt), and in human atrial and left ventricular samples (GTEx). Murine genes were clustered using hierarchical ascending method with an uncentred correlation metric and average linkage. Heatmap of the same genes was obtained in human tissues based on the murine cluster, in a supervised hierarchical manner. Yellow and blue indicate high and low expression levels, respectively. Representative genes of the ventricular-specific gene cluster are listed in the yellow box. (B) Comparative analysis of the expression pattern of genes encoding sodium channels and gap junction proteins in human left ventricular tissues, to the IRX5 gene expression pattern (GTEx). Samples were ordered according to their IRX5 expression levels (white/purple gradient from the lowest to the highest). Keeping the same sample organization, a white/purple colour gradient was then similarly applied to selected genes involved in ventricular conduction of electrical influx (the median GTEx expression level in left ventricular samples is indicated on the left for each gene). Pearson correlation values between each sodium channel or gap junction gene and IRX5 expression profiles are shown using white/pink colour gradients. (C) Representative immunoblots of IRX5, Nav1.5, and Cx40 levels in human protein lysates of ventricular subendocardial (Endo) and subepicardial (Epi) samples obtained from three human left (LV) and right ventricles (RV). Corresponding averaged IRX5, Nav1.5, and Cx40 protein expression levels obtained from tissue samples of three individuals, technically replicated one to three times and normalized to Stain free.
Taken together, these analyses shed light on the importance of studying the role of IRX5 in the regulation of cardiac ventricular genes, and more specifically in the regulation of players of cardiac electrical conduction in human ventricles. The analysis of the role of IRX5 in humans was then pursued using hiPSCs obtained from three non-diseased individuals (shown as averaged) as well as from two patients carrying different LOF mutations in IRX5 gene associated to a prolonged QRS interval in comparison with normal limits in children on the ECG,35 together with a right bundle branch block6,36 (Supplementary material online, Figure S2A).
3.2 IRX5-mutated hiPS-CMs derived from HMMS patients are a relevant model to study IRX5 role
Dermal fibroblasts of two Hamamy patients who are homozygous carriers of either the A150P- or the N166K-IRX5 mutation6 and of three intra- and extra-familial control subjects were reprogrammed into hiPSCs. Mutations were confirmed by sequencing in hiPSCs (Supplementary material online, Figure S2B). Genome integrity was validated using SNP analysis (data not shown). Expression of pluripotency markers was verified in hiPSCs (Supplementary material online, Figure S2C–E).
We then investigated whether all hiPSC lines differentiated in a comparable manner. Principal component analysis of individual transcriptomic profiles as well as correlation analysis showed that samples mainly clustered according to their differentiation stage (Supplementary material online, Figure S3A and B). Furthermore, all control and IRX5-mutated hiPS-CMs presented a similar global change in gene expression compared to that of hiPSCs (Supplementary material online, Figure S3C). These data showed that all hiPSCs, irrespectively of their genetic background, differentiated similarly into cardiac cells. Immunostaining analysis showed that striated troponin I was present in CMs derived from each hiPSC line (Figure 2A) and a known marker for ventricular electrical activity, Connexin 43, was present in all lines (Supplementary material online, Figure S4). Expression of specific markers for atrial and ventricular cells revealed the presence of both these cell types in the differentiated hiPSCs, but not their proportions (Supplementary material online, Figure S5). AP recordings further confirmed the presence of atrial-like and ventricular-like cells, but also nodal-like cells, in proportions that were comparable in control and mutated hiPS-CMs, with the ventricular-like type forming the majority of hiPS-CMs (Figure 2B). Altogether, these data confirmed that control and IRX5-mutated hiPSCs differentiated similarly into CMs, and therefore that hiPS-CMs are a relevant model to investigate the role of IRX5 in ventricular electrical conduction.
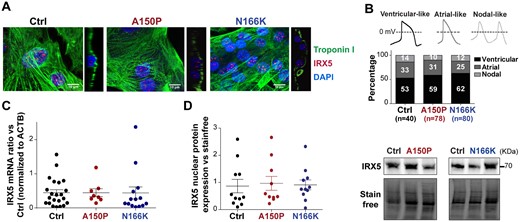
Characterization of IRX5-mutated hiPS-cardiomyocytes. (A) Illustrative immunostainings of IRX5 (red) and Troponin I (green) in hiPS-CMs, merged with a nuclear staining using DAPI (blue). To confirm nuclear localization of IRX5, XZ orthogonal planes are illustrated next to each picture. (B) Representative traces and distribution (as percentage) of nodal-like, atrial-like, and ventricular-like cells, based on the analysis of AP parameters in spontaneously beating hiPS-CMs (Ctrl: n = 40; A150: n = 78; N166K: n = 80). (C) IRX5 mRNA expression level in control and mutated hiPS-CMs at Day 28 of cardiac differentiation using TaqMan® technique (Ctrl: n = 22; A150P: n = 8; N166K: n = 14). (D) Nuclear expression level of IRX5 protein in control and mutated hiPS-CMs, normalized to Stain free. Representative immunoblot showing IRX5 expression in the nuclear protein fraction (Ctrl: n = 11; A150P: n = 10; N166K: n = 11).
Regarding the impact of IRX5 mutations on its own expression, transcriptional analysis and nuclear protein expression revelation showed comparable IRX5 expression levels in control and IRX5-mutated hiPS-CMs (Figure 2C and D). Finally, immunostainings of hiPS-CMs constantly showed localization of IRX5 in CM nuclei (Figure 2A). These data showed that A150P and N166K mutations neither alter IRX5 expression nor its localization in hiPS-CMs.
3.3 Key cardiac electrical conduction gene expression depends on IRX5
Global transcriptomic analysis in hiPS-CMs, using 3′-SRP, unveiled 745 genes differentially expressed between control and IRX5-mutated cells. These include several cardiac electrical conduction genes such as HEY2 and TBX5 TFs, that have been shown to present a gradient of expression within the ventricular wall opposite to the one of IRX5, suggesting that they may be negatively regulated by IRX5 (Figure 3A)33,34,37. Using high-throughput real-time RT-PCR (TLDA), we also analyzed a set of 96 genes, including mostly genes with low expression level that could not be properly detected using 3′-SRP (Figure 3B). Overall, for the genes detected with both techniques, expression profiles were concordant (Supplementary material online, Figure S6). Biological pathway enrichment analysis revealed that differentially expressed genes were enriched in pathways involved in cardiac structure, in the regulation of cardiac conduction, and in muscle contraction, and more specifically in the cardiac conduction and phase 0 AP-depolarization functions, mainly linked to the activity of SCN5A and GJA5 (Figure 3C andSupplementary material online, Figure S3D). More precisely, analyses of IRX5-A150P and -N166K hiPS-CMs concordantly showed major mRNA and protein expression reductions of both SCN5A and GJA5 (Figure 4A and B). In addition, confocal microscopy further confirmed that Nav1.5 and Cx40 expression was decreased in troponin T positive IRX5-A150P and -N166K mutated hiPS-CMs (Figure 4C).
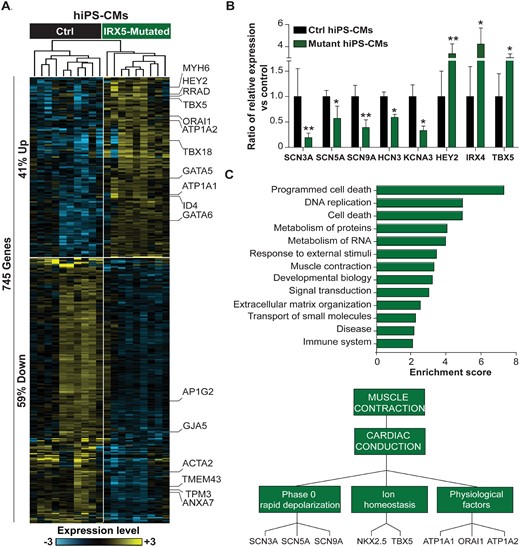
Transcriptomic aberrations in IRX5-mutated cardiomyocytes. (A) Heatmap showing hierarchical clustering of expression profiles of the 745 differentially expressed genes obtained by 3′-SRP in control (Ctrl, n = 13) and IRX5-mutated (n = 8) hiPS-CMs at Day 28 of differentiation. About 41% and 59% genes were upregulated and downregulated in IRX5-mutated hiPS-CMs, respectively. Yellow and blue represent high and low expression levels, respectively. Relevant genes implicated in the function or regulation of cardiac electrical conduction are highlighted on the right. (B) Histograms showing expression levels of differentially expressed genes in IRX5-mutated hiPS-CMs (n = 9) identified using TLDA, as compared to control hiPS-CMs (n = 12). * and **: P < 0.05 and P < 0.01 vs. control, respectively (t-test). (C) Top panel: Functional annotation of differentially expressed genes at Day 28 of differentiation, obtained by 3′-SRP and TaqMan. Histograms showing over-represented Reactome pathways. Only pathways with enrichment score >2 and P < 0.05 are shown. Bottom panel: Detailed muscle contraction pathway is represented.
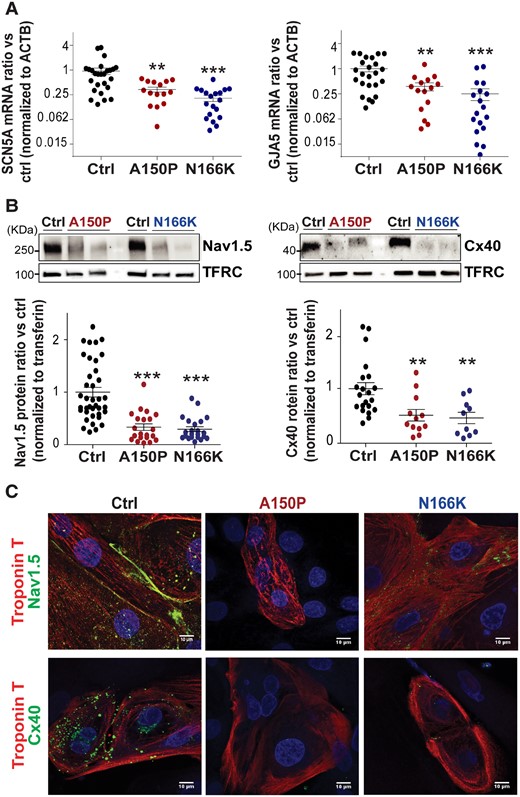
Impaired expression of GJA5 and SCN5A in IRX5-mutated hiPS-CMs. (A) TaqMan® analysis showing mRNA expression of SCN5A and GJA5 in control (n = 24), A150P (n = 15) and N166K (n = 19) IRX5-mutated hiPS-CMs. Cts were normalized to ACTB and each normalized expression value was expressed as compared to the average normalized expression for the control group, generating 2−ΔΔCt values. A logarithmic scale (log2) was used for the Y axis. * and **P < 0.05 and P < 0.01 vs. control, respectively (Mann–Whitney test). (B) Representative immunoblots for Nav1.5 and Cx40 and ratios of Nav1.5 and Cx40 expression levels normalized to Transferrin receptor (TFRC). Blots were quantified using Image Lab software. ** and ***P<0.01 and P<0.001 vs. control, respectively (t-test). Ctrl: n = 38; A150P: n = 22; N166K: n = 22. (C) Representative confocal images for immunostainings of Nav1.5 and Cx40 (green) in Troponin I positive (red) control and IRX5-mutated hiPS-CMs. Nuclei are stained in blue using DAPI.
Taken together, hiPS-CMs carrying IRX5 LOF mutations, exhibited altered expression of key genes involved in cardiac electrical conduction, suggesting a role for IRX5 in the direct transcriptional control of these genes.
3.4 AP depolarization and INa density are modulated by IRX5
Given the delayed ventricular conduction phenotype observed in HMMS, a slower AP depolarization in patient-derived hiPS-CMs was expected. However, the maximal depolarization velocity (dV/dtmax) of ventricular APs, was not statistically reduced in IRX5-mutated hiPS-CMs (Figure 5A). We hypothesized that hiPS-CMs being immature and lacking IK1, cellular RMPs (RMPs) of hiPS-CMs were too depolarized (around −60 mV, as shown in Figure 5B), and may not be suitable for proper activation of depolarizing currents. To overcome this issue, an in silico IK1 injection was performed. It brought ventricular RMPs to about −80 mV (Figure 5B) and induced (i) an increase in dV/dtmax back to physiological values in control hiPS-CMs and (ii) a significant reduction in dV/dtmax in IRX5-mutated hiPS-CMs (Figure 5C). The contribution of INa and ICa, L to AP depolarization as a function of IK1 injection was then investigated. They were measured when ventricular-like AP voltages, recorded with or without IK1 injection, were applied to control hiPS-CMs. Without IK1 injection, ICa, L contribution to the depolarization phase was greater than that of INa, while with IK1 injection, INa became the main contributor (Figure 5D). This suggests that the dV/dtmax reduction observed in IRX5-mutated hiPS-CMs under IK1 injection was due to a functional reduction of INa, but not of ICa, L. Confirming this hypothesis, INa was reduced by half in IRX5-mutated hiPS-CMs (Figure 5E and Supplementary material online, Figure S7A) without any change in the activation and inactivation curves as well as in the recovery from inactivation kinetics (Supplementary material online, Figure S7B and C and Table S6). In contrast to INa reduction, no modification in ICa, L density was observed (Figure 5F). Together with the SCN5A expression alteration, these data suggest that a slower ventricular AP depolarization due to INa reduction may participate to the prolonged QRS observed in HMMS.
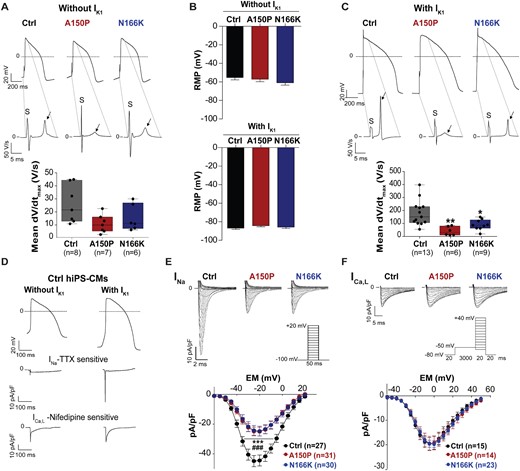
IRX5 loss-of-function leads to a slower upstroke velocity via reduction of INa. (A) Top panel: representative traces of ventricular APs measured in IRX5-A150P and -N166K mutated and control hiPS-CMs paced at 700-ms cycle length with their corresponding first derivatives of the stimulus (S) and of the AP upstroke phases (arrows) of the APs. Dashed lines show the part of the APs on which the derivatives have been calculated. Bottom panel: Box whisker plots of maximum upstroke velocities of ventricular APs when pacing at 700-ms cycle length without in silico IK1 injection. (B) Resting membrane potentials (RMPs) measured from ventricular APs paced at 700-ms cycle length with or without in silico IK1 injection. Mean and S.E.M. are indicated; n: same as in A and C. (C) Top panel: representative traces of ventricular APs measured in A150P and N166K IRX5-mutated and control hiPS-CMs paced at 700-ms cycle length with their corresponding first derivatives of AP upstroke (arrows). Bottom panel: Box whisker plots of maximum upstroke velocities of ventricular APs when pacing at 700-ms cycle length and under dynamic clamp with in silico IK1 injection. * and **P < 0.05 and P < 0.01 vs. control, respectively (t-test). (D) Representative traces of INa-TTX-sensitive and ICa,L-Nifedipine-sensitive in control hiPS-CMs, obtained by subtraction of the current recorded before and after application of the inhibitors, when applying typical ventricular-like AP voltages, depicted on top. (E) Superimposed representative traces of INa recorded when applying the depicted voltage-clamp protocol, and mean current densities (pA/pF) vs. membrane potential (EM) recorded in hiPS-CMs. *** and ###P < 0.001 vs. control (n = 27) for, respectively, IRX5-A150P (n = 31) and -N166K hiPS-CMs (n = 30) (Two-way ANOVA with Bonferroni post hoc test). (F) Superimposed representative traces of ICa, L recorded when applying the depicted voltage-clamp protocol, and mean current densities (pA/pF) vs. membrane potential (EM) obtained in hiPS-CMs (Ctrl: n = 15; A150P: n = 14; N166K: n = 23).
3.5 IRX5 interacts with SCN5A and GJA5 promoters
Considering the altered transcription of SCN5A and GJA5 induced by IRX5 LOF, we explored whether IRX5 regulates directly their promoters. An in silico analysis showed that SCN5A promoter region includes three potential TF-BS for IRX5 (Figure 6A). In accordance with previous studies on mice,8 human GJA5 promoter region was free from any conserved IRX BS (Figure 6B). Immunoprecipitation of IRX5-associated chromatin showed an enrichment of SCN5A-BS2 in control hiPS-CMs, revealing an interaction with IRX5, but not in IRX5-mutated hiPS-CMs (Figure 6A). On the other hand, despite the absence of in silico identification of conserved IRX-BS on GJA5 promoter, an interaction between IRX5 and GJA5 core promoter was found in control hiPS-CMs, that was again absent in IRX5-mutated hiPS-CMs (Figure 6B). These data strongly suggest that IRX5 interacts with SCN5A and GJA5 promoters to regulate their expression in hiPS-CMs.
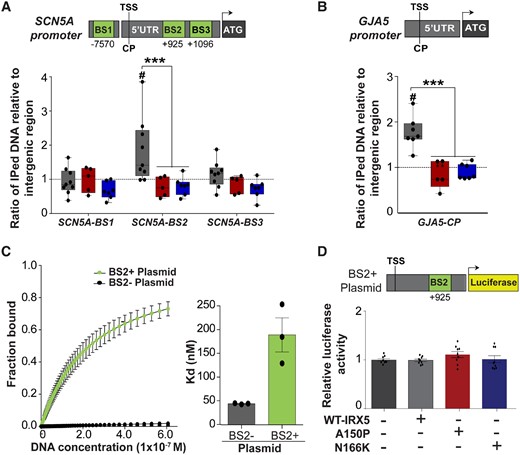
IRX5 interacts with SCN5A and GJA5 promoters. (A) Schematic representation of potential binding sites for IRX5 (BS, in green; numbers indicate position referring to TSS) on SCN5A promoter identified in silico, and PCR amplification using primers specific for each BS after hiPS-CMs ChIP with an antibody against IRX5. Results are shown as ratio of the immunoprecipitated (IPed) DNA relative to intergenic region (IR). CP, core promoter; TSS, transcription starting site. #P < 0.05 vs. IR in control samples (n = 8); ***P < 0.001 vs. control in IRX5-mutated samples; A150P n = 5 and N166K: n = 7 (t-test). (B) IRX5 interaction with GJA5 promoter obtained as in A Ctrl: n = 6; A150P: n = 5; N166K: n = 7. (C) Dissociation constant (Kd) between IRX5 protein and SCN5A promoter obtained after MST test using constant concentration of IRX5 protein and decreasing concentration of SCN5A promoter plasmids (from 650 to 0.0099 nM). Two different plasmids containing parts of SCN5A promoter were used: BS2− plasmid, from −261 to +613 bp, that did not contain IRX5 BS2, and BS2+ Plasmid, from −261 to +1072 bp, which contained IRX5 BS2. Left panel, fitted curves issued using law of mass action. Right panel, histograms showing mean and S.E.M. Kd (n = 3 per group, from three separated preparations). (D) Luciferase experiments in HEK293 cells cotransfected with BS2+ Plasmid, containing luciferase cDNA under the control of SCN5A promoter region (from −261 to +1072 bp), and with expressing vectors encoding wild-type (WT), A150P, or N166K-mutated IRX5 cDNA. Firefly luciferase activity was normalized to Renilla activity (mean±S.E.M., n = 3 per group, from three separated preparations) and is shown as ratio vs. condition without IRX5 plasmid.
To further investigate the direct interaction between SCN5A promoter and IRX5, their binding affinity was evaluated. Two different DNA constructs containing SCN5A promoter were used: BS2+ plasmid, containing IRX5 BS2 and BS2− plasmid, lacking IRX5 BS2. Interestingly, IRX5 protein did bind to BS2+ plasmid but not to BS2− plasmid, confirming that IRX5 protein binds to SCN5A promoter when BS2 is present (Figure 6C).
Finally, the functional consequences of IRX5 binding on SCN5A promoter were further evaluated using luciferase assay with the BS2+ plasmid construct. Unexpectedly, neither IRX5 nor its mutated forms activated the luciferase reporter gene (Figure 6D), indicating that another TF may be required to allow IRX5 to regulate SCN5A expression. This prompted us to investigate the role of potential critical partners for IRX5, already known to be important for regulation of cardiac development and electrical function, such as GATA4. GATA4, a cardiogenic TF, has indeed been previously shown to regulate SCN5A expression38 and an interaction between Irx5 and another member of the Gata family of TFs, Gata3, has been unveiled during craniofacial development.6
3.6 IRX5 and GATA4 cooperatively regulate SCN5A expression in human CMs
Comparably in human cardiac ventricular samples and control hiPS-CMs, among GATA family members, GATA4 was the most strongly expressed (Figure 7A). In control hiPS-CMs, GATA4 co-immunoprecipitated with IRX5 and this interaction was not altered in IRX5-mutated hiPS-CMs (Figure 7B). As SCN5A promoter contains two sites for GATA4 binding (BSa and BSb),38 chromatin immunoprecipitation (ChIP) experiments using IRX5 antibody showed that IRX5 interacted with GATA4 BSb region in control and IRX5-mutated hiPS-CMs (Figure 7C). Binding affinity analysis further validated the direct interaction between SCN5A promoter and the heterodimer IRX5-GATA4, as a binding was observed when both IRX5 and GATA4 proteins were mixed with BS2− plasmid, in opposition to when IRX5 alone was mixed with BS2− plasmid (Supplementary material online, Figure S8). Therefore, IRX5 not only binds directly to BS2 on SCN5A promoter but also binds the BSb site together with GATA4. Finally, to further dissect the role of IRX5 and GATA4 on SCN5A transcription activation, luciferase assays were performed with plasmids containing either BSb only (BS2− plasmid) or BSb and BS2 (BS2+ plasmid). Co-transfection of GATA4 expressing vector with either plasmid triggered a similar increase in luciferase activity, confirming that GATA4 activated SCN5A promoter through a direct interaction with BSb (Figure 7D). Interestingly, when IRX5 was added to these combinations, it potentiated by 1.6 times the effect of GATA4 on BS2− plasmid, and by 3.9 times the effect of GATA4 on BS2+ plasmid (Figure 7D). This further demonstrated that the direct binding of IRX5 to BS2 is important for proper activation of SCN5A expression. Conversely, no potentiation of GATA4 activation of SCN5A promoter was observed when A150P- or N166K-mutated IRX5 were added to the various combinations (Figure 7D). Interestingly, in contrast to IRX5 and SCN5A, which shared similarly graded expression patterns, GATA4 was homogeneously expressed both in atria and ventricles, and throughout the ventricular wall (Supplementary material online, Figure S9A–D). This suggests that GATA4 triggers basal expression of SCN5A throughout cardiac tissues, while IRX5 is responsible for the establishment of its expression gradient.
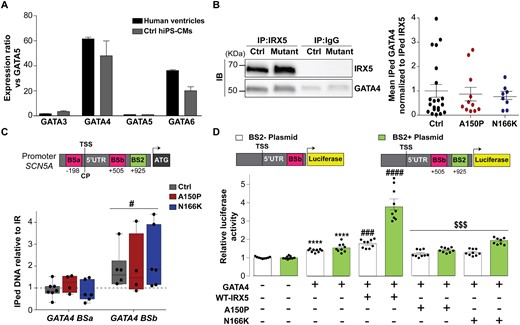
IRX5 and GATA4 cooperate to regulate SCN5A expression. (A) GATA transcripts expression ratios vs. GATA5 (GATA TF with the lowest expression). Transcript expression ratios were calculated using GTEx data for human ventricular tissues and using TLDA analysis for control hiPS-CMs. Data are expressed as mean±S.E.M. (B) Representative western blots of IRX5 and GATA4 in control and IRX5-A150P mutated hiPS-CM lysates immunoprecipitated with anti-IRX5 antibody. Quantification of the amount of GATA4 co-immunoprecipitated with IRX5, in control and, IRX5-A150P and -N166K mutated hiPS-CMs. Results are shown as ratios of the co-immunoprecipitated (IPed) GATA4 normalized to the IPed IRX5 amounts (Ctrl: n = 20; A150P: n = 11; N166K: n = 8). (C) Schematic representation of IRX5 binding site (BS; green) and GATA4 BS (pink) on SCN5A promoter (numbers indicate position referring to TSS), and PCR amplification using primers specific for each BS after hiPS-CMs ChIP with an antibody against IRX5. Results are shown as ratio of the IPed DNA relative to intergenic region (IR). TSS: transcription starting site. #P < 0.05 vs. intergenic region (t-test). Ctrl: n = 7; A150P n = 4 and N166K: n = 6. (D) Luciferase experiments in HEK293 cells cotransfected with BS2− plasmid, containing luciferase cDNA under the control of SCN5A promoter region (−261 to +613 bp) with GATA4 BSb but not IRX5 BS2 (white bars), or BS2+ plasmid, containing luciferase cDNA under the control of SCN5A promoter region (−261 to +1072 bp) with GATA4 BSb and IRX5 BS2 (green bars), and with the indicated GATA4 or/and IRX5 expressing plasmids. Firefly luciferase activity was normalized to Renilla and is shown as ratio to its activity when transfected with SCN5A plasmids only. Results are displayed for three independent cell preparation and transfection. ****P < 0.0001 vs. condition with no IRX5/GATA4 plasmid; ### and ####P < 0.001 and P < 0.0001 vs. condition with GATA4 plasmid only; $$$P < 0.001 vs. condition with GATA4 + WT-IRX5 plasmids (t-test).
4. Discussion
This study demonstrates that IRX5 TF is instrumental for proper control of electrical activity in human CMs. hiPS-CMs generated from patients with rare mutations in IRX5 recapitulated their clinical features of ventricular depolarization delay, through an alteration in the regulation of major sodium channel and connexin-encoding gene expression.
4.1 hiPSCs as a model to study TFs
It is commonly acknowledged that stem cell-derived CMs fail to fully recapitulate adult CM features.39 Accordingly, expression of both Connexin 40 and Connexin 43 was observed in the hiPS-CMs. While the adult ventricular myocardium is known to express Connexin 43 but nearly no Connexin 40, known to be specifically expressed in adult Purkinje fibres, prenatal ventricular myocardium expresses Connexin 43 and Connexin 40 in an overlapping pattern.40 Thus, the foetal-like phenotype of ventricular hiPS-CMs may explain why they express not only Connexin 43 but also Connexin 40. Nevertheless, hiPS-CMs have been used successfully so far in >35 studies of cardiac arrhythmic diseases and channelopathies.39 Recently, two studies showed the role of TFs in cellular dysfunction associated to cardiac morphogenetic and electrical defects using hiPS-CMs.41,42 The present work additionally enforces the use of hiPSCs as a relevant model for studying the role of TF in the regulation of cardiac electrical conduction. Indeed, with in silico IK1 injection, we revealed cellular phenotypic traits that are consistent with the patient’s clinical phenotype, e.g. QRS complex prolongation observed on the patient’s ECG.
4.2 Interspecies regulatory pathway differences
Electrophysiological properties across species are known to be different,43 suggesting that the roles of cardiac TFs can differ from one species to another. Here, in agreement with this postulate, comparably to what was previously demonstrated for Irx3 and its regulation of fast conduction in the murine heart,8 an induction of GJA5 expression by IRX5 has been found in human iPS-derived CMs. However, Irx5KO mice did not exhibit conduction delay and murine Irx5 was not shown to regulate the expression of Cx.28
Moreover, the patients, unlike Irx5KO mice, do not display ventricular repolarization abnormalities, but a conduction defect. Indeed, the deletion of Irx5 in mice leads to the abolishment of the T wave on the ECG due to the loss of the transmural gradient of expression of Kcnd2, at the root of one major player of ventricular repolarization in mice, Ito, but not in human heart, where KCND3 constitutes the predominant alpha-subunit generating Ito.22 Another argument in favour of interspecies differences in gene regulation by IRX TFs is that, due to its transmural gradient of expression, Irx5 establishes gradients of expression for its target genes. That is how, in mice, Kcnd2 ventricular gradient is known to be established. In human, it is unlikely that IRX5 regulates KCND3 expression, as, in opposition to IRX5, its expression is uniform across the ventricular wall.7,22
Along with this rationale, in this study, using patient-derived CMs, a role for IRX5 in the regulation of the expression of the major actors of conduction of the electrical influx, sodium channel subunit, and connexin was elucidated. These data illustrate interspecies differences in the mechanism of action of IRX TFs, demonstrating the importance of using appropriate models to study human diseases.
4.3 Complex regulatory pathway underlies electrical conduction
Conduction of electrical influx throughout the ventricles is mediated not only by connexins but also by inward currents responsible for the depolarization phase of APs. Here, among these inward currents (INa and ICa, L), INa reduction has been identified as the trigger of the impaired AP upstroke velocity in mutated hiPS-CMs. Concordantly, SCN5A mRNA expression level is significantly reduced by 2.8- and 4.6-folds, in A150P and N166K hiPS-CMs as compared to control cells, respectively. At the protein level and as discussed above, Nav1.5 protein expression level is significantly reduced by 3- and 3.3-folds, in A150P and N166K hiPS-CMs as compared to control cells, respectively. And finally, at the functional level, INa current density is significantly reduced by 2- and 2.7-folds, in A150P and N166K hiPS-CMs as compared to control cells, respectively. In agreement with a direct transcriptional regulation, IRX5 binds to and activates SCN5A proximal promoter in control hiPS-CMs whereas mutations in IRX5 prevent this interaction. Surprisingly, at the functional level, luciferase assays showed that IRX5 alone was not able to activate SCN5A, suggesting that regulation of SCN5A is due to a combinatorial effect of several factors. In accordance, IRX5 and GATA4 have been found to interact with each other allowing IRX5 to bind to a previously described GATA4 BS on SCN5A promoter and to enhance GATA4 effect on SCN5A activation. Interestingly, while IRX5 and SCN5A display a comparable gradient of expression through the ventricular wall, as well as between atria and ventricles, GATA4 has a more uniform pattern of expression. We thus hypothesized that GATA4 and IRX5 could act cooperatively where GATA4 may be important for basal expression of SCN5A in human CMs while IRX5 creates its gradients of expression in the heart. Genetic expression and/or function abnormalities of SCN5A together with conduction defects have been previously linked to other rare arrhythmic diseases, such as Brugada syndrome.44,45 Thus, the current study elaborating the role of IRX5 in the control of ventricular conduction through the regulation of SCN5A presents a framework for future studies on its potential implication in other complex diseases such as Brugada syndrome.
4.4 Study limitations
Arrhythmic diseases often present with a wide spectrum of phenotypes, even among patients belonging to the same family. The individual genetic background is thought to play a major role in this heterogeneity. In the context of hiPSC-based disease modelling, the use of isogenic control, where the genetic variant has been corrected in the patient iPS cell line, is increasingly employed. The present study aimed at dissecting IRX5 regulatory mechanisms of human cardiac electrical function by modelling HMMS. Therefore, we chose to perform a comparative analysis between control and two hiPSC lines obtained from two HMMS patients belonging to different families and harbouring different LOF mutations in IRX5. For all studied parameters, similar results have been obtained for both types of mutated hiPS-CMs as compared to control cells, strongly supporting a specific role for IRX5 in the pathological phenotype and thereby minimizing the relevance of using isogenic controls.
We suggested the presence of Cx40 and Nav1.5 protein gradients through human adult ventricular wall (Figure 1C), although the presence of Purkinje fibres in the endocardial samples likely participate to the expression differences. Indeed, higher levels of protein and or current have been observed in Purkinje fibres as compared to endocardial myocytes, in the adult heart.46,47
5. Conclusion
In conclusion, the present data suggest that functional IRX5 is essential for regulation of sodium channel- and connexin-gene expression, ensuring proper conduction of the electrical influx between CMs. Furthermore, a role for this TF in the orchestration of the gene expression programme governing ventricular electrical depolarization in human was uncovered, bringing to light a new potential option for therapeutic intervention.
Supplementary material
Supplementary material is available at Cardiovascular Research online.
Authors’ contributions
Z.R.A.S. contributed to the acquisition, interpretation of data, and writing of the report; R.C. contributed to data acquisition; B.C. contributed to data acquisition; C.B. contributed to clinical data acquisition; J.-B.G. contributed to clinical data analysis; H.H. contributed to clinical data acquisition; H.K. contributed to clinical data acquisition; A.G. contributed to data acquisition; M.J. contributed to data acquisition; N.J. contributed to data acquisition; A.G. contributed to data acquisition; C.C. contributed to data acquisition; L.D. contributed to data acquisition; V.F. contributed to data acquisition; C.M. contributed to data acquisition; F.C. contributed to writing of the report; G.L. contributed to data analysis, and writing of the report; G.L. contributed to data analysis, and writing of the report; B.R. contributed to clinical data acquisition; K.Z. contributed to the writing of the report; P.L. contributed to the study design, interpretation of the data, and writing of the report; N.G. contributed to the study design, interpretation of the data, and writing of the report. All authors discussed the results and contributed and approved the final manuscript.
Acknowledgements
The authors would like to thank the Genomics and Bioinformatics Core Facility (GenoBiRD, Biogenouest), the Cytometry facility (CytoCell), the iPS core facility, and the Cellular and Tissular Imaging Core Facility (MicroPICell) of Nantes University, for their technical support. The authors also would like to thank Dan Roden for the gift of SCN5A plasmids, and Sophie Demolombe for helping with mouse studies.
Conflict of interest: None declared.
Funding
This work was funded by grants from The National Research Agency (HEART iPS ANR-15-CE14-0019-01), and La Fédération Française de Cardiologie. N.G. was laureate of fellowships from Fondation Lefoulon-Delalande and Marie Curie Actions International Incoming Fellowship FP7-PEOPLE-2012-IIF (PIIF-GA-2012-331436). Z.R.A.S. is supported by Eiffel scholarship programme of Excellence (Campus France), by Doctoral School of Science and Technology-Lebanese University and The Fondation Genavie.
Data availability
The authors declare that all data supporting the findings of this study are available within the article and its supplementary information files or from the corresponding author upon reasonable request. All read sequence data and sample annotations generated for this article are available at European Nucleotide Archive (ENA) with accession number PRJEB39654.
References
Inherited cardiac arrhythmias account for ~ 20% of sudden cardiac deaths, of which a small portion are monogenic familial diseases with mutations in cardiac ion channels. However, pathogeny of inherited cardiac arrhythmias is increasingly thought to result from complex mechanisms involving altered regulation of multiple effectors expression. Taking advantage of cardiomyocytes derived from HMMS patients, carrying loss-of-function mutations in IRX5 transcription factor, we uncovered an important role for IRX5 in the regulation of several major players of ventricular depolarization conduction and in arrhythmogenesis. Thus, this study supports systematic screening for genetic variants in IRX5 in inherited cardiac arrhythmias.
