


Cardiovascular Research, Volume 81, Issue 3, 15 February 2009, Pages 601–609, https://doi.org/10.1093/cvr/cvn315
An expression of concern was issued by the journal (https://doi.org/10.1093/cvr/cvaa232) following concerns raised regarding data presented in Figures 3 and 5.
As the original blots cannot be retrieved, the authors have prepared new versions of figures 3 and 5 and have provided an updated figure legend.
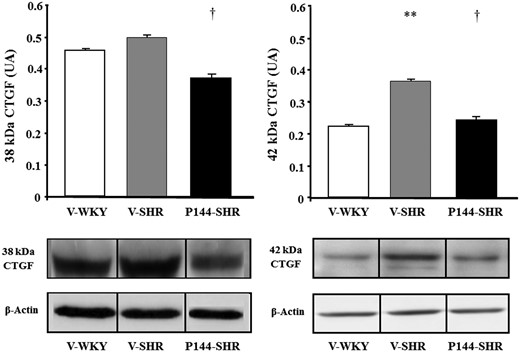
Expression of the 38 kDa and 42 kDa isoforms of connective tissue growth factor (CTGF) relative to ß–actin in the left ventricle of vehicle-treated Wistar-Kyoto rats (V-WKY), vehicle-treated spontaneously hypertensive rats (V-SHR), and P144-treated SHR (P144-SHR). Histograms represent mean ± SEM (n = 10) and AU means arbitrary units. ** P < 0.01 vs V-WKY; † P < 0.05 vs V-SHR. Representative Western blot of 38 kDa CTGF and 42 kDa CTGF and ß–actin in the 3 groups of rats are shown in the bottom part of the figures. Western blot autoradiogram bands have been spliced to be presented in the same order as conditions were displayed in the histogram.

Representative Western blot of 38 kDa CTGF and 42 kDa CTGF and ß–actin in the 3 groups of cultured Rat-2 cardiac fibroblasts incubated with 0.01 ng/μl TGF-β1 (TGF-β1), 200 μg/ml P144 (P144), and TGF-β1 and P144 (TGF-β1+P144) are shown supporting the data of the Table 4. Western blot autoradiogram bands have been spliced to be presented in the same order as conditions were displayed in the histogram.
This matter was investigated by the ESC Journals Family Ethics Committee, which recommended this resolution. These changes do not affect the overall scientific message of the paper.
