


Abstract
Vestibular information is available to the brain during navigation, as are the other self-generated (idiothetic) and external (allothetic) sensorimotor cues that contribute to central estimates of position and motion. Rodent studies provide strong evidence that vestibular information contributes to navigation but human studies have been less conclusive. Furthermore, sex-based differences have been described in human navigation studies performed with the head stationary, a situation where dynamic vestibular (and other idiothetic) information is absent, but sex differences in the utilization of vestibular information have not been described. Here, we studied men and women with severe bilateral vestibular damage as they navigated through a visually barren virtual reality environment and compared their performance to normal men and women. Two navigation protocols were employed, which either activated dynamic idiothetic cues (‘dynamic task’, navigate by turning, walking in place) or eliminated them (‘static task’, navigate with key presses, head stationary). For both protocols, we employed a standard ‘triangle completion task’ in which subjects moved to two visual targets in series and then were required to return to their perceived starting position without localizing visual information. The angular and linear ‘accuracy’ (derived from response error) and ‘precision’ (derived from response variability) were calculated. Comparing performance ‘within tasks’, navigation on the dynamic paradigm was worse in male vestibular-deficient patients than in normal men but vestibular-deficient and normal women were equivalent; on the static paradigm, vestibular-deficient men (but not women) performed better than normal subjects. Comparing performance ‘between tasks’, normal men performed better on the dynamic than the static paradigm while vestibular-deficient men and both normal and vestibular-deficient women were equivalent on both tasks. Statistical analysis demonstrated that for the angular precision metric, sex had a significant effect on the interaction between vestibular status and the test paradigm. These results provide evidence that humans use vestibular information when they navigate in a virtual visual environment and that men and women may utilize vestibular (and visual) information differently. On our navigation paradigm, men used vestibular information to improve navigation performance, and in the presence of severe vestibular damage, they utilized visual information more effectively. In contrast, we did not find evidence that women used vestibular information while navigating on our virtual task, nor did we find evidence that they improved their utilization of visual information in the presence of severe vestibular damage.
Introduction
Navigation is a complex cognitive and sensorimotor activity in which subjects track their position within a spatial environment as they move towards a desired end-point. Vestibular and other body-centred, idiothetic (proprioceptive, efferent) cues and external, allothetic (e.g. visual) information are available to the brain and could be utilized during navigation.1 In rodents, an extensive literature (c.f. Wallace et al.2 and Yoder and Taube3) confirms that vestibular information contributes to navigation; in human subjects, although vestibular damage can be associated with visuospatial deficits4 and hippocampal atrophy,5 effects on navigation are less consistently observed (e.g. Brandt et al.5 and Dobbels et al.6). The incongruency in human navigation studies most likely reflects, at least in part, methodological aspects of these experiments. When subjects were tested with the head still and movement through virtual environments depended on key presses (so dynamic idiothetic cues were not activated),7 for example, vestibular effects were inconsistent.6,8 In studies that employed actual ambulation through physical environments, in contrast, vestibular effects were often observed9,10 but the testing paradigms were frequently problematic. Subjects were escorted by an experimenter, for example, or were asked to memorize the maze and reproduce it while walking blindfolded. Both of these approaches presumably affected head motion dynamics, the basis of vestibular stimulation, although this was rarely quantified (and head movements were extremely slow when they were measured).9 Other limitations in prior studies include the inaccurate assumption (c.f. Ahmad et al.11) that central representations of visual space are normal in vestibular-deficient patients, the failure to consider the effects of non-vestibular sensory deficits (hearing loss in particular)6 and the use of analytic approaches that focus on response accuracy but ignore response precision.12 Lastly, sex-based differences have been described in numerous human navigation studies, but virtually, all of these were performed with the head stationary, depriving the brain of dynamic idiothetic information.7 Men generally performed better than women on these virtual navigation tasks,13,14 which may reflect differences in cognitive strategy,15 but nothing is known about potential sex-dependent differences in the utilization of vestibular cues during navigation.
Here, we studied the effects of vestibular damage on navigation performance in a virtual visual environment and also investigated the possibility that vestibular damage could affect navigation differently in men and women. A visually barren virtual environment was employed to test normal and vestibular-deficient men and women on two navigation paradigms—a ‘static’ task, where the head was stationary, and a ‘dynamic’ task, where subjects turned and walked in place on a platform. Both tasks provided weak visual (allothetic) information but the dynamic task also activated time-variant vestibular (and other idiothetic) cues. Cognitive strategizing was minimized by utilizing a reductionist ‘return-to-home’ protocol, ataxia effects were reduced with a railing on the platform, and subjects with non-vestibular sensory deficits were excluded. We measured five navigation metrics (angular precision and accuracy, linear precision and accuracy, and path length) but focus primarily on ‘angular precision’ because the dynamic paradigm employed physiologic angular (but not linear) head movements so angular metrics were considered more likely to demonstrate vestibular-dependent effects. Furthermore, while peripheral vestibular damage directly alters the veracity of the vestibular afference generated by head turns, it also could impair the brain’s ability to effectively cancel these abnormal vestibular inputs during active head turns.16 Either effect could degrade the precision of the brain’s estimate of head position and motion, which should be evidenced primarily in measures of response variability rather than measures of response magnitude.13 Using this approach, we found that vestibular information affected navigation metrics in men when the head was still or moving and primarily affected angular precision, but that these vestibular effects were not observable in women.
Materials and methods
The study was approved by the Massachusetts General Brigham Institutional Review Board, and all participants provided written informed consent prior to participation consistent with the Declaration of Helsinki.
Study participants
Nineteen adult patients (10 males, 9 females) with bilateral vestibular loss (BVL) and 19 adult (9 males, 10 females) normal control (NC) subjects were studied (Table 1). The ‘BVL patients’ were recruited from the Neurotology and Otoneurology Clinics at Massachusetts Eye and Ear and were identified using the Bárány Society criteria for bilateral vestibulopathy,17 and the underlying aetiology of their vestibular damage was either idiopathic (15 patients)18 or sequential vestibular neuritis (four patients).19 In all BVL patients, vestibular deficits had been present for at least 1 year prior to enrolment in the study.
Demographic and survey results
| Male BVL | Female BVL | P-value | Male NC | Female NC | P-value | |
|---|---|---|---|---|---|---|
| Subject number | 10 | 9 | 9 | 10 | ||
| Age | 54.9 ± 12.5 | 61.7 ± 9.5 | 0.2 | 56.2 ± 13.6 | 56.7 ± 10.1 | 0.20 |
| DHI score | 35.8 ± 25.6 | 50.2 ± 23.6 | 0.22 | 1.3 ± 2.7 | 2.9 ± 7.6 | 0.22 |
| Video games | 0 | 2 | 1 | 1 | ||
| VR exposure | 1 | 0 | 2 | 1 | ||
| Xbox controller | 5 | 2 | 4 | 2 |
Summary of the male and female BVL and NC demographic and survey results. The Dizziness Handicap Survey21 is graded from zero (no dizziness) to 100 (worst possible dizziness). A self-described hobby of playing video games is noted, as is prior use of the Xbox input device and prior exposure to VR. For age and DHI score, values are mean ± 1 SD and P-values compare male and female BVL patients (t-test for age: P = 0.2, df = 17, n = 19, t = −1.3; t-test for DHI score: P = 0.22, df = 17, n = 19, t = −1.3).
The ‘inclusion criteria’ for BVL patients were based on an abnormal yaw-axis vestibulo-ocular reflex (VOR) when tested with sinusoidal and impulsive motion stimuli, as described below. Yaw-axis VOR criteria were considered particularly relevant for this study because the primary head movements utilized to navigate through the 2D virtual reality (VR) environment were yaw rotations about the earth-vertical axis. NC subjects were recruited from the community and had normal peripheral vestibular function as confirmed with sinusoidal VOR testing.20 ‘Exclusionary criteria’ for both BVL and NC subjects were a history of any neurological disorder (other than migraine), any other otologic disorder (other than age-appropriate presbycusis) or an orthopaedic problem that affected balance or gait.
Vestibular, auditory and demographic information
Vestibular function was assessed using three standard clinical tests—the VOR was quantified for sinusoidal yaw-axis head rotations and for impulsive rotations in the plane of each canal, and ‘cervical vestibular-evoked myogenic potentials’ (cVEMPs) were measured during auditory stimulation. Subjective dizziness severity was also quantified using the Dizziness Handicap Inventory (DHI),21 and hearing was evaluated using the standard clinical audiogram. We also queried subjects about their level of education, hobbies and professions.
‘Sinusoidal, en bloc, yaw-axis VOR’ responses were assessed using a commercial (Neuralign) chair to test the lateral semicircular canals and their afferent pathways. Rotations were provided over the 0.01–1.0 Hz frequency range using a peak velocity of 40°/s. Eye movements were recorded with Neuralign video goggles, quick phases were removed using a custom, automated programme reviewed by the user, and the slow-phase eye and head velocity time series were analysed across frequencies to calculate the VOR gain, time and bias constants.20 BVL patients were required to have reduced gains over the 0.01–1.0 Hz frequency range and age-adjusted time constants that did not exceed 2.0 s.22
‘Vestibular head impulse testing’ (vHIT) was performed using a commercial (Otometric) head-mounted video system to assess the three semicircular canals in each ear. The examiner delivered randomized (timing and direction) head impulses (100–250°/s peak head velocity) in the plane of each semicircular canal until 10 acceptable responses were recorded for each canal. The VOR gain for each canal was calculated as the slope of the eye versus head velocity plot, and for inclusion, BVL patients were required to have reduced gains (<0.8) for both lateral semicircular canals.
cVEMPs were assessed using standard methods and equipment to evaluate the function of the saccules and their afferent pathways. Tone bursts were provided at 500, 750 and 1000 Hz, and the cVEMP threshold for each ear and frequency was calculated using previously described methods.23
Experimental design
VR environment and navigation protocol
The VR visual scene was provided with a Valve Index headset (Valve Corp) running a customized software algorithm. It consisted of a circular room (radius equivalent to 6 m, height equivalent to 3 m) with white walls and a blue floor and ceiling, and was designed to minimize visual information about spatial location (e.g. no landmarks) or motion (e.g. no texture). An example of the visual scene viewed by the subjects is shown in Fig. 1A and illustrates that visual cues from the target located in the floor and the wall that enclosed the maze could potentially provide information about location and motion in the maze, but overall, the maze was designed to minimize visual position and motion cues. The navigation test performed in this VR visual environment was a ‘return-to-home’ paradigm based on the standard triangle completion task (TCT).24,25 Tests were administered in a dark room, and verbal instructions were provided with sound-cancelling headphones that provided a white noise background to null any external sounds. Subjects wore the VR headset and were guided with visual cues to complete the first two segments (start to first target = 5.6 m long, first target to second target = 5.9 m long) of a triangular path (Fig. 1B). The end-points of the first and second segments of the triangle were indicated with a red disc (diameter 0.5 m) on the virtual floor (Fig. 1A) that disappeared once the subject reached the disc. After completing the first two segments of the triangle, the subjects were instructed to return to their perceived starting position (e.g. to complete the triangle, second target to perceived starting position, Fig. 1B).
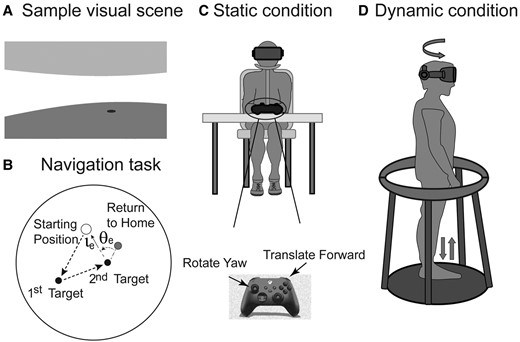
Schematic representation of the VR navigation task. (A) Sample visual scene of a first-person view of the VR environment. (B) Navigation task demonstrating the complete triangle task and the calculation of the angular and linear error. (C) Static navigation task, head and body stationary, navigating with two buttons on the Xbox controller. (D) Dynamic navigation task, schematic showing subject turning in yaw and stepping in place.
To standardize the test and reduce inter-subject variability, subjects were instructed to rotate leftward each time they turned (e.g. to face the next target or towards their perceived starting position). The amplitude of the ideal yaw rotation required to complete each leg of the task was therefore standardized and consisted of three leftward turns—the first two visually guided turns had magnitudes of 66° and 54°, and final ‘return-to-home’ rotation had an ideal magnitude of 60°. No feedback regarding the accuracy of the final segment of the TCT response was provided during or after the testing session. After each trial was completed (indicated by the subject stating they had reached their perceived starting position), the VR scene was blanked for 5 s and then the next trial began with the subject located at the standardized starting position in the VR environment. Each subject completed 12 trials of the static and dynamic versions of the TCT (see below), and the order of the two conditions was randomized between subjects. Dummy trials were interspersed throughout the testing paradigm and consisted of triangles with different path lengths and angles. These dummy trials varied the characteristics of the task and constituted 45% of the total number of TCT trials. Prior to testing, subjects completed 10 practice trials (that utilized different target positions than the testing paradigm) to familiarize themselves with the VR environment and with the static and dynamic conditions, and for the purpose of training, the subjects were shown the correct final position after they completed each trial.
Static and dynamic navigation tasks
For the ‘static’ navigation task (Fig. 1C), subjects were seated with their head secured (with a headband) and faced straight ahead relative to their body. They rotated and translated through the VR environment using key presses on a Microsoft Xbox controller—keys were available to rotate leftward (at an angular velocity of 20°/s) and to translate forward (at a linear velocity equivalent to 1.0 m/s). For the static navigation task, therefore, visual information consisted of the barren environment described above, and only static (time-invariant) idiothetic cues were available to the brain (aside from any information related to pressing the Xbox keys).
The ‘dynamic’ navigation task (Fig. 1D) was designed to generate relatively normal head motion dynamics (and hence vestibular activation) while ambulating in place. Subjects stood on a small platform (Wizdish ROVR Systems, Oxford, UK) and moved through the same VR visual environment by turning their head and body (to rotate in the maze) and by walking in place (to translate forward in the maze). The Valve system tracked the angular position of the head, and yaw head rotations generated a 1:1 rotation of the VR visual scene with a negligible delay. Head rotations were always towards the left, their axis was approximately aligned with the earth-vertical, and head turn dynamics were recorded using the VR headset. Subjects translated in the VR environment by walking in place on the platform—the sound of their footsteps (which was amplified by task-specific shoes with metal discs on the soles) was transformed by the navigation programme into forward translation with a linear velocity of 1.0 m/s, equivalent to a moderate gait cadence of 2 steps/s.26 A smooth circular railing with no localizing information (Fig. 1D) was available to the subjects if they needed to stabilize their balance during the test, but they were instructed to only touch the railing when necessary.
The dynamic navigation task provided the same visual information as the static task, but head and body motion also generated time-variant vestibular, proprioceptive and efferent motion cues. We chose this specific task so the postural instability and ataxia that is often present in BVL subjects would not degrade the dynamics of head and body movements or navigation performance. Further, we avoided the potential confounders introduced in prior studies, such as walking while blindfolded, with or without an escort holding the subject. As discussed in detail below, similar to a testing protocol that has been used in rodent navigation studies where the animals walked in place on a trackball while they viewed a VR visual environment that responded to their motion,27 our dynamic task generated normal vestibular and other idiothetic cues, with the exception of the linear acceleration aligned with the head’s x-axis (naso-occipital), which was minimal due to the lack of forward translation.
Data collection and analysis
Navigation performance
For both the static and dynamic versions of the TCT, five metrics were used to assess navigational performance. For each trial, the size of the ‘error’ was calculated in radial coordinates, defined as the angular and linear difference between the subject’s end-point after their ‘return-to-home’ response and the ideal response that would have returned them to their starting position (Fig. 1B). Navigational ‘inaccuracy’ was defined as the mean angular (linear) error of their responses, and navigational ‘imprecision’ was defined as the standard deviation of the angular (linear) response errors. We also quantified the ‘path length’ for the final segment of the TCT—the distance in 2D space that the subject travelled from second target to their perceived starting position.
Analysis of navigation—comparing responses across groups and tasks
Our study included three sets of independent parameters—sex (male/female), vestibular status (NC, BVL) and task (static, dynamic), where the static task provided time-variant visual information to the brain and the dynamic task added time-variant vestibular (and other idiothetic) information. To assess the effects of these parameters on navigation performance, we examined differences in navigation metrics between groups but within tasks and between tasks but within groups. The underlying assumption was that performance differences reflected the accuracy and precision of the brain’s estimates of position and motion within the maze that were derived from the available sensorimotor information. Potential differences in the performance errors arising from the motor aspects of each specific task, referred to as ‘execution errors’,28 must also be considered since differences in navigational performance could also reflect task- or group-specific movement errors (see ‘Discussion’).
Statistical analysis
All statistical analyses were conducted with MATLAB (Mathworks Inc., Natick, MA) and RStudio (R Core Team, Boston, MA) software. Preliminary analysis of the data with the Shapiro–Wilk test demonstrated that some of the measured variables were not normally distributed, so non-parametric statistical tests (Mann–Whitney U-test, Wilcoxon signed-rank test and Holm–Sidak test) were used for these data. Normally distributed data were analysed using standard parametric tests (e.g. t-tests and ANOVA). After correcting for repeated comparisons, a P-value of 0.05 or less was considered to be statistically significant. The number of subjects tested in our study was relatively small (19 BVL patients, 19 NC), and power analysis using preliminary angular precision data showed that relatively large effect sizes (∼12°) were required to identify a statistically significant difference (P < 0.05) between groups (power 0.8) given the variability of our preliminary results (SD ∼8°). Comparisons that did not reach statistical significance, therefore, must be interpreted cautiously since they could represent false (rather than true) negative results that are due to the modest size of the study population.
Results
Demographic, vestibular and auditory data
The ages and subjective dizziness (DHI) scores for the four subject groups (male BVL, female BVL, male NC, and female NC) are shown in Table 1. Although the male BVL patients were on average younger and had lower DHI scores than the female BVL group, these differences were not significant and neither age nor DHI score correlated with any of the navigation metrics (below). The male and female NC groups did not differ with regard to age or DHI score. The two male (BVL, NC) and two female groups (BVL, NC) were equivalent in age, but as expected, they differed substantially in DHI score, as the male and female BVL subjects had moderately severe subjective dizziness (DHI scores in the 35–50 range) while the two NC groups were essentially asymptomatic (DHI scores in the 1–3 range). A video game hobby or prior VR exposure was reported in a very small number of subjects, but more subjects had used the Xbox input device at least once in the past (Table 1). Education levels were equivalent between the two sexes and vestibular states, with all subjects attending college except for one BVL and two NC subjects who had high school educations. Each subject was asked to document their occupational history and to list their hobbies, and no subjects had jobs or hobbies that required exceptional visuospatial or motor skills (e.g. airplane pilot, gymnast or figure skater).
Table 2 shows the vestibular and auditory test results for the male and female BVL subjects. All 19 of the BVL patients had sinusoidal and impulsive (vHIT) VOR testing and audiograms, while 16 BVL patients also had cVEMPs. There were no significant differences between male and female BVL patients on any of these tests. In particular, for the sinusoidal VOR, the mean gain and time constant20 were very low for men and woman but did not differ between sexes (normal gain constant in our lab is defined as >0.61 and normal time constant as >12.6 s).20,22 Similarly, the lateral canal VOR gains calculated with vHIT testing were markedly reduced in the male and female groups but were equivalent in both sexes. cVEMP thresholds were abnormal in 55% of men and 57% of female BVL patients, and the average pure tone hearing thresholds were normal in both ears for male and female BVL patients.
Vestibular and auditory test results in BVL patients
| Male BVL | Female BVL | Subject number | |
|---|---|---|---|
| Sinusoidal VOR | 19 | ||
| Time constant (s) | 0.38 ± 0.25 | 0.24 ± 0.23 | |
| Gain constant | 0.43 ± 0.18 | 0.41 ± 0.28 | |
| vHIT VOR (gain) | 19 | ||
| LL | 0.4 ± 0.3 | 0.5 ± 0.3 | 17 |
| LA | 0.5 ± 0.2 | 0.7 ± 0.5 | 15 |
| LP | 0.4 ± 0.1 | 0.6 ± 0.3 | 16 |
| RL | 0.4 ± 0.2 | 0.5 ± 0.4 | 19 |
| RA | 0.5 ± 0.2 | 0.5 ± 0.2 | 16 |
| RP | 0.4 ± 0.2 | 0.6 ± 0.2 | 17 |
| cVEMP | 16 | ||
| Normal function (n) | 4 | 3 | |
| Mean threshold (dB) | 89.7 | 86.7 | |
| Abnormal unilateral (n) | 1 | 1 | |
| Mean threshold (dB) | 98.3 | 100 | |
| Abnormal bilateral (n) | 4 | 3 | |
| Mean threshold (dB) | 99.8 | 104.6 | |
| Audiogram | 19 | ||
| Mean PTA right (dB) | 16.1 | 11.9 | |
| Mean PTA left (dB) | 16.3 | 10.3 |
Summary of the vestibular and auditory test results in the BVL patients, presented as means ± 1 SD. VOR measures were obtained in all 19 BVL patients and included yaw-axis sinusoidal responses (time and gain constant) and impulsive (vHIT) responses (gains), with the latter provided for each of the six semicircular canals [left lateral (LL), left anterior (LA), left posterior (LP), right lateral (RL), right anterior (RA), and right posterior (RP)]. cVEMPs were also obtained in nine men and seven women, and the distribution between normal, abnormal unilateral and abnormal bilateral thresholds is indicated. All 19 BVL patients had standard audiograms, and the mean pure tone average (PTA) hearing loss for each ear is shown, which are within the normal range for both the male and female BVL groups.
Navigation results
Overview of navigational responses
Figure 2 shows the ‘trials from a single male BVL and NC subject’ on the dynamic and static paradigms and illustrates how the navigation metrics differed between subjects and tasks. The first two, visually guided legs of the TCT task are shown as dashed black arrows [starting position (open circle) to the first target (first black circle), and first to the second target (2nd black circle)]. The subject’s ‘return-to-home’ trials from the second target to the perceived starting position are shown in grey, with the mean end position (perceived starting point) illustrated by a black X. These examples show a variety of inaccuracy (mean error) metrics, ranging from excellent angular and linear accuracy in Fig. 2D to poor angular and linear accuracy in Fig. 2A. Similarly, imprecision (variability) metrics ranged from good angular and linear precision in Fig. 2B and C to poor angular and linear precision in Fig. 2A. Below, we compare the five navigational metrics (angular inaccuracy and imprecision, linear inaccuracy and imprecision, and path length) derived from the final ‘return-to-home’ component of the TCT task between subject groups (male/female, BVL/normal) and paradigms (static/dynamic).
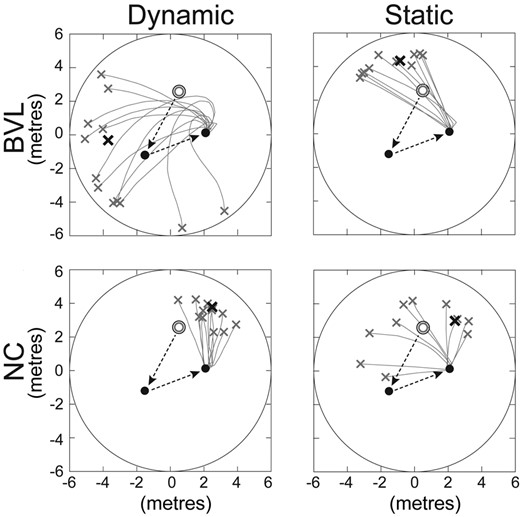
Sample trials on the dynamic and static conditions. Data from one BVL and one NC subject; the open circles are the start (home) positions, and the dashed black arrows show the first two visually guided legs of the TCT. The solid lines show the different ‘return-to-home’ trials with the bold X showing the mean end position. x- and y-axes are in units that are equivalent to metres (m), based on the size of the virtual image (Fig. 1A).
Comparisons within the male and female groups
Normal versus vestibular-deficient populations on the static paradigm
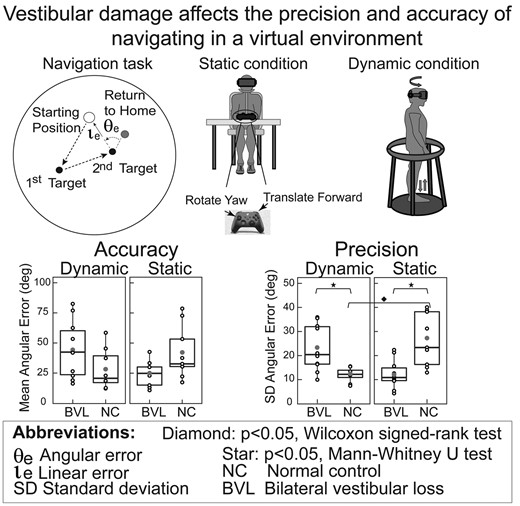
Figures 3 and 4 show that on the static task, ‘BVL men’ had better angular and linear precision (e.g. smaller SD) than NC men (angular: Mann–Whitney U = 8, P < 0.01; linear: Mann–Whitney U = 13, P = 0.01), while ‘BVL women’ were equivalent to NC women on all five navigation metrics.
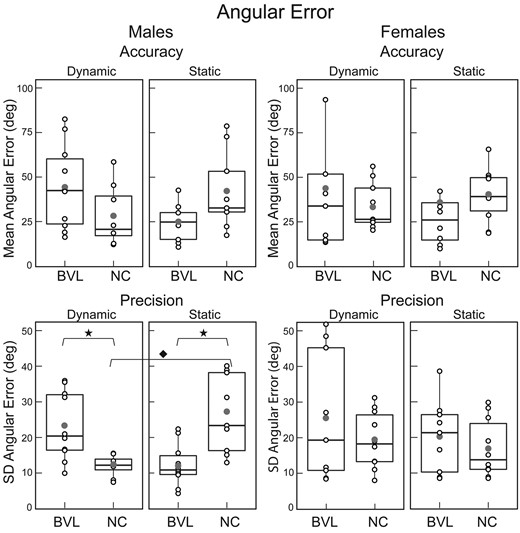
Mean ‘angular’ error (inaccuracy) and standard deviation of angular error (imprecision). Box plots for the static and dynamic tasks in NC and BVL men and women. Vertical lines represent the 25th and 75th percentile range; horizontal line bisecting the box represents the median value; the filled dot represents the mean value; and open circles show the value for each individual subject. Statistically significant comparisons (P < 0.05) are represented by filled stars for the Mann–Whitney U-test and a filled diamond for the Wilcoxon signed-rank test. ‘Angular precision’: BVL/male/dynamic versus NC/male/dynamic, Mann–Whitney U-test, U = 71, P = 0.01; BVL/male/static versus NC/male/static, Mann–Whitney U-test, U = 81, P = 0.02; NC/male/dynamic versus NC/male/static, Wilcoxon signed-rank test, V = 40, P = 0.03. Population size: BVL/male = 10; BVL/female = 9; NC/male = 9; NC/female = 10. SD, standard deviation.
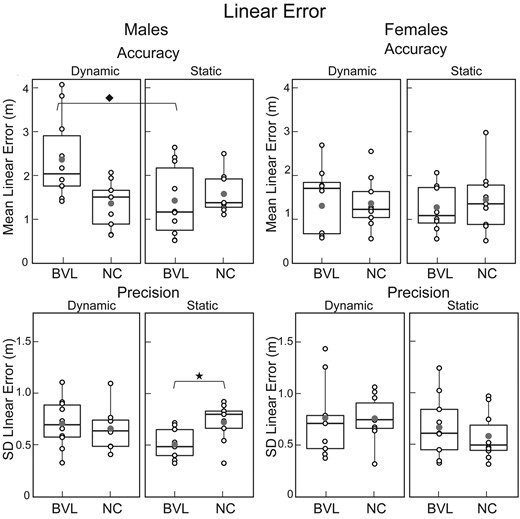
Mean ‘linear’ error (inaccuracy) and standard deviation of linear error (imprecision). Box plots for the static and dynamic tasks in NC and BVL men and women, organized like Fig. 3 with the same icons. ‘Linear accuracy’—BVL/male/dynamic versus BVL/male/static, Wilcoxon signed-rank test, V = 53, P = 0.03; ‘linear precision’—BVL/male/static versus NC/male/static, Mann-Whitney U-test, U = 8, P = 0.01. Population size: BVL/male = 10; BVL/female = 9; NC/male = 9; NC/female = 10. SD, standard deviation.
Normal versus vestibular-deficient populations on the dynamic paradigm
Figures 3–5 demonstrate that on the dynamic task, ‘BVL men’ had worse angular precision (Mann–Whitney U = 71, P < 0.01) and longer path lengths (Mann–Whitney U = 77, P < 0.01) than NC men. In contrast, Figs 3–5 also illustrate that ‘BVL women’ were equivalent to NC women on all five navigation metrics.
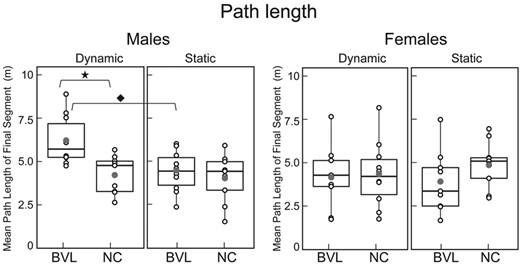
Mean ‘path length’ of final ‘return-to-home’ segment. Box plots for the static and dynamic tasks in NC and BVL men and women, organized like Figs 3 and 4 with the same icons. BVL/male/dynamic versus BVL/male/static, Wilcoxon signed-rank test, V = 55, P = 0.01; BVL/male/dynamic versus NC/male/dynamic, Mann–Whitney U-test, U = 77, P = 0.02. Population size: BVL/male = 10; BVL/female = 9; NC/male = 9; NC/female = 10.
Dynamic versus static paradigms in the normal and vestibular-deficient populations
Figures 3–5 show that normal men had better angular precision on the dynamic compared to the static task (Fig. 3B; Wilcox signed-rank test, P < 0.01). In contrast, vestibular-deficient men had worse linear accuracy (Wilcox signed-rank test, P = P < 0.01) and longer path lengths (Wilcox signed-rank test, P < 0.01) on the dynamic compared to the static task. Both the normal and vestibular-deficient female subjects performed equivalently on the static and dynamic tasks (Figs 3–5).
Summary of navigation results for men and women
For each sex, we made four statistical comparisons (NC versus BVL on static task, NC versus BVL on dynamic paradigm, static versus dynamic paradigm for BVL and static versus dynamic paradigm for NC) for each of the five metrics (angular precision and accuracy, linear precision and accuracy, path length). For ‘men’, significant differences were observed for three-fourth angular precision, two-fourth path length, one-fourth linear error and precision and no angular accuracy comparisons (Figs 3–5). The primary effects of vestibular state and test paradigm in men were in their non-linear interactions, which were significant for three of the five navigation metrics: two-way ANOVA showed significant vestibular–paradigm interaction terms for angular precision (F = 17.4, P < 0.01), linear accuracy (F = 6.8, P = 0.03) and path length (F = 4.5, P = 0.04). In contrast, in ‘women’, none of the four comparisons between vestibular/paradigm states were significant for any of the five navigation metrics, and two-way ANOVA in women showed no significant interactions, vestibular or paradigm effects for any of the five metrics (P-values were > 0.2 for all analyses). Taken together, these results show that for men, vestibular information affected navigation performance on our TCT paradigm, but the results provide no evidence that vestibular information affected navigation performance in women.
Comparisons between the male and female groups
Comparison of male and female subjects demonstrates that when vestibular function was ‘normal’, the only significant sex-based difference was angular precision on the static paradigm (Fig. 3), which was better in women than men (Mann–Whitney, U = 20, P = 0.04). Among the ‘vestibular-deficient’ subjects (Figs 3–5), in contrast, men had worse linear accuracy (Mann–Whitney, U = 14, P < 0.05) and longer path lengths (Mann–Whitney, U = 15, P < 0.05) than women on the dynamic paradigm, and men had better angular precision (Mann–Whitney, U = 63, P = 0.05) than women on the static paradigm.
The primary sex-dependent effects were evident in the ‘interaction’ terms: three-way ANOVA that examined all data (both sexes, both vestibular states and both paradigms) for each of the five navigation metrics showed a significant non-linear effect of ‘sex on the interaction between vestibular state and navigation paradigm for angular precision’ (F = 4.5, P = 0.04) and between sex and vestibular state for path length (Holm–Sidak: F = 7.1, P = 0.04). In contrast, when considered individually, sex, vestibular state and test paradigm did not significantly affect any of the five metrics.
Correlations between navigation metrics and other test parameters
Yaw VOR deficits were the primary inclusion criteria for BVL classification and were presumably the most relevant vestibular metric for the dynamic navigation task, since head rotations in yaw were required to turn between targets. Neither the sinusoidal yaw measures (gain, time constant) nor the vHIT lateral canal gains, however, correlated with any navigation metric. Furthermore, while z-axis accelerations are prominent when walking29 and are primarily sensed by the saccules, the clinical measure of saccular function (cVEMP) did not correlate with navigation metrics, nor did vHIT vertical canal gains or auditory function. Finally, navigation metrics were not correlated with either age or dizziness severity (DHI score).
Head motion characteristics during the dynamic paradigm
Angular head rotations during the dynamic paradigm were characterized by a rapid acceleration followed by a slow deceleration. The ‘peak horizontal angular head velocity’ during the first head rotation of the TCT (BVL male 133°/s, NC male 138°/s, BVL female 142°/s and NC female 150°/s) was equivalent in the four groups (t-tests comparing sex: P = 0.6 for BVL, P = 0.7 for NC; t-tests comparing vestibular status: P = 0.6 for males, P = 0.8 for females), and two-way ANOVA confirmed an absence of sex (P = 0.8) or vestibular (P = 0.3) effects on peak head velocity and the absence of a significant sex–vestibular interaction (P = 0.2). ‘Power analysis’ for the horizontal angular head velocity during the first TCT head turn showed that the dominant frequency (BVL male 0.6 Hz, NC male 0.5 Hz, BVL female 0.5 Hz and NC female 0.7 Hz) was equivalent in the four groups (t-tests comparing sex: P = 0.5 for BVL, P = 0.1 for NC; t-tests comparing vestibular status: P = 0.4 for males, P = 0.1 for females). Two-way ANOVA confirmed an absence of sex (P = 0.5) or vestibular (P = 0.6) effects on the dominant frequency and the absence of a significant sex–vestibular interaction (P = 0.1).
Discussion
Effects of vestibular damage and testing paradigm on navigation
Sensorimotor mechanisms
In normal subjects, the trio of self-generated, idiothetic (vestibular, proprioceptive and efferent) cues and the external, allothetic (visual) cues provided to the brain during navigation are partially redundant, and this redundancy is predicted to reduce the variability of the central position and motion estimates, since these cues are presumably synthesized by the brain using a Bayesian computation30 that minimizes variability.31 Changes in the degree of sensorimotor redundancy, therefore, were predicted to be most evident in the precision metrics. Furthermore, our dynamic task generated relatively normal angular (but not linear) head movements, so ‘angular precision’ was hypothesized to be the more relevant of the five metrics we measured. Consistent with these predictions, in normal men, the addition of idiothetic cues to visual information improved angular precision, as evidenced by reduced angular variability on the dynamic (idiothetic + visual inputs) compared to the static (visual inputs) paradigm. In contrast, in vestibular-deficient men, the addition of idiothetic cues did not affect performance, implying that the salutary effects of the proprioceptive and efferent cues were negated by the derogatory effects of the damaged vestibular input.
Vestibular influences on navigation can be segregated from the trio of idiothetic cues by comparing the performance of normal and vestibular-deficient subjects on the dynamic paradigm (which activates vestibular sensors using self-generated head movements). We found that normal men had better angular precision than vestibular-deficient men on the dynamic task, but that angular accuracy was equivalent in the two groups. These results are consistent with the predictions of a Bayesian computation—vestibular-dependent changes in precision were predicted because peripheral rotational afference was rendered less reliable by vestibular damage, but changes in accuracy should only occur if vestibular damage introduced a directional bias to the canal-mediated rotational cue. Furthermore, in response to vestibular damage, non-vestibular sensorimotor cues should be weighted more heavily by the brain32 and this was observed in our study, since vestibular-deficient men improved their ability to utilize visual information, evidenced by improved angular precision on the static (visual inputs) paradigm compared to normal subjects.
Of note, an alternative explanation for some of these findings could be that during self-generated head movements, normal men effectively cancelled vestibular afference in the brain,16 while damage to the peripheral sensors degraded this central cancellation process. A potential mechanism for this phenomenon is that normal subjects have an accurate internal model of the vestibular sensors and their dynamics (and hence can accurately predict and therefore cancel vestibular afference during self-generated head motion), but patients with peripheral vestibular damage have not adequately recalibrated this internal model and therefore have noisier (rather than cancelled) vestibular information in the brain.33 Comparing the effects of vestibular damage on navigation during ‘active’, self-generated head movements (our dynamic paradigm) with a paradigm that employs ‘passive’ en block rotations (which we are currently studying) would be one way to investigate these issues further, since the latter would not activate vestibular cancellation mechanisms.
In contrast to the trio of internally consistent findings in male subjects (better dynamic than static performance in normal men, better performance in normal compared to vestibular-deficient men on the dynamic paradigm and better performance in vestibular-deficient compared to normal men on the static paradigm), neither normal nor vestibular-deficient women performed differently on the static and dynamic paradigms, and women performed equivalently on the dynamic and static tasks independent of their vestibular status. As discussed below, these results suggest that on our paradigms, women navigated in a manner that was independent on dynamic vestibular information.
Potential role of execution errors
The above discussion is based on the presumption that the navigation differences observed with the different combinations of sex, paradigm and vestibular status reflect the veracity of brain’s sensorimotor encoding of head position and motion. Before reaching this conclusion, however, it is important to consider how differences in these three variables could affect the execution of the motor response that returned the subject to their perceived starting position.28 On the ‘static’ task, the motor component was limited to button presses, so vestibular and sex-dependent motor differences could not conceivably produce the BVL NC differences observed in men. The ‘dynamic’ task involved turning and walking in place, and it is plausible that vestibular-deficient subjects may have experienced more difficulty executing these movements than normal subjects.
It is unlikely that execution errors explain our results, however, because the platform’s railing stabilized balance; angular head dynamics (the stimulus for rotation in the VR environment) were equivalent in BVL and normal subjects; and the BVL NC difference only occurred in men, which would imply that the motor dysfunction caused by vestibular deficiency is sex specific. While this is an unlikely prospect, male and female subjects likely differed in height (a parameter we did not measure), with men being taller on average. It is possible that this physical difference between the sexes could have introduced a tendency for greater linear/path length errors in men than in women (see below), particularly in the BVL state.
Comparing ‘static and dynamic’ tasks, the motor aspects differed considerably, with the static task limited to button presses and dynamic task requiring turning and walking in place. It appears unlikely, however, that execution errors underlie our results, since improved performance on the dynamic task relative to the static task was only observed in normal men. If motor responses dominated these results, BVL men would presumably perform worse on the dynamic task given their imbalance, and women would have the same response pattern as men, and these findings were not observed. Taken together, these considerations render it unlikely that ‘execution errors’ related to three independent parameters (sex, vestibular status and navigation task) were primarily responsible for the pattern of navigation metrics we observed.
Sex influences on navigation
Our results demonstrate several internally consistent sex-dependent findings: in men, vestibular information affected navigation performance when the head was moving (dynamic task) and stationary (static task); in women, vestibular information had no apparent effect on any of the navigation metrics and navigation seemed to be independent of the paradigm (static, dynamic) as well as vestibular (BVL, NC) status. These observations are most conclusive for angular precision but were also observed for other metrics. While false negative results in women cannot be excluded (e.g. vestibular effects could be present in women but are too small to identify), it is evident that there is at a minimum a ‘quantitative’ difference in how men and women utilize vestibular information when navigating on our task, even if a qualitative difference cannot be proven.
Sex-dependent differences in navigation have been described for testing paradigms performed with the head stationary13,14 but not for paradigms where subjects moved and therefore activated dynamic vestibular (and other) idiothetic cues.7 Indeed, prior navigation studies that employed physical motion have described degraded navigation in women with vestibular damage (c.f. Peruch et al.9 and Glasauer et al.34), which we did not observe. This divergence in results may be methodological in origin (see below) or could primarily relate to task-dependent strategic influences. Navigational strategy35 is often described as ‘place’ (move towards a location in space) or ‘response’ (move by replicating a motor pattern); the former is thought to depend on the vestibular–hippocampal axis and the latter on striatal activation,36,37 although more recent work questions this anatomic dichotomy.38 If women favour a ‘response’ and men a ‘place’ strategy, this would render women less dependent on vestibular information than men. Furthermore, this strategic difference could be emphasized in our study since the reductionist ‘return-to-home’ protocol favours a ‘place’ rather than a ‘response’ strategy, although response strategies based on counting steps or other similar proxies could be employed in our paradigm.
Several alternate explanations for our findings are also possible. For example, it may be that women are simply less flexible than men in their sensory integration strategy and tend to rely preferentially on visual information during the navigation tasks.39,40 This could explain why women do not show improvement on the dynamic task, despite the availability of non-visual idiothetic cues on this paradigm, compared to the vision-only static task. Conversely, it may be that women do utilize vestibular information during our navigation task but compensate better than men after vestibular damage41 such that vestibular-deficient women perform as well as normal women. This explanation is not persuasive because the efficacy of vestibular compensation has never been demonstrated to be sex dependent,42 and because compensation should include optimization of extra-vestibular information, which was observed in the visual system for men but not for women. The effects of vestibular damage on navigation could also depend on the complexity of the task,9 so women may employ vestibular and other idiothetic cues but only on tasks that are more difficult than ours, and unlike men could perform the simple return-to-home task using only visual information.
Physical differences between male and female subjects, such as a taller average body height and leg length in the former, could also have potentially affected the pattern of response errors on the TCT and, in particular, may have affected metrics that include a translational component (e.g. linear error, path length). Physical differences between sexes are unlikely to affect angular responses on the dynamic paradigm (c.f. Fig. 3B and D), however, or responses on the static paradigm (c.f. Figs. 3B and D and 4B and D), since height/leg length would not alter the rate of turns on the former or movement driven by key presses on the latter. These sex-dependent response errors, therefore, support the presence of navigation differences in men and women that are independent of physical body parameters, which we did not quantify in the current study but plan to measure in future work.
Advantages and constraints of our approach
Vestibular information produced by the dynamic task
The dynamic task was designed to generate idiothetic information similar to normal walking. This was true for proprioceptive and efferent cues, and for vestibular inputs encoding ‘head rotation’, since head turns were self-generated, physiologic in their dynamics43 and rotated subjects within the VR environment with a negligible lag. In particular, unlike prior human navigation studies where head rotations appeared to be very slow, with our dynamic paradigm, angular head movements had velocity and frequency characteristics that were adequate to robustly modulate the lateral canal afference. ‘Head translations’, however, were less physiologic because subjects walked in place rather than ambulating forward. The advantage of this approach, which is similar to some rodent studies,27 is that head rotation dynamics were not degraded in BVL subjects by ataxia, nor were they rendered non-physiologic by the experimental paradigm itself—rather than walking slowly and cautiously in the dark or grasping an escort,9,34 subjects walked and turned normally since the guardrail was available to stabilize balance if necessary. The disadvantage of our approach, however, was that little linear acceleration was aligned with the x-axis (naso-occipital),43 although z-axis (up–down) linear accelerations were presumably normal. In sum, the dynamics of head rotations were optimized by our paradigm and were more physiologic than prior studies that employed physical ambulation, but the dynamics of head translation were less physiologic because negligible x-axis accelerations occurred. For these reasons, we focus primarily on the angular components of the navigational response, which also appear to be more sensitive to vestibular damage than the linear components,44,45 and indeed angular responses were consistently affected by both vestibular status and test paradigm in men, while differences in linear responses were less consistent.
Characteristics of the navigation task
The relatively barren visual environment was chosen so allothetic position and motion cues would be present but weak and not dominate navigational responses,46 an important consideration in human studies since people typically rely on visual landmarks to navigate when they are available.47 Furthermore, since our goal was to identify vestibular influences on navigational performance, we purposely chose a reductionist navigation task and standardized the direction of head rotations so cognitive influences and response variability would be minimized, allowing us to identify performance features associated with vestibular status and sex. In contrast, more complex tasks typically generate more variable responses and are more readily influenced by cognitive strategizing.48
Statistical issues
As noted above, since our subject populations were small, relatively large effect sizes were required to reach statistical significance. This implies that some of our ‘negative’ findings may have shifted to ‘positive’ if we had a larger group of BVL and NC subjects. It is notable, however, that the significant paradigm and vestibular-dependent effects observed in men were not observed qualitatively in women. Furthermore, despite the constraints due to small subject populations, we still found many significant paradigm and vestibular-dependent effects within the male population and a significant effect of sex on the paradigm–vestibular interaction for angular precision, which we considered the most important of the five navigation parameters. Finally, even though we had only 9–10 subjects in each of our four subject groups, this population size is still substantially larger than many prior human navigation studies (c.f. Peruch et al.9 and Glasauer et al.34) and is nearly double the number of subjects that were tested in the most influential paper on vestibular contributions to navigation in humans.5
Conclusion
Our results demonstrate that when they performed our TCT task in a virtual visual environment, men used idiothetic information to navigate, relied on vestibular cues and improved their ability to use visual information when the vestibular inputs are degraded. In contrast, we found no evidence that women used idiothetic cues to navigate, relied on vestibular information or adjusted their utilization of visual information when vestibular inputs were degraded. The biological underpinnings for these findings are uncertain, and further studies are needed to clarify their significance.
Acknowledgements
We thank Jeffrey Taube, Heather Panic and M. David Balkwill.
Funding
None declared.
Competing interests
The authors report no competing interests.
Data availability
De-identified data generated by this study are available at our laboratory’s website: https://www.masseyeandear.org/research/otolaryngology/vestibular.
References
Author notes
Divya A Chari, Maimuna Ahmad and Richard F Lewis contributed equally to this work.
