


Abstract
Succinic semialdehyde dehydrogenase deficiency is a rare autosomal recessively inherited metabolic disorder of γ-aminobutyric acid catabolism manifested by intellectual disability, expressive aphasia, movement disorders, psychiatric ailments and epilepsy. Subjects with succinic semialdehyde dehydrogenase deficiency are characterized by elevated γ-aminobutyric acid and related metabolites, such as γ-guanidinobutyric acid, and an age-dependent downregulation of cerebral γ-aminobutyric acid receptors. These findings indicate impaired γ-aminobutyric acid and γ-aminobutyric acid sub-type A (GABAA) receptor signalling as major factors underlying the pathophysiology of this neurometabolic disorder. We studied the cortical oscillation patterns and their relationship with γ-aminobutyric acid metabolism in 18 children affected by this condition and 10 healthy controls. Using high-density EEG, we recorded somatosensory cortical responses and resting-state activity. Using electrical source imaging, we estimated the relative power changes (compared with baseline) in both stimulus-evoked and stimulus-induced responses for physiologically relevant frequency bands and resting-state power. Stimulus-evoked oscillations are phase locked to the stimulus, whereas induced oscillations are not. Power changes for both evoked and induced responses as well as resting-state power were correlated with plasma γ-aminobutyric acid and γ-guanidinobutyric acid concentrations and with cortical γ-aminobutyric acid measured by proton magnetic resonance spectroscopy. Plasma γ-aminobutyric acid, γ-guanidinobutyric acid and cortical γ-aminobutyric acid were higher in patients than in controls (P < 0.001 for both). Beta and gamma relative power were suppressed for evoked responses in patients versus controls (P < 0.01). No group differences were observed for induced activity (P > 0.05). The mean gamma frequency of evoked responses was lower in patients versus controls (P = 0.002). Resting-state activity was suppressed in patients for theta (P = 0.011) and gamma (P < 0.001) bands. Evoked power changes were inversely correlated with plasma γ-aminobutyric acid and with γ-guanidinobutyric acid for beta (P < 0.001) and gamma (P < 0.001) bands. Similar relationships were observed between the evoked power changes and cortical γ-aminobutyric acid for all tested areas in the beta band (P < 0.001) and for the posterior cingulate gyrus in the gamma band (P < 0.001). We also observed a negative correlation between resting-state activity and plasma γ-aminobutyric acid and γ-guanidinobutyric acid for theta (P < 0.001; P = 0.003), alpha (P = 0.003; P = 0.02) and gamma (P = 0.02; P = 0.01) bands. Our findings indicate that increased γ-aminobutyric acid concentration is associated with reduced sensory-evoked beta and gamma activity and impaired neuronal synchronization in patients with succinic semialdehyde dehydrogenase deficiency. This further elucidates the pathophysiology of this neurometabolic disorder and serves as a potential biomarker for therapeutic trials.

Introduction
Succinic semialdehyde dehydrogenase deficiency (SSADHD) is an ultra-rare autosomal recessively inherited disorder of γ-aminobutyric acid (GABA) degradation caused by inactivating mutations of the ALDH5A1 gene.1-4 Patients with SSADHD have profound neurological and psychiatric morbidity, including seizures, developmental disability, intellectual deficiency, language impairment and movement disorders.1,5-11 Lifespan does not appear to be affected, although there are reports of sudden unexplained death of epilepsy in SSADHD adults.12,13 Approximately 300 patients have been identified worldwide,1,14 but the true prevalence is likely higher considering the non-specific neurological phenotype and potential for under-diagnosis.
The biochemical hallmark of SSADHD is elevation of GABA, γ-hydroxybutyric acid and GABA-derived metabolites in physiologic fluids.15,16 Post-mortem tissue analyses in a patient with SSADHD recently reported elevations in concentrations of γ-guanidinobutyric acid (GGB).17 Imaging studies with flumazenil positron emission tomography showed decreased γ-aminobutyric acid sub-type A (GABAA) receptor binding, suggesting downregulation of GABAA receptors secondary to chronically elevated cortical levels of endogenous GABA.18 Cortical levels of the excitatory neurotransmitter glutamate are variable, but there is strong evidence of pronounced deficiency in brain glutamine, the metabolic precursor of glutamate and an essential component of the astrocyte-neuron GABA/glutamate recycling pathway.19-21 Together, these findings point to a significant impairment of central neurotransmission in SSADHD, with excessive GABA, decreased GABAA receptor activity and impaired GABA-glutamate recycling. These metabolic and signalling abnormalities are likely underlying the neurological and psychiatric manifestations of SSADHD. Yet, to date, this hypothesis lacks experimental confirmation.
Proton magnetic resonance spectroscopy (1H-MRS) enables in vivo non-invasive measurement of cortical glutamate and GABA. In healthy adults, 1H-MRS of GABA has been used to show functional regionally specific correlations between the levels of GABA in the brain and behaviour, such as tactile frequency discrimination22 and learning.23 Abnormal levels of GABA measured with 1H-MRS have been reported in several neurodevelopmental, psychiatric and neurological disorders.24 Recent animal25,26 and non-invasive human studies27,28 have also related in vivo cortical GABA measures with frequency-specific cortical oscillations. Previous magnetoencephalography (MEG) studies in healthy adults have demonstrated associations between gamma activity (∼40 Hz) during a visual stimulation task and 1H-MRS–derived cortical GABA concentrations29 and post-movement beta activity (from ∼15 to 30 Hz) during a finger motor task as well as GABA to N-acetyl-aspartate (NAA) ratio.30 A multi-modal MEG and flumazenil positron emission tomography study showed that GABAA receptor densities are positively correlated with frequency and negatively correlated with the amplitude of visually induced gamma oscillations in the primary visual cortex of healthy adults.31 Yet, there is still a lack of evidence linking the in vivo cortical GABA and cortical electrophysiological measures with the in vitro GABA plasma levels in healthy individuals as well as patients with a GABAergic disorder.
This study evaluated the neurophysiological effect of GABA on neuronal synchronization in subjects with SSADHD. To this end, we investigated the relationship between the amplitude and frequency of in vivo somatosensory evoked and induced cortical responses and resting-state brain activity, in vivo cortical GABA concentrations measured through 1H-MRS and in vitro plasma GABA and GGB concentrations in subjects with SSADHD versus healthy controls. We hypothesized that plasma GABA and GGB levels and resting-state 1H-MRS–derived cortical GABA concentrations will correlate negatively to somatosensory evoked and induced cortical response amplitude and power of beta and gamma frequency bands.
Material and methods
Participant recruitment
We recruited 18 patients with SSADHD [age: 2–39 years; median: 7 years (inter-quartile range: 4–12.5); 8 females] from the ongoing SSADHD Natural History Study led by Boston Children’s Hospital. The study received ethical approval from Boston Children’s Hospital Institutional Review Board (IRB-P00029917). All the enrolled patients had genetically confirmed SSADHD. We also recruited 10 neurotypical controls from the community, who did not differ in age range and sex distribution [age: 6–34 years; median: 14.3 (inter-quartile range: 10.6–22.5); five females]. Recruitment of the study group was unbiased, as subjects with all degrees of disease severity participated. The clinical severity scores of our study participants, as assessed by a validated SSADHD-specific severity scoring system,32 are detailed in Supplemental Table 1. This severity scoring system ranges from 5 (severe) to 25 (mild).
Plasma γ-aminobutyric acid and γ-guanidinobutyric acid
Plasma specimens were collected at Boston Children’s Hospital facilities by a registered phlebotomist according to the hospital’s specimen collection procedures.33 The specimens were placed in a lithium heparin tube, separated from cells after collection and frozen below −20°C. GABA concentrations were measured by ELISA using a commercially available kit (GABA ELISA kit, LDN, Nordhorn, Germany). Measurements of GGB concentrations were performed using stable isotope dilution gas chromatography-mass spectrometry as previously described.34
Resting-state brain activity and somatosensory cortical responses
We recorded resting-state brain activity and somatosensory-evoked responses to pneumatic stimuli of upper extremities from all participants with a sampling rate of 1 KHz using a 64-channel high-density EEG (HD-EEG) system (eegoTMmylab, ANT Neuro, Netherlands; Fig. 1A). We selected the use of pneumatic stimulation to elicit cortical responses (instead of far-field somatosensory responses with transcutaneous electrical stimulation) because is more suitable for children, particularly those with developmental delays. We initially placed the HD-EEG cap on the participant’s head and ensured that resistances were <10 KOhms for all electrodes. Then, we recorded resting-state data for 5 min, during which the participants had their eyes open, fixating on a cartoon figure displayed on a screen in front of them. Eyes fixation on a visual target is a well-established experimental paradigm used from several researchers who examine resting-state brain activity.35,36 This technique is used to minimize the contamination of EEG signals from biological artefacts generated by eye movements, eye blinking and saccades.

Somatosensory cortical responses. (A) HD-EEG cap (64 channels) on the head of a patient with SSADHD (patient #1); (inlet panel) pneumatic stimulators attached to the distal, volar parts of the patient’s four digits (i.e. thumb, index, middle finger, and pinky). (B) Relative location of HD-EEG electrodes with respect to patient’s scalp and cortex (upper panel), and location of the virtual channel placed contralateral to the stimulation site’s primary somatosensory cortex (S1) (lower panel). (C) Averaged somatosensory-evoked cortical responses for all digits for this patient (upper panel) in μV and cortical responses (absolute values) at the virtual channel in contralateral S1.
Somatosensory-evoked responses were elicited by tactile stimulation of four digits (i.e. thumb, index finger, middle finger and pinky). In consequent recording sessions, we stimulated both hands by gently tapping the skin at the tip of the four digits. We delivered tactile stimuli through thin elastic membranes attached to the distal, volar parts of the four digits (inlet panel in Fig. 1A). The membranes were inflated with compressed air pulses through rigid plastic tubes using the Somatosensory Stimulus Generator (4D NeuroImaging Inc., San Diego, CA, USA). The compressed air pulses were released with an inter-stimulus interval of 1.5 ± 0.5 s following a pseudo-random order. The pressure of the tactile stimulator rose to 0.10 bar overpressure in 10 ms. The recordings lasted ∼15 min per hand; the total duration of the actual recording was ∼1 h (including resting state, somatosensory-evoked responses and breaks between runs). We stimulated each finger with at least 200 stimuli. Stimulations were delivered in consecutive short duration (∼1.5 min) runs with 20 stimuli per finger (80 stimuli in total). If excessive movements were observed, the session was repeated. Electrocardiography data were simultaneously collected with a sampling rate of 1 KHz through two leads positioned on the sternum and the fifth intercostal space on the left side of the body.
MRI and co-registration with EEG
We acquired MRI with magnetization-prepared rapid acquisition gradient-echo sequences (MPRAGE; Echo Time = 1.74 ms, Repetition Time = 2, 520 ms, voxel size = 1 × 1 × 1 mm) using a 3 T scanner (Skyra, Siemens AG, Germany). We performed co-registration between the participants’ head shape (extracted from the MRI) and the HD-EEG sensor locations using ‘Brainstorm’ (Fig. 1B).37 We defined the relative location of HD-EEG electrodes with respect to the patients’ head anatomy with the FASTRACK tracking system (Polhemus, Colchester, VT, USA). Prior to the experiment, we asked the participants to sit on a special chair where the FASTTRACK transmitter was attached. We placed the FASTRACK receiver on the participants’ heads using a headband. With the FASTRACK stylus, we digitized three anatomical landmarks on the participants’ heads (i.e. nasion, left pre-auricular point and right pre-auricular point) as well as the HD-EEG electrode locations. MRI data for one patient with SSADHD and two healthy controls were unavailable. For these patients, we used an age-appropriate MRI template for further analysis.38
High-density EEG data analysis
We analysed the HD-EEG data using Brainstorm.37 We initially inspected the data to remove myogenic artefacts and then performed independent component analysis on HD-EEG and electrocardiography data to remove biological artefacts, e.g. pulse artefacts.39,40 We then removed the DC offset and filtered the data with a fourth-order band-pass infinitive impulse response Butterworth filter (1–100 Hz) and the 60 Hz notch filter.
For the resting-state data, we estimated the power spectrum density (Welch) of the HD-EEG signal across all EEG frequency bands (delta: 1–4 Hz; theta: 4–8 Hz; alpha: 8–12 Hz; beta: 12–30 Hz; and gamma: 30–100 Hz). For the somatosensory evoked and induced cortical oscillations, we segmented each dataset into trials from −100 to 500 ms relative to the stimulus onset. We tested whether the number of useful trials differed between stimulation sites or groups; we found no significant differences (P > 0.05).
Electric source imaging
We performed electric source imaging on the averaged data of each participant using the standardized Low-Resolution Electromagnetic Tomography, which estimates the 3D distribution of electric neuronal activity in the brain.41 For the standardized Low-Resolution Electromagnetic Tomography estimation, we used the default parameters in ‘Brainstorm’. We averaged the source imaging maps across runs for each participant and hand site. We built realistic head models using the boundary element model based on each participant’s MRI scan to estimate the forward model.42 The models were generated with the OpenMEEG software43 and consisted of four surface layers (i.e. brain, inner skull, outer skull and head surface). The standardized Low-Resolution Electromagnetic Tomography solutions44 were estimated at the cortical surface (∼15 000 sources) reconstructed in ‘Brainstorm’ using Statistical Parametric Mapping functions.
Time–frequency analysis at virtual channels
We identified the peak of the first cortical responses after the stimulus onset for all participants (upper panel in Fig. 1C). We then generated virtual channels at the locations where maximum cortical activity was observed (lower panel in Fig. 1C). The latency and amplitude at the first peak of cortical response after stimulus onset were calculated for each virtual channel. We performed a time–frequency analysis of the electric brain activity at the virtual channels using a complex Morlet wavelet. To estimate evoked responses, we applied the Morlet wavelets (five circles width per wavelet at centre frequencies between 1 and 100 Hz in 1 Hz steps) to the averaged source waveforms of each run of each digit for each participant. We then corrected the time–frequency representations with respect to the baseline activity from −100 to 0 ms to estimate relative power changes.45 To estimate induced responses, we applied the Morlet wavelets (using the same parameters as for the evoked responses) to the source waveforms from the individual trials of each digit for each participant. We then corrected the time–frequency representations with respect to the baseline activity for each trial and averaged them.
Cortical γ-aminobutyric acid derived by proton magnetic resonance spectroscopy
We used a MEGA PRESS sequence46,47 to measure GABA, acquired in a single voxel with size 27 cc (30 × 30 × 30 mm). We collected data from three brain regions: basal ganglia, posterior cingulate gyrus and occipital lobe. The basal ganglia were sampled as it is the area with the most consistent MRI abnormalities in SSADHD.46 The posterior cingulate gyrus and occipital lobe were sampled for control, since these areas were demonstrated to be applicable to GABA measurement.48-50 We processed the spectroscopy data using the LCModel software to estimate the concentrations of GABA and NAA. To remove potential bias due to neuronal loss, we measured the ratio of GABA/NAA.
Statistical analysis
The various diagnostic tests were performed and interpreted by blinded observers working in separate research groups. Analysis of HD-EEG data was performed by C.P. and G.N., analysis of 1H-MRS data was performed by O.A. and S.W. and analysis of plasma GABA and GGB was performed by X.S. and K.M.G. We performed statistical analysis of the resting-state and the somatosensory evoked and induced cortical oscillations data with SPSS 23.0 (SPSS Inc., Chicago, IL, USA). For the time–frequency analysis, we analysed the time–frequency representations between subjects (healthy controls versus patients with SSADHD). All statistical tests were employed using Monte Carlo permutation tests (5000 permutations). The arising multiple comparison problem was corrected with cluster-based statistical analysis.51 For each participant, we extracted the mean frequency of relative responses within the time windows and frequency bands where statistically significant differences were observed between the two groups. The beta and gamma frequencies and the SSADHD clinical severity score, which were distributed parametrically, were correlated using the Pearson correlation coefficient. Linear and non-linear curve fitting of the relationships between variables (i.e. relative power changes, plasma GABA and GGB concentrations, cortical GABA-derived by 1H-MRS and age) were performed. Best fits (highest r values) were selected. Linear regression analyses were then performed with Statgraphics Centurion 18 (Statgraphics Technologies, Inc., The Plains, VA, USA) using transformed values of X {e.g. [Power] = f[SQRT(GABA)] or [Power] = f[LOG(GBA)]} to obtain regression coefficients r and statistical significance, P values.
Results
Cohort
None of the study participants was diagnosed with neurological conditions that may confound the somatosensory evoked responses, such as a cerebrovascular accident or brain tumour. Notably, 8/18 patients were diagnosed with epilepsy, from whom 5 had a rare seizure frequency (≤1/year) and 1 had focal seizures per semiology but without a seizure focus per neuroimaging. Moreover, none of those presenting with seizures experienced sensory epileptic auras or seizures with sensory features that may affect the somatosensory-evoked responses. However, four subjects with epilepsy did take anti-seizure medications (Supplemental Table 1) that may modulate the resting-state EEG power spectrum52 and somatosensory-evoked potentials.53 None of the study’s participants sustained peripheral nerve disorders and myelopathy; these manifestations are not known to be part of the clinical phenotype of SSADHD.
Plasma γ-aminobutyric acid and γ-guanidinobutyric acid
We collected plasma specimens from 16 subjects with SSADHD (mean age ± SE: 11.18 ± 2.64) and 8 controls (mean age ± SE: 18.14 ± 2.91). The two groups had no significant age differences (P = 0.09). Plasma GABA was higher in patients with SSADHD than in healthy controls (mean ± SE: 3.29 ± 0.25 μM versus 1.44 ± 0.04 μM in SSADHD and healthy controls, respectively; P < 0.001). Plasma GGB was also higher in subjects with SSADHD (0.09 ± 0.01 μM) than in healthy controls (0.03 ± 0.00, P < 0.001).
Evoked and induced responses in contralateral primary somatosensory cortex (S1)
Somatosensory stimulation of the upper extremities resulted in a prominent cortical response at the virtual channel located within the S1 contralateral to stimulation for all healthy controls and patients with SSADHD (Fig. 1C). Statistical analysis of evoked responses between the different groups showed suppressed relative power in subjects with SSADHD compared with healthy controls in beta and gamma frequency bands (beta: 307.25% ± 50.81 versus 1008.18% ± 74.18; P < 0.001; gamma: 4.98% ± 21.7 versus 388.88% ± 96.67; P < 0.001; Fig. 2). The suppression of relative power was observed from 0 till ∼130 ms after the stimulus onset between ∼15 and ∼30 Hz for the beta band (Fig. 2). The suppression for the gamma band was observed later from ∼85 until ∼130 ms after stimulus onset between ∼55 and ∼65 Hz (Fig. 2). No differences of relative power between the two groups were observed for induced activity (P > 0.05). The mean frequency of relative power changes within the gamma band was lower in patients with SSADHD versus healthy controls (38.22 versus 42.59 Hz; P = 0.002). We also observed a moderate positive correlation between the mean frequency of relative power changes within the beta band with age (r = 0.527; P < 0.008). No frequency differences between the two groups were observed for induced activity (P > 0.05).
![Time–frequency analysis for evoked cortical responses in contralateral S1 for healthy controls (n = 10) and patients with SSADHD (n = 18). Grant average of relative power changes with respect to baseline (in %) at the virtual channel contralateral to the S1 for healthy children (upper panel) and patients with SSADHD (lower panel). Highlighted areas with an asterisk (*) indicate statistically significant differences between the two groups [Monte Carlo permutation tests (5000 permutations); corrected for multiple comparisons; P < 0.01]. RPC (%), relative power change.](https://oup.silverchair-cdn.com/oup/backfile/Content_public/Journal/braincomms/5/6/10.1093_braincomms_fcad291/9/m_fcad291f2.jpeg?Expires=1747983523&Signature=p6gA6Qk9aKPPh6ZpibvaqAHcoOziIvgeobHCjNu-Xx7lHgcUBMfkeQn-Rc~yNQBr2JJwbvuAJEQcZdGiVu37MEvTGy43MEZXqKZ8MLOx3Y19wiRWkb-bIsx0bwMkvmzHTPLvB2gTLTovLJnxRaPNkHW6oSYLIrLiRuqQE2xMFy8DuYRNNZuZQR64vGSAufJtBv4fl-Z4meRu5pQ6F3BU5yT8RFMlO5ci4-TBtRk-9vGCNoFTfFysW3nzqrE4APPzsNy68DFtPDLFQxdtE4nn8BqKS2Psd9iG3KfBhdhXaFMhR8OkHiamN5vRRP0zxJcP~azt~nqGwbH4Czxpk6DO8Q__&Key-Pair-Id=APKAIE5G5CRDK6RD3PGA)
Time–frequency analysis for evoked cortical responses in contralateral S1 for healthy controls (n = 10) and patients with SSADHD (n = 18). Grant average of relative power changes with respect to baseline (in %) at the virtual channel contralateral to the S1 for healthy children (upper panel) and patients with SSADHD (lower panel). Highlighted areas with an asterisk (*) indicate statistically significant differences between the two groups [Monte Carlo permutation tests (5000 permutations); corrected for multiple comparisons; P < 0.01]. RPC (%), relative power change.
Cortical γ-aminobutyric acid/N-acetyl-aspartate derived by proton magnetic resonance spectroscopy
Cortical GABA/NAA ratios were higher in subjects with SSADHD than in healthy controls for all the examined brain regions. In basal ganglia, GABA/NAA ratios were 0.132 ± 0.011 for healthy controls (mean ± SE; n = 9) and 0.223 ± 0.019 for children with SSADHD (n = 8, P < 0.001). In the posterior cingulate gyrus, these ratios averaged 0.088 ± 0.004 in healthy controls (n = 9) and 0.228 ± 0.009 in patients with SSADHD (n = 11, P < 0.001), whereas in the occipital cortex, they were 0.035 ± 0.010 and 0.156 ± 0.012 for healthy controls and SSADHD, respectively (n = 8 per group, P < 0.001).
Relationships between relative power, plasma γ-aminobutyric acid and γ-guanidinobutyric acid, and cortical γ-aminobutyric acid/N-acetyl-aspartate
When SSADHD and healthy control data were analysed together, we observed inverse relationships between the relative power of evoked cortical responses in the beta band and both the GABA (r = −0.75; P = 0.0001) and GGB (r = −0.69; P = 0.0002) plasma concentrations (Fig. 3). An inverse relationship was also noted between the relative power of evoked cortical responses in the gamma band and the concentrations of plasma GABA (r = −0.61; P = 0.002) and GGB (r = −0.55; P = 0.007; Fig. 4).
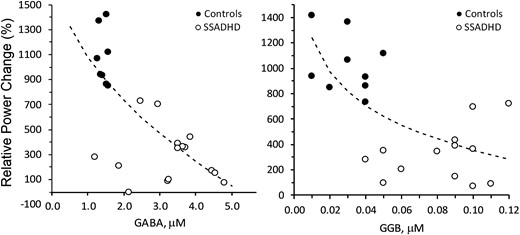
Correlation of relative power changes in beta-band with plasma GABA and GGB. Correlation of relative power changes in beta band with Plasma GABA (left; P < 0.0001, r = −0.75) and GGB (right; P < 0.0001, r = −0.69). Relative power change, change in the power of the EEG signal (%) during the active period (after pneumatic stimulation) compared with the baseline period (before stimulation). Dotted lines = best fit: SQRT(X) (left), LOG(X) (right). Regression analysis was performed to obtain regression coefficients and P-values.
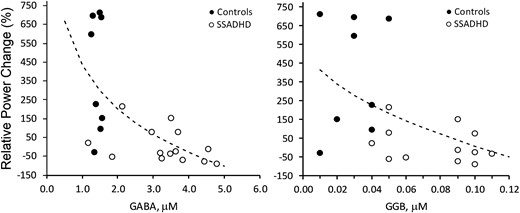
Correlation of relative power changes in gamma-band with plasma GABA and GGB. Correlation of relative power changes in gamma band with plasma GABA (left; P < 0.0026, r = −0.61) and GGB (right; P < 0.0074, r = −0.55). Relative power change, change in the power of the EEG signal (%) during the active period (after pneumatic stimulation) compared with the baseline period (before stimulation). Dotted lines = best fit: SQRT(X) (left), LOG(X) (right). Regression analysis was performed to obtain regression coefficients and P-values.
Similar relationships were observed between the relative power of evoked cortical responses in the beta band and GABA/NAA ratios measured in the basal ganglion (r = −0.70; P < 0.001) and between the relative power of evoked cortical responses in the gamma band and the GABA/NAA ratios measured in the basal ganglion (r = −0.79; P < 0.002) and the posterior cingulate gyrus (r = −0.85; P < 0.004; Fig. 5). Notably, the SSADHD clinical severity scores (Supplemental Table 1) were not significantly correlated to the beta (r = 0.227, P = 0.36) or gamma (r = 0.082, P = 0.74) bands.
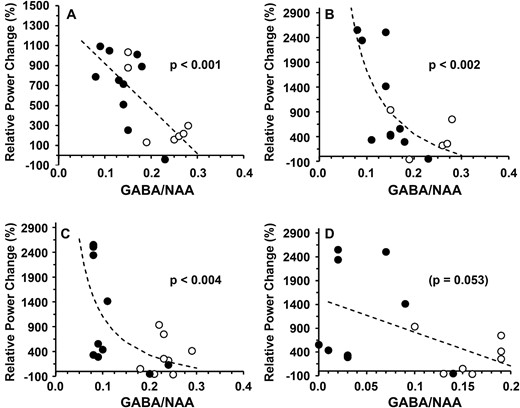
Relationship between relative power changes and brain GABA/NAA. Relationship between the relative power changes (%) and 1H-MRS–GABA/NAA ratios in patients with SSADHD (○) and controls (●) for beta band (A: basal ganglion) and gamma band (B: basal ganglion; C: posterior cingulate gyrus; D: occipital cortex). Dotted lines = best fit: linear (A, D), reciprocal (X) (B, C). Regression analysis was performed to obtain regression coefficients and P-values.
Cortical resting-state activity
Resting-state cortical activity within the contralateral S1 was suppressed for subjects with SSADHD compared with healthy controls for the theta (mean age ± SE: 63.76 μV2/Hz ± 7.44 versus 95.75 μV2/Hz ± 7.04; P = 0.01) and gamma frequency bands (mean age ± SE: 170.47 μV2/Hz ± 65.60 versus 780.91 μV2/Hz ± 176.49; P < 0.001). No differences between the two groups were observed for the other frequency bands (i.e. delta, alpha and beta; Table 1).
High-density EEG resting-state cortical activity
| Delta | Theta | Alpha | Beta | Gamma | |
|---|---|---|---|---|---|
| SSADHD | |||||
| n | 18 | 18 | 17 | 18 | 18 |
| Mean | 15.64 | 63.76 | 187.55 | 451.93 | 170.47 |
| SEM | 2.43 | 7.44 | 46.01 | 122.91 | 65.60 |
| Outliers | |||||
| Controls | |||||
| n | 9 | 9 | 10 | 10 | 10 |
| Mean | 18.49 | 95.75 | 250.91 | 502.96 | 780.91 |
| SEM | 1.97 | 7.04 | 68.83 | 64.62 | 176.49 |
| Outliers | 2 | 1 | |||
| t-test (P-value) | 0.4522 | 0.0113* | 0.4346 | 0.7702 | 0.0006* |
n, number of participants in the group; SEM, standard error of measurement. *Statistically significant P-values <0.05.
Correlation of resting-state cortical activity with plasma γ-aminobutyric acid and γ-guanidinobutyric acid
We observed a significant inverse correlation between resting-state cortical activity and plasma GABA and GGB values for the theta (GABA: r = −0.0651, P < 0.001; GGB: r = −0.5718; P = 0.003), alpha (GABA: r = −0.5818, P = 0.003; GGB: r = −0.4806; P = 0.02) and gamma (GABA: r = −0.4586, P = 0.02; GGB: r = −0.4842; P = 0.01) frequency bands.
We also observed a positive correlation of the resting-state cortical activity with the age of all participants for the theta (r = 0.5967, P = 0.002) and alpha bands (r = 0.5122, P = 0.01; Table 2).
Correlation of resting-state high-density EEG cortical activity with blood GABA, blood GGB, and age
| Delta | Theta | Alpha | Beta | Gamma | |
|---|---|---|---|---|---|
| GABA | |||||
| Type | Linear | Linear | Logarithmic X | ||
| P-value | N.S. | 0.0005 | 0.0036 | N.S. | 0.0242 |
| r | N.S. | −0.0651 | −0.5818 | N.S. | −0.4586 |
| Equation | Theta LR = 121.966–18.3234 × blood GABA | Alpha LR = 479.462–96.1928 × blood GABA | Gamma LR = 829.512–488.724 × ln(blood GABA) | ||
| GGB | |||||
| Type | Reciprocal X | Linear | Logarithmic X | ||
| P-value | N.S. | 0.0035 | 0.0203 | N.S. | 0.0142 |
| r | N.S. | −0.5718 | −0.4806 | N.S. | −0.4842 |
| Equation | Theta LR = 54.1237 + 0.757898/blood GBA | Alpha LR = 391.33–2589.4 × blood GBA | Gamma LR = −568.433−339.844 × ln(blood GBA) | ||
| Age | |||||
| Type | Reciprocal X | Logarithmic X | |||
| P-value | N.S. | 0.0021 | 0.0125 | N.S. | N.S. |
| r | N.S. | 0.5967 | 0.5122 | N.S. | N.S. |
| Equation | Theta LR = 93.4471–142.869/age | Alpha LR = −52.9342 + 120.79 × ln(age) |
Discussion
Using the combination of HD-EEG–derived somatosensory-evoked cortical responses, electrical source imaging and cortical and plasma GABA measurements, this study’s findings determined that compared with controls, subjects with SSADHD are characterized by: (i) suppression of the relative power in somatosensory-evoked beta and gamma bands; (ii) a lower frequency of gamma activity; (iii) an inverse correlation of plasma GABA and GGB levels, as well as in vivo cortical GABA in all regions studied (i.e. basal ganglia, posterior cingulate gyrus and occipital cortex), with evoked beta and gamma activity in the posterior cingulate cortex; and (iv) decreased resting-state activity in the theta and gamma bands and an inverse correlation among cortical theta, alpha and gamma resting-state activity and plasma GABA and GGB levels.
To our knowledge, this study represents the first report of abnormal evoked electrophysiology in individuals with abnormally increased endogenous GABA levels. It partly elucidates the negative influence increased GABA may have on active neural networks’ rhythmic synchronization and accordingly sensory processing. Our findings provide a neurophysiologic demonstration of the downregulation of GABA receptor activity, as supported by flumazenil ligand radioisotope PET scanning, and support a basic physiological role for GABA as underlying cortical gamma activity. These findings further indicate the potential development of novel non-invasive biomarkers of GABAergic dysfunction. Such biomarkers may augment the early diagnosis of neurometabolic disorders as well as the development and monitoring of future disease-modifying interventions.
GABA, the main inhibitory neurotransmitter in the central nervous system, has been suggested to play a role in the pathophysiological processes of several neurodevelopmental disorders.54-62 In addition, an age-related reduction in otherwise elevated concentrations of GABA has been associated with motor cortex dysfunction as well as epileptogenesis and autism spectrum disorders in SSADHD.63-65 Plasma GABA concentrations likely reflect its synthesis, accumulation and release from tissues, as well as hepatic and peripheral tissue clearance. Changes in the gut microbiota of patients may also contribute to the pathophysiological levels of elevated GABA in patients with SSADHD.66,67 Yet, plasma GABA may not be directly related to tissue concentrations in the central nervous system. Thus, other indirect measures of cortical GABA are required. Recent progress in the non-invasive evaluation of GABA levels in the human brain has been achieved by means of 1H-MRS. Here, we observed a cortical GABA increase in subjects with SSADHD for all brain regions quantified compared with healthy controls. This was coupled with somatosensory stimulation of the upper extremities that induced a prominent cortical response in the beta and gamma frequency bands. A relative power change, namely event-related synchronization,47 within these bands, was expected since it aligns with previous findings by our group and others using the same or similar experimental paradigms.68-72 Both beta and gamma frequencies play a critical role in somatosensory processing; beta activities likely relate to the independent representation of sensory input, while gamma oscillations likely relate to the binding of sensory information for higher order processing.71 Here, we observed a suppression of relative power change in both beta and gamma frequency bands for subjects with SSADHD compared with healthy controls. A similar suppression of gamma-evoked activity (but in response to auditory stimuli) has been reported recently in a cohort of children with Dravet syndrome,73 a neurodevelopmental disease involving dysfunction of GABAergic mechanisms. Other studies have shown altered gamma oscillations in disorders with impaired balance between excitatory and inhibitory neurotransmission, including autism spectrum disorders,74 depression,75 cognitive disorders76 and several other neuropsychiatric disorders.77
Suppressed evoked activity may be explained by: (i) a decrease in the amplitude of oscillatory activities elicited by each individual stimulus; (ii) a decrease in the number of neurons corresponding to the stimulus, and/or (iii) a deficiency in the synchronization mechanisms needed to elicit a coherent response.78 The increase of GABA characteristic of SSADHD presumably alters the ability of interneurons to elicit an appropriate response stimulus, causing desynchronization of the evoked responses.
A MEG study in healthy adults showed that the peak frequency of network gamma oscillations induced by visual stimulation was positively correlated with the concentration of GABA measured through 1H-MRS.29 In a later study, the same research group found no alteration of gamma frequency in response to direct manipulation of GABA through administration of tiagabine, which increases endogenous GABA levels, for either induced or evoked responses.79 Here, we found that the frequency of gamma-evoked responses was lower in patients with SSADHD versus healthy controls. Potential reasons for these apparently contradictory findings are the different experimental paradigms used in these studies (previous studies used visual stimulation versus somatosensory stimuli here) and, more importantly, the chronic nature of endogenous impairment of GABA catabolism in SSADHD. Our findings align with a realistic cortical network modelling study in which interneurons and excitatory pyramidal cells are interconnected in re-entrant loops.80 In this model, the dominant population response occurs in the gamma frequency band and depends strongly on the ratio between excitatory and inhibitory connections and their time constants. This model predicts that as inhibition increases, the dominant frequency will increase. Consistent with the compensatory downregulation of GABAergic activity in this developmental disorder, however, the actual mean frequency of gamma activity is demonstrated to be decreased.
Suppressed resting-state activity in the theta and gamma bands was observed in subjects with SSADHD compared with healthy controls. A negative correlation between the resting-state cortical activity and the plasma GABA and GGB was also seen for the theta, alpha and gamma frequency bands. Ongoing gamma band oscillations of the local field potential synchronize neuronal response onset latencies to sensory input.81 This synchronization of gamma band oscillations seems to play a critical role in conscious perception and sensory motor integration.82 Such dysfunction in the synchronization of oscillatory brain activity may explain the vast variety of heterogeneous cognitive impairments seen in SSADHD. Our finding that higher GABA levels (as in patients with SSADHD) are associated with greater suppression of theta frequency band appears to be consistent with the observation that GABA input reduces theta oscillations, and GABA blockade augments theta oscillations in animals.83,84 A pilot study in patients with schizophrenia, which investigated the relationship between frequency gating and GABA levels measured with 1H-MRS, showed similar findings of higher GABA levels with greater suppression of theta and theta-alpha gating.85 In line with our findings are also repetitive transcranial magnetic stimulation studies showing that non-invasive cortical stimulation in theta frequency leads to pronounced decrease in the excitability of cortical circuits.86
The most plausible mechanism for generating temporally organized electrocortical activity measured with scalp EEG is in reciprocally connected neuronal networks containing mixtures of inter-connected glutamatergic (excitatory) pyramidal and stellate cells, and GABAergic (inhibitory) interneurons.87,88 We may thus presume that alterations in cortical GABA will also alter the frequency and amplitude of neurophysiological (induced and evoked) responses to external sensory stimuli. This notion is supported by previous MEG studies involving visual and motor experimental paradigms in healthy adults. Muthukumaraswamy et al.29 have shown that the frequency of visual stimulus-induced network gamma oscillations in the primary visual cortex was positively correlated with the cortical GABA concentration measured with 1H-MRS. Using the same visual experiment, the same research group later reported no changes in the stimulus-induced amplitude during pharmacological manipulation of endogenous GABA in healthy adults, but a 45% suppression of evoked responses at ∼80 ms after the stimulus onset.79 A multi-modal MEG and flumazenil positron emission tomography study showed that GABAA receptor densities are correlated positively with the frequency and negatively with the amplitude of visually induced gamma oscillations in the primary visual cortex of healthy adults.31 Finally, another group of researchers showed a linear relation between motor-induced electrocortical activity in the beta and gamma frequency bands and the cortical GABA assessed through 1H-MRS.30
Here, we examined the relationship among electrocortical activity, cortical GABA levels assessed through 1H-MRS and plasma GABA in healthy controls and a cohort of patients with SSADHD. We observed a negative correlation of evoked activity in the beta and gamma frequency bands with plasma GABA and GGB. This observation is in line with previous MEG findings showing suppression of electrocortical activity at the early components of visually evoked fields after administration of the drug tiagabine in a set of healthy control participants.79 Tiagabine is an anticonvulsant that elevates the extracellular/synaptic concentration of GABA and therefore enhances the actions of endogenous GABA.89,90 Altogether, these findings demonstrate that early-evoked responses to external sensory inputs show greater sensitivity to increases in endogenous GABA compared with induced oscillations.
Despite its innovation, our study presents some limitations. The cortical level of GABA was assessed through 1H-MRS at large voxels centred at three different brain areas (i.e. basal ganglia, posterior cingulate gyrus and occipital cortex). These levels of GABA were correlated with induced and evoked changes of cortical activity elicited by somatosensory stimulation. Yet, none of the voxels, where cortical GABA level was assessed, were along the somatosensory pathway. Future studies should examine cortical responses from different neural systems (e.g. auditory, visual and somatosensory) and correlate them with the cortical GABA levels at locations that correspond to the anatomical pathways of these systems. To elicit cortical responses, we used a task that involves the presentation of a visual stimulus (i.e. cartoon). Since the same stimulus was used across all participants, the observed differences in cortical activity between the two groups were not affected by our paradigm. Yet, future studies should consider other resting-state conditions (i.e. eyes-open and eyes-closed without visual input), since different resting-state conditions produce different levels of cortical activity particularly in the alpha frequency band.91 Since our study focused on the somatosensory system, we restricted our resting-state EEG analysis to a virtual channel estimated in the contralateral S1. Future studies should examine resting-state EEG changes at the global level for both patients with SSADHD as well as other disorders of GABA.
Conclusions
We combined in vivo and in vitro measurements of GABA and GGB with event-related power changes utilizing HD-EEG recordings in response to tactile stimulation in a population of individuals with SSADHD, a neurodevelopmental disorder of impaired GABA metabolism. Our findings demonstrate that subjects with SSADHD, compared with healthy controls, showed decreased beta and gamma frequency band activity and decreased event-related synchronization. These findings possibly represent elevated brain GABA’s negative effects on rhythmic synchronization and cortical processing. By elucidating the GABAergic influences on normal neurophysiology, these findings may further provide the grounds on which non-invasive biomarkers could be developed for individuals with SSADHD and other developmental encephalopathies.
Supplementary material
Supplementary material is available at Brain Communications online.
Acknowledgement
We thank the individuals with SSADHD and their families for their cooperation.
Funding
Funding provided by the Eunice Kennedy Shriver National Institute of Child Health and Human Development, grant number: 5R01HD091142 supported the work presented in this manuscript. The Boston Children’s Hospital (BCH) Intellectual and Developmental Disabilities Research Center (BCH IDDRC, U54HD090255) also supported this study.
Competing interests
The authors report no competing interests.
Data availability
Anonymized data are available from the corresponding author upon request.
Appendix I
The SSADH Deficiency Investigators Consortium (SDIC): Phillip L. Pearl, Jean-Baptiste Roullet, K. Michael Gibson, Christos Papadelis, Thomas Opladen, Alexander Rotenberg, Kiran Maski, Melissa Tsuboyama, Simon Warfield, Onur Afacan, Edward Yang, Carolyn Hoffman, Kathrin Jeltsch, Jeffrey Krischer, M. Ángeles Garcıa Cazorla, and Erland Arning.
