


Abstract
Adults with congenital heart disease are at risk for persisting executive function deficits, which are known to affect academic achievement and quality of life. Alterations in white -matter microstructure are associated with cognitive impairments in adolescents with congenital heart disease. This study aimed to identify microstructural alterations potentially associated with executive function deficits in adults with congenital heart disease. Diffusion tensor imaging and tract-based spatial statistics were conducted in 45 patients (18 females) and 54 healthy controls (26 females) aged 18–32 years. Fractional anisotropy of white matter diffusion was compared between groups and correlated with an executive function score, derived from an extensive neuropsychological test battery. Patients showed widespread bilateral reduction in fractional anisotropy (P < 0.05, multiple comparison corrected) compared to controls. Lower fractional anisotropy was driven by patients with moderate and severe defect complexity (compared to controls: P < 0.001). Executive function scores were lower in patients (P < 0.05) and associated with lower fractional anisotropy in the left superior corona radiata and the corticospinal tract (corrected P < 0.05). Our findings confirm alterations of white matter microstructure in adults with congenital heart disease, mainly in those patients of moderate to severe complexity. These alterations are associated with impairments in executive functioning. A better understanding of the neurocognitive deficits may help counselling and care of patients with congenital heart disease across their lifespan and have the potential to improve their outcome and quality of life.
Introduction
Congenital heart disease (CHD) is the most common neonatal malformation with an incidence of 8 per 1000 live births (Bernier et al., 2010). As a result of advances in medical care over the last decades, the vast majority of patients with CHD reach adulthood resulting in a rapidly growing population of adult survivors with CHD (Marelli et al., 2016). In children and adolescents with CHD, several studies have demonstrated a wide range of neurodevelopmental impairments, such as impaired executive function (Calderon et al., 2010; Schaefer et al., 2013; Cassidy et al., 2015), memory performance (Pike et al., 2016; Cassidy et al., 2017) and intellectual abilities (Schaefer et al., 2013; Bellinger et al., 2015; Naef et al., 2017). In adults with congenital heart disease (ACHD), however, the understanding of cognitive functioning and its neuronal correlates is limited. Only few studies have demonstrated a persistence of cognitive impairments in emerging adults with CHD (Pike et al., 2016; Murphy et al., 2017; Semmel et al., 2018) and in samples of ACHD patients with a wider age range (Ilardi et al., 2017; Klouda et al., 2017).
Cognitive impairments in adolescents and emerging adults with CHD have been related to cerebral changes such as reduced brain volume (Von Rhein et al., 2014; Latal et al., 2016; Semmel et al., 2018), white matter diffusivity and anisotropy (Rollins et al., 2014; Brewster et al., 2015; Watson et al., 2018; Ehrler et al., 2020) and connectivity alterations (Panigrahy et al., 2015). However, it remains unclear to what extent these brain alterations persist into adulthood and whether these alterations continue to have an impact on cognitive functioning.
In healthy participants, changes in white matter microstructure occur across the life span. The anisotropy of white matter tracts increases during childhood and adolescence (Lebel et al., 2008; Peters et al., 2012; Herting et al., 2017) and decreases in later adulthood (Bendlin et al., 2010; Lebel et al., 2012). These changes in white matter microstructure have been directly associated with cognitive functioning in the general population across all ages (Bendlin et al., 2010; Peters et al., 2012; Cremers et al., 2016; Sousa et al., 2018). Therefore, given the naturally occurring decrease of white matter anisotropy during adulthood, populations at risk, such as CHD patients, may show different, more accelerated age-related changes in white matter tracts. It is well known that brain reserve capacity has a protective effect on later dementia (Meng and Arcy, 2012). This reserve capacity may be decreased in CHD due to their risk for brain alterations. Indeed, a population-based cohort study by Bagge and colleagues (2018) found an elevated risk for both early and late onset dementia in patients with CHD compared to the general population. The understanding of the composition of brain alterations and its association with cognitive functioning in CHD using magnetic resonance imaging (MRI) is thus of great importance to guide medical counselling and care in this population. It has been shown that global brain volumes and the posterior cerebellar volume were reduced in patients with ACHD and these changes were associated with executive function deficits (Semmel et al., 2018), whereas structural changes, albeit observed frequently in patients with ACHD, were not related to overall IQ (Kessler et al., 2020). Studies on microstructural alterations in patients with ACHD are limited and show lower fractional anisotropy (FA) in various bilateral clusters (Easson et al., 2020) and an association with attention and learning (Brewster et al., 2015). Both of these studies were, however, conducted in emerging adults (16–24 years). This is the first study, assessing cerebral microstructure alterations in a sample of young patients with ACHD with a wider age range (18–32 years) in relation to neuropsychological functioning. We thus aim to (i) investigate on a microstructural level, whether white matter anisotropy is reduced in patients with ACHD, (ii) identify potential risk factors for structural alterations in white matter and (iii) associate white matter microstructure with executive functioning. We thus hypothesize that FA is lower across the whole brain in patients with ACHD compared to controls, especially pronounced in patients with more severe CHD and related risk factors. Lower FA in distinct areas (i.e. fronto-parietal and cortical–sub-cortical tracts) are further hypothesized to be associated with executive dysfunction in patients with CHD.
Materials and methods
Sample
The studied patients originate from two previously studied cohorts (Supplementary Fig. 1). A total of 191 patients with different types of CHD, who have been treated at the outpatient clinic of the University Hospital Zurich, Switzerland, were contacted. In total, 67 patients participated in the study of which 45 patients underwent a diffusion tensor imaging (DTI) scan and were therefore included in this analysis. Of the 55 age- and sex-matched controls, who were enrolled in this study, 54 participants underwent a DTI scan and were included in this analysis. Participants were recruited between October 2016 and October 2018. Inclusion criteria for all participants were as follows: age between 18 and 32 years and fluency in German language, no other congenital malformation, no genetic disorder and no neurological disorder. Therefore, medical records were screened and individuals with any clinically relevant neurological history (e.g. multiple sclerosis, clinical stroke requiring hospitalization) were excluded.
The study was approved by the ethics committee of the Canton of Zurich and all the participants gave written informed consent prior to participation, in accordance with the Declaration of Helsinki.
Outcome assessment
Cognitive outcome was assessed with an extensive, standardized neuropsychological test battery focussing on IQ, executive function, memory and processing speed. Our analyses focussed on executive functioning, as executive function impairments are well described in the CHD population and are of particular relevance due to their association with academic achievement (Best et al., 2011) and quality of life (Davis et al., 2010; Sanz et al., 2018).
Five domains of executive function were assessed in this study: Inhibition, cognitive flexibility, working memory, verbal and nonverbal fluency and problem solving (Table 1), which have been described as executive function domains previously (Anderson, 2002; Diamond, 2013; Baggetta and Alexander, 2016). Inhibition was assessed with the sub-test Inhibition of the Colour Word Interference Task (CWIT) from the Delis–Kaplan Executive Function System and the total score of the stop-signal task (Verbruggen et al., 2008). During the Inhibition sub-test, participants are asked to name the colour of colour words printed in incongruent colours. The stop-signal task requires participants to quickly respond to a frequent visual stimulus, but to inhibit the reaction when the stimulus is followed by a stop signal. Flexibility was assessed with the sub-test Switching of the CWIT and the sub-tests letter–number switching of the trail-making tests (Tombaugh, 2004). During the Switching sub-test, participants are asked to switch between colour naming and reading colour words printed in incongruent colours. The letter–number switching sub-test requires participants to draw sequental lines alternatly connecting letters and numbers (e.g. 1A2B3C, etc.). Working memory was assessed with verbal digit [WAIS, (Petermann, 2012)] and visual block [WMS-R, (Härting et al., 2000)] span. Participants were asked to memorize an increasing sequence of items and recall those either forward or backward. A verbal and visual score including the number of correct forward and backward recalls was calculated. Verbal fluency was tested with the Regensburger Verbal Fluency Test (Aschenbrenner et al., 2000) by using the number of correctly named S-words within 2 min. Non-verbal fluency was assessed with the number of correct figures (i.e. different figures connecting two or more dots with straight lines) produced in the 5-Point Test (Regard et al., 1982). Problem solving was investigated with the total score of the Standardized Link’s Probe (Metzler, n.d.), which requires that participants build a large cube out of 27 small cubes according to a plan. For all tests, age-referenced t-scores were calculated using the respective manuals and a global executive function (gEF) score was created based on the mean of all executive function sub-test scores. A global score derived from an extensive test battery was used under the assumption that executive function is a multi-dimensional construct including different cognitive processes that can be distinguished but which are correlated [see systematic review by (Baggetta and Alexander, 2016)]. Using a mean composite score further decreases multiple testing and associated Type 1 errors and has been successfully applied in other neuroimaging studies in at risk populations (Nosarti et al., 2008; Wehrle et al., 2017; Schnider et al., 2020).
Composition of neuropsychological assessment for the gEF score
| Assessed domains | Test | Measurement |
|---|---|---|
| Inhibition | CWIT inhibition | Time |
| Stop-signal task | Total score | |
| Cognitive flexibility | CWIT switching | Time |
| Trail-making tests letter–number switching | Time | |
| Working memory | Verbal digit span (forward, backward) | Number of correct items |
| Visual digit span (forward, backward) | Number of correct items | |
| Fluency | Regensburger Verbal Fluency Test, S-Words | Number of correct items |
| 5-Point Test | Number of correct items | |
| Problem solving | Standardized Link’s Probe | Total score |
Note: Global score consist of the averaged age-referenced t-values.
Post-hoc, a processing speed composite score of age-referenced t-scores was used as covariate for the association between FA and gEF. This score included reaction time of the sub-test divided attention of the Test of Attentional Performance [auditory and visual (Zimmermann and Fimm, 2007)], and completion time of the sub-tests colour naming (CWIT) and numbers (trail-making tests). A trained psychologist (L.S.), who was aware of the participants’ health condition, administered and evaluated the tests. Blinding was not possible due to safety and organization conditions. However, using standardized test battery minimized the effects of a lack of blinding.
IQ was estimated according to Daseking and colleagues (2014) with the two sub-tests Vocabulary and Matrices of the Wechsler Adult Intelligence Scale 4th Edition (Petermann, 2012). Parental socio-economic status (SES) was estimated by rating both maternal and paternal education on a 6-point scale, ranging from 2 to 12 (Largo et al., 1989).
DTI acquisition and processing
Brain MRI was performed on a 3.0 Tesla whole-body system (GE 3 T MR750 MRI scanner, GE Healthcare, Milwaukee, WI). A diffusion tensor imaging sequence was acquired, oriented parallel to the anterior commissure—posterior commissure plane, with the following parameters: repetition time/echo time (TR/TE) = 7500/89 ms; acquisition matrix = 96 × 96; field of view = 280 mm, slice thickness = 3.6 mm. A total of 35 diffusion-weighted gradient directions were acquired with b = 1000 s/mm2 and four non-diffusion weighted images.
DTI data were processed using FSL Software (Smith et al., 2004). First, data were corrected for eddy current artefacts (Andersson and Sotiropoulos, 2016) followed by brain extraction using Brain Extraction Tool (Smith, 2002). The diffusion tensors were then fitted at each intra-cerebral voxel to calculate maps of the FA for each participant.
FA images were aligned into (1 mm3 × 1 mm3 × 1 mm3) MNI152 standard space using tract-based spatial statistics (Smith et al., 2006), and the group mean FA map was created. Subsequently, the white matter FA skeleton was generated using an FA threshold of 0.2. FA values range from 0 to 1, in which greater values correspond to higher microstructural white matter diffusivity.
Statistical analysis
Sample characteristics were compared between patients and controls. Two-tailed t-tests were conducted to examine the differences in age, SES, gEF and IQ. Sex was compared between groups using a chi-squared test. For descriptive interpretation, probabilities of the following cardiac risk factors were reported: defect complexity of CHD [simple, moderate or severe; according to Warnes et al. (2001)], cyanotic CHD (yes, no), previous repair with cardiopulmonary bypass surgery (yes, no), previous cardiac complications and interventions in adulthood (yes, no) and physical exercise capacity (normal versus reduced peak oxygen uptake derived from cardio-pulmonary exercise testing). Reduced peak-VO2 was defined as maximum oxygen uptake <85% of predicted, normalized for age, sex and height.
Whole-brain voxel-wise comparison of FA was conducted between patients and controls, adjusting for age and sex. The FSL Randomize tool was used for non-parametric interference testing in order to account for the non-normal Gaussian distribution of FA values. Significant tracts were identified with the JHU ICBM-DTI-81 White Matter and the JHU White Matter Tractography atlases.
For the risk factor analysis, all significant clusters (P < 0.05, multiple comparison corrected) were masked and the mean FA of these clusters was extracted for each participant. Mean FA was associated with cardiac risk factors in a separate linear regression model. The following cardiac risk factors were considered: SES, severity of CHD, cyanotic CHD, number of cardiopulmonary bypass surgeries and physical capacity. Inter-correlations of risk factors were investigated with a heterogeneous correlation matrix including polyserial and polychoric correlations for both continuous and ordinal scaled data.
In order to investigate whether specific white matter tracts were associated with gEF, a whole-brain voxel-wise analysis was conducted adjusting for group, age and sex. Mean FA of the clusters associated with gEF was extracted for each participant in order to test whether there is an interaction between group and executive function. One patient with CHD and one control participant did not complete the full executive function test-battery and were therefore excluded from all analyses on executive functioning.
Whole-brain voxel-wise analyses were conducted with FSL, whereas analyses between mean FA and sample characteristics were conducted with the computing environment R version 3.5.3 (R Core Team, 2018). Level for significance was α = 0.05 and was corrected for multiple comparison using TFCE correction for voxel-wise analyses. Unstandardized regression coefficients (β) and t-values are reported for linear models. Effect sizes were reported by Hedges’s g, adjusting for unequal sample size, for group comparison and regression coefficients for associations between gEF and FA. The STROBE guidelines for reporting observational studies were followed.
Data availability
De-identified data are available from the corresponding author upon reasonable request.
Results
Participant characteristics
Participant characteristics are summarized in Table 2. Both IQ [mean difference = 6.26, t(96) = −2.65, P = 0.009, CI-95 = −10.96 to −1.57] and gEF [mean difference = 1.90, t(95) = −2.01, P = 0.048, CI-95 = −3.77 to −0.02] were significantly lower in ACHD compared to controls. gEF was further significantly associated with defect complexity of CHD [β = −0.89, t(95) = −2.026, P = 0.046, CI-95 = −1.77 to −0.02]. Mean and standard deviation of the gEF sub-tests stratified by group are listed in Supplementary Table 1 and a correlation matrix is shown in Supplementary Fig. 3. Patients completed significantly less years of education compared to controls [mean difference = 0.92, t(97) = −2.29, P = 0.024, CI-95 = −1.72 to −0.12]. Patients and controls did not differ in sex, age and SES. Cardiac characteristics of patients are summarized in Supplementary Table 2. Small MR abnormalities were detected in 67% of the patients (i.e. focal infarction or atrophy, white matter lesions, micro-haemorrhages and global atrophy) but in none of the controls (Kessler et al., 2020). Participating patients did not differ from patients lost to follow up except for having better systemic ventricular ejection function (Kessler et al., 2020).
Participant characteristics stratified by group
| Variables | ACHD (n = 45) | Controls (n = 54) | P value | Hedge’s g |
|---|---|---|---|---|
| Female sexa | 18 (40%) | 26 (48%) | >0.5 | |
| Age at assessmentb | 26.47 (3.62) | 25.97 (3.31) | >0.4 | 0.14 |
| Parental SESb | 8.46 (1.95) | 8.88 (1.70) | >0.2 | 0.23 |
| Years of educationb | 14.10 (2.10) | 15.02 (1.89) | <0.05 | 0.46 |
| IQ at assessmentb | 97.98 (11.09) | 104.24(12.06) | <0.01 | 0.51 |
| gEF scoreb | 50.42 (5.48) | 52.42 (4.09) | <0.05 | 0.42 |
Abbreviations: SES, socioeconomic status; gEF, global executive function.
Number of individuals (%).
Mean (standard deviation). P, uncorrected P-value. Hedge’s g: small effect > 0.1, medium effect > 0.5, large effect > 0.8.
Lower white matter anisotropy in patients with ACHD and potential risk factors
Significantly lower FA in patients with ACHD compared to controls was observed in the majority of white matter tracts (Table 3 and Fig. 1).

Lower FA in ACHD compared to controls. Note. Red to yellow colour indicates voxels for which FA is significantly (TFCE corrected P < 0.05) lower in ACHD compared to controls. Brighter colour indicates higher significance. L = Left, R = Right, P = Posterior, A = Anterior. The map of the different tracts is shown in Supplementary Fig. 2.
White matter tracts with significantly lower FA in ACHD compared to healthy controls
| White matter tracts | X | Y | Z | P* |
|---|---|---|---|---|
| Cerebellar peduncle—superior (L)a | −6 | −38 | −26 | 0.04 |
| Cerebellar peduncle—superior (R)a | 7 | −39 | −27 | 0.04 |
| Cerebral peduncle (L)a | −17 | −20 | −9 | 0.04 |
| Cingulum (L)b | −9 | 21 | 20 | 0.04 |
| Cingulum (R)b | 10 | −25 | 32 | 0.04 |
| Corona radiata—anterior (L)a | −25 | 33 | −2 | 0.04 |
| Corona radiata—anterior (R)a | 13 | 32 | −11 | 0.04 |
| Corona radiata—posterior (L)a | −28 | −35 | 21 | 0.04 |
| Corona radiata—posterior (R)a | 25 | −39 | 34 | 0.04 |
| Corona radiata—superior (L)a | −27 | −6 | 21 | 0.04 |
| Corona radiata—superior (R)a | 20 | −21 | 38 | 0.03 |
| Corpus callosum—bodya | −3 | 13 | 20 | 0.04 |
| Corpus callosum—genua | −9 | 20 | 20 | 0.04 |
| Corpus callosum—spleniuma | 24 | −51 | 10 | 0.04 |
| Corticospinal tract (L)b | −27 | −31 | 25 | 0.04 |
| Corticospinal tract (R)b | 21 | −21 | 39 | 0.03 |
| External capsule (L)a | −29 | −6 | 16 | 0.04 |
| Forceps majorb | 24 | −51 | 10 | 0.04 |
| Forceps minorb | 10 | 26 | 13 | 0.04 |
| Fronto-occipital fasciculus—inferior (L)b | −23 | 15 | −11 | 0.04 |
| Fronto-occipital fasciculus—inferior (R)b | 29 | −64 | 15 | 0.04 |
| Inferior longitudinal fasciculus (L)b | −43 | −17 | −15 | 0.04 |
| Internal capsule—anterior (L)a | −14 | 13 | −2 | 0.04 |
| Internal capsule—posterior (L)a | −19 | −20 | −4 | 0.04 |
| Internal Capsule—retrolenticular (L)a | −25 | −19 | −3 | 0.05 |
| Internal Capsule—retrolenticular (R)a | 32 | −34 | 13 | 0.04 |
| Medial lemniscus (L)a | −6 | −38 | −28 | 0.04 |
| medial lemniscus (R)a | 6 | −37 | −30 | 0.04 |
| Superior longitudinal fasciculus—temporal (R)b | 35 | −48 | 13 | 0.04 |
| Superior longitudinal fasciculus (L)b | −29 | −6 | 16 | 0.04 |
| Superior longitudinal fasciculus (R)b | 35 | −48 | 13 | 0.04 |
| Thalamic radiation—posterior (R)a | 27 | −64 | 12 | 0.04 |
| Thalamic radiation—anterior (L)b | −25 | 33 | 1 | 0.04 |
| Thalamic radiation—anterior (R)b | 21 | 45 | 4 | 0.04 |
Note. For each structure, *TFCE-corrected P-values and cluster centre coordinates (X, Y, Z) of the most significant cluster (>30 voxels) are reported. Results are corrected for age and sex. Tracts were identified with:
JHU White Matter Tractography Atlas
JHU ICBM-DTI-81 White Matter Atlas.
Abbreviations: L, left hemisphere; R, right hemisphere.
For the risk factor analysis, an inter-correlation matrix revealed a strong correlation between CHD complexity and cyanotic CHD (Polychoric r = 0.93) and therefore cyanosis was excluded from the multiple linear regression model due to collinearity. The remaining risk factors were correlated with r < 0.4. Furthermore, physical capacity was excluded due to a high rate of missing data (30%), which would lead to decreased power. Accordingly, a multiple linear regression model was calculated with mean FA of all significant clusters as dependent variable and SES, CHD complexity and number of cardiopulmonary bypass surgeries as independent variables. Only CHD complexity was significantly associated with mean FA [β = −0.01, t(37) = −2.54, P = 0.02, CI-95 = −0.021 to −0.002], indicating that FA was lower in patients with more complex CHD. There was no evidence for an association between mean FA and number of cardiopulmonary bypass surgeries [β = −0.01, t(37) = −1.35, P = 0.19, CI-95 = −0.014 to 0.003] or SES [β = −0.00, t(37) = 1.22, P = 0.23, CI-95 = −0.001 to 0.006]. This model explained 18% of the variance in mean FA (adjusted R2 = 0.18).
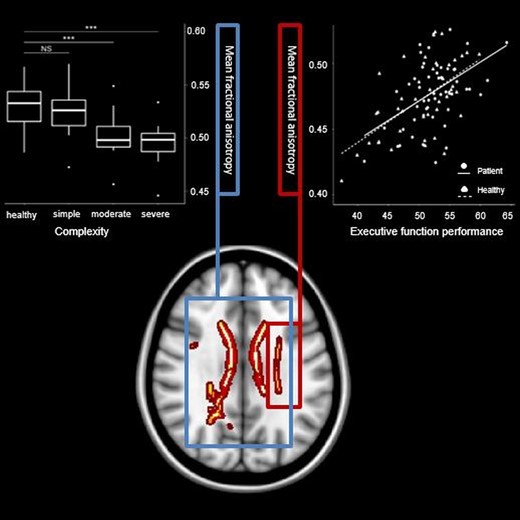
Post-hoc, the mean FA of the three groups of CHD complexity was compared to healthy controls using separate Welch’s t test, allowing for unequal variance (due to unequal sub-sample sizes). Mean FA differed strongly between controls and both patients with moderate [mean difference = −0.03, t(21.68) = 5.12, P < 0.001, CI-95 = 0.02–0.04, Hedge’s g = 1.39] and severe CHD complexity [mean difference = −0.03, t(11.48) = 4.38, P < 0.001, CI-95 = 0.02–0.05, Hedge’s g = 1.68]. Patients with simple CHD did not differ in mean FA from controls [mean difference = −0.01, t(31.06) = 1.78, P = 0.08, CI-95 = −0.00 to 0.02]. Figure 2 shows visualization. Mean FA of moderate CHD was significantly lower compared to simple CHD [mean difference = −0.02, t(30.47) = 3.06, P = 0.005, CI-95 = −0.01 to −0.04], but not compared to severe CHD [mean difference = −0.01, t(15.874) = 0.79, P = 0.439, CI-95 = −0.01 to 0.02].
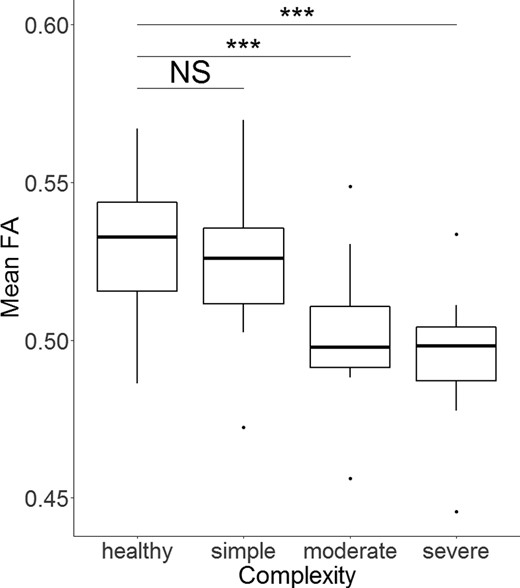
Mean FA differs between groups of CHD severity. Note. The lower/upper border of the box represent the first/third quartile. The thick line within the box corresponds to the median. Dots represent outliers. ***P < 0.001. NS = not significant. Test statistics of subgroup comparisons against healthy controls (N = 54, 48% female) using Welch’s t-test allowing for unequal variance: simple CHD (N = 16, 38% female): t = 1.78, P = 0.08, moderate CHD (N = 19, 47% female): t = 5.12, P < 0.001, severe CHD (N = 10, 30% female): t = 4.38, P < 0.001.
Association of executive function and white matter anisotropy
Whole-brain voxel-wise analyses revealed one large white matter cluster (Fig. 3) which was significantly associated with gEF in both patients and controls [β = 0.003, t(94) = 6.05, P < 0.001, CI-95 = 0.002–0.004]. This cluster includes fibres of the left superior corona radiata [cluster centre co-ordinates of the most significant cluster (>30 voxels: X = −20, Y = −22, Z = 42; TFCE corrected P = 0.03] and the left corticospinal tract [cluster centre co-ordinates of the most significant cluster (>30 voxels: X = −22, Y = −38, Z = 44; TFCE corrected p = 0.03] and explained 27% of the variance in FA (adjusted R2 = 0.27). Pearson’s correlation coefficients for the association between gEF and FA were r = 0.59 for patients and r = 0.47 for controls, indicating a moderate to strong effect size for both groups. There was no significant interaction between gEF and group [β = 0.000, t(93) = −0.20, P = 0.84, CI-95 = −0.002 to 0.002), indicating that the strength of association between gEF and FA was similar for both groups (Fig. 4).
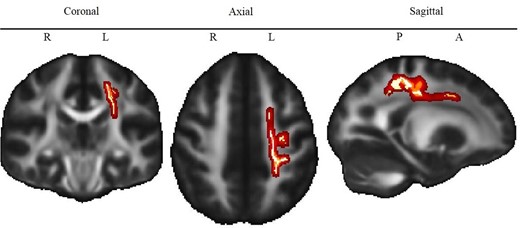
Association of executive function scores and white matter anisotropy. Note. Red to yellow colour indicates voxels for which FA is significantly (TFCE corrected P < 0.05) lower in ACHD compared to controls. Brighter colour indicates higher significance. L = Left, R = Right, P = Posterior, A = Anterior. The map of the different tracts is shown in Supplementary Fig. 2.
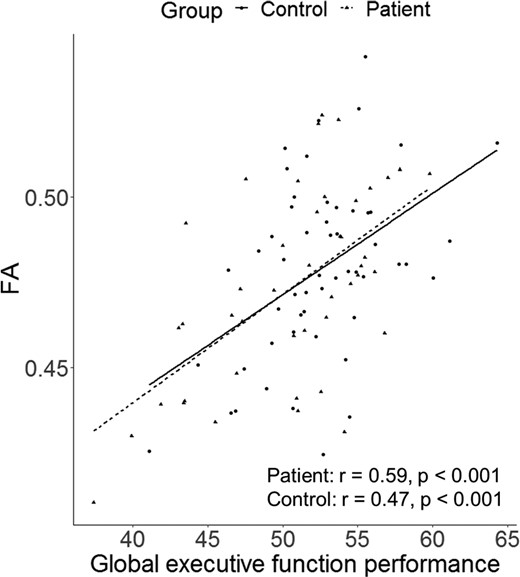
Correlation between executive function scores and white matter anisotropy. Note. r = Pearson’s correlation.
Post-hoc, the association between FA and gEF was corrected for processing speed, which did not improve the model fit (P = 0.868). Processing speed was not associated with FA when included as covariate [β = 0.000, t(93) = −0.167, P = 0.868, CI-95 = −0.001 to 0.001).
Discussion
Congenital heart disease is a chronic condition. In many patients, CHD is a systemic disease with effects that extend beyond the mere cardiac defect. Patients with CHD are at risk for long-standing cognitive impairments and associated brain alterations. This analysis demonstrates widespread lower microstructural alterations in adults with moderate and severe defect complexity compared to healthy controls. Importantly, lower executive function performance was associated with reduced anisotropy in (i) the left superior corona radiata, a white matter projection sheet connecting sub-cortical and cortical regions and (ii) the left corticospinal tract, a motor projection pathway connecting the spinal cord to the cortex.
Microstructural changes in water diffusion quantified by means of FA were altered in various white matter tracts of adults with moderate and severe defect complexity compared to healthy controls. Patients with simple CHD did not differ in FA compared to controls.
FA is a sensitive and robust biomarker for white matter development and integrity, representing the degree of myelination, axonal density, axon calibre and axonal packing (Chang et al., 2017; Hu and McAllister, 2019). In the young ACHD population, Easson and colleagues (2020) suggest that microstructural alterations in young ACHD patients are driven by lower axonal packing rather than differences in alignment.
In CHD, brain alterations are already present during the prenatal and postnatal pre-operative period. Indeed, prenatally delayed cerebral development and postnatal abnormal cerebral findings, such as white matter injury, leukomalacia and stroke, can be observed frequently (see meta analysis: Mebius et al., 2017). Independent of ischaemic brain injury, anisotropy of the white matter microstructure is reduced (Mulkey, 2014; Hagmann et al., 2016; Karmacharya et al., 2018; Claessens et al., 2019) and is associated with decreased oxygen delivery (Kelly et al., 2019). It has been suggested that reduced cerebral oxygen delivery during the third trimester of foetal life and the neonatal period may lead to an undersupply of the vascular-rich sub-ventricular zone, which plays a critical role in neurogenesis and oligodendrocyte myelination. Impaired neurogenesis and pre-myelination can thus be one explanation for alterations in the white matter microstructure at birth (Morton et al., 2017a,b).
Furthermore, various studies have shown that alterations of white matter microstructure are still present in adolescents with CHD: In adolescents with repaired transposition of the great arteries, FA was significantly lower compared to controls in the bilateral deep white matter, cerebral cortex, cerebellum and mid-brain (Rivkin et al., 2013) and white matter network topology was altered (Panigrahy et al., 2015). Tract-based spatial statistics analyses in two cohorts of Fontan patients (Watson et al., 2018) and patients with different types of cyanotic and acyanotic CHD (Ehrler et al., 2020) have revealed widely overlapping reduced FA in almost every cortical and sub-cortical white matter tract. From studies in emerging adults, there is evidence that alterations in the white matter may persist into adulthood (Brewster et al., 2015; Easson et al., 2020). Beside lower anisotropy, Easson and colleagues further demonstrated lower apparent density of axonal packing. Our findings add to this body of evidence that microstructural alterations in CHD can still be observed in young adulthood (18–32 years), when FA of most white matter tracts has peaked (Lebel et al., 2012).
From cross-sectional studies, it is known that alterations of white matter may have an extensive impact on brain function and development. A study by Birca and colleagues (2016) has shown that microstructural alterations are associated with reduced functional connectivity measured with EEG. Studies in adolescents with CHD have further demonstrated associations between reduced local white matter anisotropy and cognitive impairments in domains such as working memory (Ehrler et al., 2020), intelligence (Watson et al., 2018), executive function and behaviour (Rollins et al., 2014), attention and learning (Brewster et al., 2015). In light of the large extent of persisting alterations in projection, commissural and association tracts connecting various brain regions, the associated impact of these structural changes on different aspects of neurodevelopmental (i.e. behavioural, cognitive and motor) outcome requires further investigation at different ages.
This analysis provides strong evidence for an association between executive function and alterations of white matter microstructure. Interestingly, the association between FA and executive function was evident in both ACHD patients and controls, but patients showed lower FA and lower executive function performance overall.
The association of executive function and FA was located in a large left-hemispheric cluster including axonal bundles of the superior corona radiata and the corticospinal tact. The corona radiata is a substantial structure of descending and ascending axons carrying almost all the neuronal traffic between sub-cortical and cortical regions, including the frontal cortex. Our findings suggest that executive function is dependent not just on regions within the frontal lobe but is further sub-served by projection fibres connecting the frontal lobe with other cortical and sub-cortical structures. The significant findings in the corticospinal tract, a major motor pathway, can either be explained either by the motor component, which most of our executive function tasks require, or by the limitations of the single tensor DTI model for resolving crossing fibre tracts (Tuch et al., 2003).
A similar association between the executive function and the microstructure of the superior corona radiata has previously been found in healthy participants (Bendlin et al., 2010; Seghete et al., 2013) and other patient populations, such as adolescents born preterm (Vollmer et al., 2017) and young adults with traumatic brain injury (Kraus et al., 2007; Niogi et al., 2008; Bonnelle et al., 2012; Leunissen et al., 2014). Furthermore, Birdsill and colleagues (2014) observed that alterations of the superior corona radiata in middle-aged and older adults were associated with executive dysfunction. In this study, alterations were defined as white matter hyper-intensities, a common feature of the aging brain, indicating white matter damage, which are more prominent in Alzheimer’s disease and Mild Cognitive Impairment (Yoshita et al., 2006). Hence, these studies underline the key role of the corona radiata with regard to executive functioning and its vulnerability to degenerative changes.
In light of the aging CHD population, investigating executive function and associated brain alterations remains important throughout the lifespan. In healthy elderly participants, executive function has been positively associated with better health-related quality of life and functional mobility (Davis et al., 2010; Gothe et al., 2014) and is thus a key resource in older age. Furthermore, there is evidence that executive dysfunction predicts age-related cognitive decline (Clark et al., 2012). Regarding the increased risk for brain alterations and executive dysfunction in patients with ACHD, brain reserve may be limited in this population, which can be critical for a healthy aging. Increased risk for dementia in patients with ACHD (Bagge et al., 2018) may thus be a consequence of the lower brain reserve in CHD due to vulnerability in key regions associated with cognitive functioning, such as the corona radiata. However, further MRI studies with a longitudinal design and/or older ACHD samples are needed to elucidate the mechanisms, leading to an increased prevalence of dementia and potential sub-clinical impairments in this population.
This study includes a sample of adult patients with various types of CHD, leading to heterogeneity with regard to severity (i.e. simple to severe) and treatment procedures (e.g. need for cardiopulmonary bypass surgery). Therefore, no conclusion can be drawn for any specific heart defects, which might be of interest for patient counselling. However, we were able to demonstrate that significant brain alterations in white matter microstructure were restricted to patients with moderate and severe defect complexity, but not simple CHD.
We used a mean composite score derived from an extensive neuropsychological test battery to investigate gEF performance. While we are aware that executive function is not represented by a global score itself but is rather consisting of core elements, we chose to do so in order to better provide information on executive function as a whole. Importantly, using a global score reduces multiple testing and associated Type 1 errors, which is crucial regarding the limited power of this study. However, using a composite score may reduce specificity and sensitivity and prevents investigating the contribution of each cognitive domain (i.e. inhibition, cognitive flexibility, working memory, verbal and nonverbal fluency and problem solving) and associated sub-tests. However, mean executive function composite scores have been used previously to demonstrate associations between neurological correlates and executive function (Nosarti et al., 2008; Wehrle et al., 2017; Schnider et al., 2020).
The patients included in this study performed mostly within the normal range of the executive function. Despite their high functioning, patients with ACHD still showed significantly worse performance than a control group of healthy participants with comparable age, sex and SES. One explanation for the relatively high performance in both patients and controls might be that the majority of participants had middle to high SES, which is known to be associated with better cognitive function (von Stumm and Plomin, 2015). Therefore, the study population is probably not representative of the general population of patients with ACHD, and thus limits the generalizability of our results.
Our study is one of the first studies investigating brain alterations and its cognitive correlates in patients with ACHD. As all participants included were young adults (i.e. 18–32 years), and white matter anisotropy of specific tracts can increase up to the age of 40 years (Lebel et al., 2012), our results cannot be directly extrapolated to middle age and older adults. Human white matter microstructure changes across the lifespan (Lebel et al., 2008; Bendlin et al., 2010), and hence further studies investigating brain alterations and functional consequences in older adults are also needed.
The significant association between executive function and FA was limited to the left hemisphere and was not evident in fronto-parietal pathways, which is contradictory to the previous studies in healthy participants [see systematic review: (Munro et al., 2018)]. One explanation for this lack of a significant effect in bilateral and fronto-parietal tracts might be the conservative multiple comparison correction, leading to the findings with medium to strong effect sizes only. When marginally lowering the significance threshold post-hoc (α = 0.1, TFCE corrected), the cluster of the superior corona radiata and corticospinal tract was significant in both left and right hemispheres. However, the association between executive function and fronto-parietal pathways remained non-significant. Most other studies use single tests of specific executive function domains. In contrast, we built a gEF score combining different domains of executive function (i.e. inhibition, cognitive flexibility, fluency and problem solving). Due to the merging of executive function domains, we may have missed an association of specific executive functions with fronto-parietal pathways. However, our findings suggest that executive function is processed beyond the prefrontal cortex, which has to be taken into account in future studies.
Conclusion
Significant micro structural changes in a large number of white matter tracts were observed in adults with CHD of moderate and severe complexity compared to healthy controls. Importantly, reduced anisotropy in the left superior corona radiata and corticospinal tract was independently associated with lower executive functioning. These findings underscore that CHD is a chronic condition with systemic effects far beyond the cardiac defect itself. A better understanding of causes and extent of neurocognitive deficits in patients with CHD may improve our counselling and care of the individual patient across the entire lifespan. This may impact on patients’ outcome, quality of life and academic achievements.
Acknowledgements
The authors thank all patients and controls for participating in the study. Furthermore, they thank Thorsten Weirauch and the MRI team for their valuable support in performing the MRI scans and Sarah Rometsch for recruiting the initial cohort of patients. The authors also thank Dr Flavia Wehrle for her valuable help regarding the executive function test battery.
Funding
This work is supported by the Swiss Heart Foundation, the Mäxi Foundation and the Olga-Mayenfisch Foundation. The sponsors had no influence on study design, the collection, analysis and interpretation of data, the writing of the report or the decision to submit the article for publication.
Supplementary material
Supplementary material is available at Brain Communications online.
Competing interests
The authors report no competing interests.
Data availability
De-identified data are available from the corresponding author upon reasonable request.
References
- ACHD =
adults with congenital heart disease
- CHD =
congenital heart disease
- CWIT =
colour word interference task
- DTI =
diffusion tensor imaging
- FA =
fractional anisotropy
- gEF =
global executive function
- SES =
socio-economic status
- TFCE =
threshold-free cluster enhancement
- TR/TE =
repetition time/echo time
Author notes
Ruth O’Gorman Tuura and Beatrice Latal contributed equally to this work.
