


Abstract
It is unclear why exactly gliomas show preferential occurrence in certain brain areas. Increased spiking activity around gliomas leads to faster tumour growth in animal models, while higher non-invasively measured brain activity is related to shorter survival in patients. However, it is unknown how regional intrinsic brain activity, as measured in healthy controls, relates to glioma occurrence. We first investigated whether gliomas occur more frequently in regions with intrinsically higher brain activity. Second, we explored whether intrinsic cortical activity at individual patients’ tumour locations relates to tumour and patient characteristics.
Across three cross-sectional cohorts, 413 patients were included. Individual tumour masks were created. Intrinsic regional brain activity was assessed through resting-state magnetoencephalography acquired in healthy controls and source-localized to 210 cortical brain regions. Brain activity was operationalized as: (i) broadband power; and (ii) offset of the aperiodic component of the power spectrum, which both reflect neuronal spiking of the underlying neuronal population. We additionally assessed (iii) the slope of the aperiodic component of the power spectrum, which is thought to reflect the neuronal excitation/inhibition ratio. First, correlation coefficients were calculated between group-level regional glioma occurrence, as obtained by concatenating tumour masks across patients, and group-averaged regional intrinsic brain activity. Second, intrinsic brain activity at specific tumour locations was calculated by overlaying patients’ individual tumour masks with regional intrinsic brain activity of the controls and was associated with tumour and patient characteristics.
As proposed, glioma preferentially occurred in brain regions characterized by higher intrinsic brain activity in controls as reflected by higher offset. Second, intrinsic brain activity at patients’ individual tumour locations differed according to glioma subtype and performance status: the most malignant isocitrate dehydrogenase-wild-type glioblastoma patients had the lowest excitation/inhibition ratio at their individual tumour locations as compared to isocitrate dehydrogenase-mutant, 1p/19q-codeleted glioma patients, while a lower excitation/inhibition ratio related to poorer Karnofsky Performance Status, particularly in codeleted glioma patients.
In conclusion, gliomas more frequently occur in cortical brain regions with intrinsically higher activity levels, suggesting that more active regions are more vulnerable to glioma development. Moreover, indices of healthy, intrinsic excitation/inhibition ratio at patients’ individual tumour locations may capture both tumour biology and patients’ performance status. These findings contribute to our understanding of the complex and bidirectional relationship between normal brain functioning and glioma growth, which is at the core of the relatively new field of ‘cancer neuroscience’.
Introduction
Glioma, the most frequently occurring primary brain tumour, unequivocally impacts functioning of the rest of the brain. However, seemingly normal variations in brain functioning also affect how gliomas behave, as preclinical work in animal models of glioma as well as in vitro studies have shown. Higher activity of neurons surrounding high-grade gliomas causes an acceleration of glioma growth through glutamate-dependent ‘neurogliomal synapses’.1–6 Development of these synapses is promoted through increased neuroligin-3 (NLGN3) expression, which is also caused by higher neuronal activity.2,3,7 In three glioblastoma patients undergoing electrocorticography during tumour resection, brain activity as measured by gamma band power was significantly higher around the tumour than in more distant regions of the brain.2 Similar results have also been observed when using broadband power measured non-invasively with magnetoencephalography (MEG) and EEG as a proxy of neuronal activity.8 Furthermore, there are indications that healthy and pathological activity in the (peri)tumoural region are interdigitated during cognitive performance in these patients.9 This complex bidirectional interaction between the brain and glioma that informs both tumour and patient behaviour has sparked the relatively new field of ‘cancer neuroscience’, aiming to explain how this crosstalk may inform understanding and treatment of glioma.10,11
A potential implication of this line of research pertains to the relevance of ‘intrinsic’ brain activity, i.e. the assumed preexisting level of brain activity as measured in healthy controls, for glioma occurrence. The distribution of glioma across the neocortex is not random: there is a preponderance of occurrence in the grey matter of the frontal and temporal lobes, with occipital tumours being rare.12,13 Intrinsic regional brain functioning, as measured in healthy subjects, may therefore hold clues as to why gliomas preferentially occur in those brain areas, even without measuring potentially altered activity in patients themselves. Indeed, a recent study used resting-state functional MRI network indicators of intrinsic regional hubness (i.e. the relative importance of regions in the brain network) to show that glioma most often occurs in those areas more functionally connected to other brain regions.14 Moreover, gliomas seem to preferentially occur in brain regions normally characterized by greater MEG network clustering.15 Interestingly, work in other neurological diseases has shown that lesions occurring in such highly connected, putatively also highly active,16 brain regions have a bigger impact on global brain network functioning as well as neurological symptomatology than lesions in less-connected areas of the brain.17–19 However, it is unknown how regional intrinsic brain activity relates to glioma occurrence, and how activity at individual tumour locations may concurrently pertain to pathophysiological characteristics, such as glioma subtype and patients’ performance status. The latter may be of particular interest, since recent work suggests that the interplay between peritumoral neurons and glioma cells relates to both cognitive functioning and survival.20
Combining these lines of research, we here set out to first test whether intrinsic, healthy regional variance in brain activity could further increase our understanding of preferential glioma occurrence. We measured brain activity non-invasively in a cohort of healthy controls with MEG and calculated three proxies of neuronal activity per brain region. On the basis of the relationship between spiking activity and tumour growth, we proposed that gliomas preferentially occur in intrinsically more active brain areas, particularly so for more malignant gliomas for which the relationship between neuronal activity and proliferation has been amply shown in preclinical studies. Second, we aimed to use intrinsic brain activity at each individual patient’s tumour location as a correlate of tumour and patient characteristics to investigate whether it would reflect the tumour biology, symptomatology and prognosis of these patients. If so, such findings could lead to the discovery of treatment targets for this lethal disease.
Materials and methods
Patient cohorts
Three newly diagnosed diffuse glioma patient cohorts were used in this study. The Amsterdam (AMS) cohort was selected retrospectively from a set of patients who visited the Brain Tumor Center Amsterdam of the Amsterdam University Medical Centers (Amsterdam, The Netherlands) between 2004 and 2013 with a suspected diffuse glioma. This cohort participated in previous work and consisted of patients undergoing clinical task-based functional MRI for motor and/or language localization before tumour resection.21 Further inclusion criteria for the study were being aged 18 years or older and histopathologically confirmed diffuse glioma according to the World Health Organization (WHO) 2007 classification.22 Inclusion of these patients and use of their data was approved by the Medical Ethical Committee of the VU University Medical Center.
The second cohort was also selected, retrospectively, from the patient population visiting Massachusetts General Hospital (Boston, MA, USA; MGH cohort) between 2006 and 2013 with suspected diffuse glioma. These patients were included in previous work and consisted of patients undergoing anatomical and diffusion MRI.23 Further inclusion criteria were identical to the AMS cohort. Inclusion of these patients and use of their data was approved by the Institutional Review Board of the Dana Farber Cancer Institute.
Finally, we used the publicly available glioblastoma dataset from The Cancer Genome Atlas (TCGA) combined with The Cancer Imaging Archive as a source of tumour masks drawn by a different expert panel;24 these tumour masks were in part also validated through the Brain Tumour Segmentation challenge.25 We used both the glioblastoma multiforme and low-grade glioma cohorts of the TCGA data.
Patient and tumour-related characteristics
Medical chart review was used to extract additional relevant patient characteristics for the AMS and MGH cohorts at the preoperative timepoint, which was concurrent to the MRI scan on which tumour masks were drawn in. These characteristics included age, sex, Karnofsky Performance Status26 (KPS), presence or absence of epilepsy and disease course. Medical chart review also revealed clinically determined tumour subtype (i.e. isocitrate dehydrogenase [IDH] and 1p/19q status), according to the 2021 WHO classification.27 Accordingly, three main molecular subgroups were defined: (i) IDH-mutant, 1p/19q-codeleted (grade II and III) gliomas; (ii) IDH-mutant (grade II and III) gliomas without 1p/19q codeletion; and (iii) IDH-wild-type (grade IV) glioblastomas.
For each individual patient, progression-free survival (PFS) was defined as the time in weeks between the date of the preoperative MRI and the date of the moment of progression, clinically defined by the treating physician and/or the multidisciplinary tumour board including neurologists, neurosurgeons, neuroradiologists, radiation oncologists and medical oncologists. Overall survival (OS) was defined as the time between the preoperative MRI and death in weeks. Patients without progression or death were censored at the time of their last contact with the treating neuro-oncologist.
For the TCGA dataset, tumour masks, sex, age, KPS and OS were available via the TCGA database, available through https://portal.gdc.cancer.gov/. For the low-grade glioma dataset, we additionally extracted molecular subgroups from a previous publication on these data.28
Glioma occurrence maps
All information on the TCGA dataset and tumour masks can be found elsewhere.25 In the AMS and MGH cohorts, preoperative anatomical MRI was obtained. All tumour masks were manually drawn using the preoperative (3D)T1 with and without contrast injection and fluid-attenuated inversion recovery (FLAIR) images, as is the current standard in clinical neuro-oncology.29 Tumour borders were largely determined using the contrast-enhancing tumour rims, unless FLAIR images showed more extensive tumour infiltration beyond contrast enhancement, in which cases the tumour mask was extended to also incorporate these FLAIR hyperintense regions. In non-enhancing glioma, a combination of T1 hypointensities (tumour core) and FLAIR hyperintensities (tumour infiltration) was used to draw in tumour masks. Tumour masks were then linearly transformed to Montreal Neurological Institute (MNI) standard space based on brain extracted scans using FSL’s FMRIB Linear Image Registration Tool (FLIRT) with nearest neighbour interpolation and 12 degrees of freedom (FSL v.5.0.10).30 Linear coregistration was used as in our experience with this particular data, it generally works well and needs little manual correction in the context of brain tumour patients.
Glioma masks were then merged into a tumour occurrence heat map per cohort or per cohort-specific subgroup, representing the relative occurrence of tumour per voxel. This voxel-based map was then averaged across the 210 cortical regions of the Brainnetome atlas31 to create a regional map of tumour occurrence, as schematically depicted in Fig. 1.
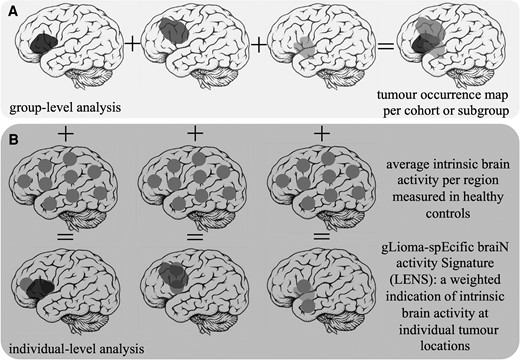
Schematic overview of patient-related analyses. (A) The construction of the tumour occurrence map per cohort or subgroup by summation of all tumour masks in template space is depicted. (B) Individual tumour masks are overlaid with regional brain activity values of healthy controls. Brain activity values are then weighted according to per cent overlap with the tumour, and the ultimate average LENS is normalized for the total number of regions overlapping with the tumour.
Intrinsic regional brain activity
Healthy subjects were selected from a cohort previously collected as a control group in non-glioma studies,32–34 consisting of 65 healthy controls who underwent, amongst others, structural MRI and MEG. From this cohort, controls were selected by initially matching them to the AMS patient cohort at the group-level with respect to age and sex. Inclusion of these subjects was approved by the VU University Medical Center ethical review board and all subjects gave written informed consent before participation.
Healthy controls underwent 5-min eyes-closed MEG in a supine position using a whole-head system (Elekta Neuromag Oy) with 306 channels inside a magnetically shielded room (Vacuumschmelze GmbH). Data were recorded with a sampling frequency of 1250 Hz, filtered online with a 410 Hz anti-aliasing filter and a 0.1 Hz high-pass filter. The head position relative to the sensors was recorded continuously with head-localization coils. A 3D digitizer (Fastrak, Polhemus) digitized the head-localization coil positions and scalp outline (∼500 points) to allow surface matching of the scalp surface points with anatomical MRI.
These data were processed as previously described.35–37 In short, data were visually inspected and at maximum 12 malfunctioning channels were excluded. Offline spatial filtering of the raw data removed artefacts using the temporal extension of Signal Space Separation (tSSS) using MaxFilter software (Elekta Neuromag Oy; v.2.1).38 The reconstruction of neuronal sources was performed with an atlas-based beamforming approach39 that uses weight normalization, after which time series (virtual electrodes) for each centroid of each atlas region were reconstructed in the broadband frequency range (0.5–48 Hz).40 Ten artefact-free epochs of 13.3 s each were used for further analysis.
Three measures of brain activity were then calculated using these epochs: (i) broadband power of the power spectrum; (ii) offset; and (iii) slope of the aperiodic component of the power spectrum, as described before.8 Broadband power reflects the spectral density or area under the curve of the total spectral signal measured with MEG, and reflects the spiking rates of the underlying neuronal populations.41,42 The offset is related to broadband power, but filters out frequency-specific variations in signals to establish a potentially more specific measure of neuronal spiking.43 Finally, the slope takes into account the distribution of signal across the entire frequency spectrum, with a steeper slope (i.e. more low-frequency signal) reflecting a lower excitation/inhibition (E/I) ratio,43 thus indicating relatively more inhibition occurring in the underlying neuronal populations. This measure, although not a direct reflection of neuronal activity, was taken into account as well, since in vitro experiments on glioma tissue have shown that blockage of excitatory AMPA receptors through the anti-seizure medication perampanel inhibits tumour growth in the context of increased neuronal spiking, supporting the idea that the balance between excitation and inhibition may be of relevance in glioma, and also for future treatment strategies.1 These three measures are interrelated: broadband power and offset are most straightforwardly related to each other, while the relationship between slope and the other two measures is less evident. Previous studies in healthy controls have only investigated the relationship between band-specific power and slope, such that greater alpha power goes hand in hand with relatively less steep slope values (higher excitation over inhibition) when also determined over a low-frequency range.43,44 It remains unknown how broadband slope associates with power and offset.
Broadband power, offset and slope were then averaged across all healthy subjects to obtain an average distribution of values across the 210 cortical regions. We then excluded the medial brain regions, as they are further away from the MEG sensors and thus have low signal-to-noise (SNR) ratios, potentially confounding any results (Supplementary Fig. 1).45,46 Additional analyses taking all regions into account can be found in the Supplementary material.
Intrinsic brain activity signatures at individual tumour locations
To assess the clinical relevance of healthy, intrinsic brain activity at patients’ individual glioma locations, a glioma-specific brain activity signature (LENS) was calculated (Fig. 1). Each tumour mask was overlaid with the group-averaged intrinsic brain activity value (broadband power, offset or slope) per region. We multiplied the percentage of each brain region invaded by a patient’s glioma with the healthy brain activity value for that same region, then summed these values over all tumour-invaded brain regions, and finally divided the sum by the number of regions invaded by tumour. This yielded three LENS values per patient that were corrected for tumour size: LENS-broadband power (bbp), LENS-offset and LENS-slope.
Statistical analysis
Statistical analyses were performed with MATLAB (v.R2020.b, Mathworks, Natick, MA, USA) and IBM SPSS Statistics (v.22, IBM Corp., Armonk, NY, USA). Data are presented as mean [standard deviation (SD)] when normally distributed, or median [1st quartile (Q1)–3rd quartile (Q3)] when deviating from a normal distribution. Group differences in age and sex were explored using Student’s t-tests and chi-square tests.
Regional glioma occurrence was correlated with group-averaged regional healthy brain activity of all included cortical regions using Spearman’s correlation coefficients, within all cohorts and subgroups. Since correlations between brain maps may in part be due to the higher chance that neighbouring regions display comparable variations, we performed the spin test using publicly available code to obtain P-values adjusted for this higher chance (https://www.github.com/spin-test).47 This procedure uses a spatial permutation framework to generate null models of correlation by applying random rotations to spherical projections of both regional glioma occurrence and regional brain activity mapped onto the cortical surface, and obtaining a model-specific distribution of correlation to establish an adjusted P-value (Pspin). A Pspin-value below 0.05 was considered significant.
Tumour subgroup differences in LENS values were tested using Kruskal–Wallis signed rank tests followed by post hoc Dunn pairwise tests in case of significant results. Differences in LENS values, according to presence of epilepsy and low versus high KPS, were tested using Mann–Whitney U-tests per tumour subgroup. Associations between LENS values and tumour volume were tested using regression analyses, while correcting for tumour lateralization. Finally, univariate Cox proportional hazards analyses of the relationships between LENS values and OS and PFS were performed. To allow for more interpretable hazard ratios, LENS values were first standardized through z-score calculation using the mean and SD of the entire cohort. A P-value <0.05 was considered significant.
Data availability
The derivative data and code used in this manuscript are available for download at https://github.com/multinetlab-amsterdam/projects/tree/master/Glioma_Occurrence_LENS.
Citation diversity statement
Recent work in several fields of science has identified a bias in citation practices such that papers from women and other minority scholars are under cited relative to the number of such papers in the field.48–56 To increase awareness of this issue, we here present the gender and racial-ethnic diversity of our references. First, we obtained the predicted gender of the first and last author of each reference by using databases that store the probability of a first name being carried by a woman.53,57 By this measure (and excluding self-citations to the first and last authors of our current paper), our references contain 13.46% woman(first)/woman(last), 11.54% man/woman, 13.46% woman/man and 61.54% man/man. This method is limited in that: (i) names, pronouns and social media profiles used to construct the databases may not, in every case, be indicative of gender identity; and (ii) it cannot account for intersex, non-binary or transgender people. Second, we obtained predicted racial/ethnic category of the first and last author of each reference by databases that store the probability of a first and last name being carried by an author of colour.58,59 By this measure (and excluding self-citations), our references contain 5.59% author of colour (first)/author of colour(last), 10.95% white author/author of colour, 24.51% author of colour/white author and 58.95% white author/white author. This method is limited in that: (i) names and Florida Voter Data to make the predictions may not be indicative of racial/ethnic identity; and (ii) it cannot account for Indigenous and mixed-race authors, or those who may face differential biases due to the ambiguous racialization or ethnicization of their names. We look forward to future work that could help us to better understand how to support equitable practices in science.
Results
Subject characteristics
Characteristics of the main patient cohorts and subgroups can be found in Table 1, and tumour occurrence maps per cohort displayed the expected preference of glioma to occur in the frontoparietal regions (Supplementary Fig. 2). The AMS cohort consisted mainly of IDH-mutant gliomas, while the MGH and TCGA cohorts consisted mostly of IDH-wild-type glioblastomas. Subgroup characteristics reflected the expected differences between these cohorts: the AMS cohort was younger than both other cohorts, with AMS patients generally having longer survival times.
Patient characteristics
| Subgroup | AMS cohort | |||
|---|---|---|---|---|
| All patients (n = 83) | Subgroup 1 (n = 21) | Subgroup 2 (n = 30) | Subgroup 3 (n = 15) | |
| Mean age in years (SD) | 41 (12) | 43 (9) | 35 (10) | 54 (13) |
| Number of males | females | 55 | 28 | 14 | 7 | 16 | 14 | 13 | 2 |
| Glioma localization left | right | 46 | 37 | 12 | 9 | 20 | 10 | 9 | 6 |
| Number of patients with unknown | non-subgroup IDH-1p/19q status | 17 | 0 | NA | NA | NA |
| Median tumour volume in cm3 in MNI space (Q1–Q3) | 89 (43–158) | 79 (47–169) | 88 (45–140) | 117 (52–187) |
| Median PFS in weeks (Q1–Q3; n with progression) | 122 (43–246; 59) | 235 (92–286; 10) | 79 (45–224; 23) | 42 (18–66; 14) |
| Median OS in weeks (Q1–Q3; n died) | 167 (71–321; 29) | 277 (180–452; 4) | 268 (213–323; 8) | 70 (49–114; 13) |
| Number of patients with KPS <90 | 90–100 | unknown | 23 | 38 | 22 | 7 | 10 | 4 | 5 | 18 | 7 | 5 | 3 | 7 |
| Number of patients with epilepsy | without epilepsy | unknown | 60 | 12 | 11 | 14 | 3 | 4 | 24 | 3 | 3 | 9 | 4 | 2 |
| Subgroup | MGH cohort | |||
| All patients (n = 121) | NA | Subgroup 2 (n = 17) | Subgroup 3 (n = 91) | |
| Mean age in years (SD) | 53 (14) | 40 (13) | 57 (12) | |
| Number of males | females | 67 | 54 | 6 | 11 | 54 | 37 | |
| Glioma localization left | right | bilateral | 58 | 60 | 3 | 9 | 8 | 46 | 44 | 1 | |
| Number of patients with unknown | non-subgroup IDH–1p/19q status | 13 | 0 | NA | NA | |
| Median tumour volume in cm3 in MNI space (Q1–Q3) | 34 (18–64) | 46 (16–86) | 32 (19–56) | |
| Median PFS in weeks (Q1–Q3; n with progression) | 45 (33–77; 72) | 85 (30–149; 5) | 44 (33–65; 63) | |
| Median OS in weeks (Q1–Q3; n died) | 79 (48–119; 58) | NA | 79 (48–120; 56) | |
| Number of patients with KPS <90 | 90–100 | unknown | 29 | 76 | 16 | 2 | 14 | 1 | 25 | 51 | 15 | |
| Number of patients with epilepsy | without epilepsy | unknown | 76 | 26 | 19 | 11 | 5 | 1 | 57 | 17 | 17 | |
| Subgroup | TCGA cohort | |||
| All patients (n = 209) | Subgroup 1 (n = 27) | Subgroup 2 (n = 58) | Subgroup 3 (n = 102) | |
| Mean age in years (SD) | 52 (15) | 54 (12) | 41 (12) | 58 (14) |
| Number of males | females | unknown | 113 | 95 | 1 | 13 | 14 | 29 | 29 | 63 | 38 | 1 |
| Glioma localization left | right | bilateral | 94 | 86 | 29 | 9 | 10 | 8 | 20 | 28 | 10 | 52 | 40 | 10 |
| Number of patients with unknown | non-subgroup IDH–1p/19q status | 0 | 22 | NA | NA | NA |
| Median tumour volume in cm3 in MNI space (Q1–Q3) | 40 (14–73) | 30 (12–79) | 22 (7–57) | 53 (26–84) |
| Median OS in weeks (Q1–Q3; n died) | 57 (28–99; 100) | 133 (3–235; 5) | 191 (101–411; 11) | 51 (23–84; 76) |
| Number of patients with KPS <90 | 90–100 | unknown | 90 | 65 | 54 | 4 | 11 | 12 | 9 | 28 | 21 | 72 | 17 | 13 |
In total, 45 of 65 available healthy controls were matched primarily to the AMS patient cohort, since we had most extensive clinical information on this cohort. The matched healthy cohort consisted of 25 males (20 females), with a mean age of 43 years (SD = 9). As could be expected based on the literature, regional broadband power and offset values were most strongly correlated (Spearman’s rho = 0.734, P < 0.001), followed by a correlation between offset and slope values (rho = −0.312, P < 0.001) and finally between broadband power and slope (rho = −0.299, P < 0.001).
Associations between regional glioma occurrence and intrinsic brain activity
We first set out to test the hypothesis that glioma preferentially occurs in brain regions that are characterized by intrinsically greater brain activity. Indeed, higher regional healthy brain activity values in terms of offset were related to higher regional glioma occurrence across cohorts in IDH-mutant, 1p/19q-codeleted glioma (combined cohorts rho = 0.424, Pspin = 0.037; Table 2 and Figs 2 and 3), IDH-mutant, non-codeleted tumours (combined cohorts rho = 0.485, Pspin = 0.002) and IDH-wild-type glioma (combined cohorts rho = 0.429, Pspin = 0.015). For IDH-wild-type tumours, there was also a robust association with intrinsic slope (combined cohorts rho = −0.446, Pspin = 0.010).
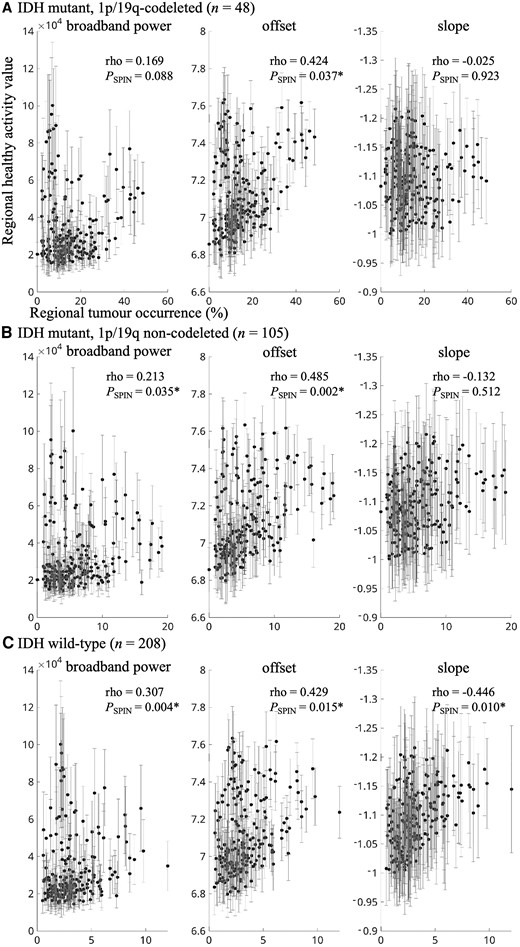
Correlations between tumour occurrence and intrinsic regional brain activity per tumour subtype. (A) The correlation between regional tumour occurrence of all IDH-mutant, 1p/19q-codeleted gliomas on the x-axis and average regional intrinsic brain activity of the healthy controls on the y-axis (error bars indicate SD per region), for broadband power (left), offset (middle) and slope (right). Axis titles are identical for all plots. B and C show the same correlations for all IDH-mutant, 1p/19q non-codeleted gliomas and IDH-wild-type gliomas, respectively. *Statistically significant using the spin test.
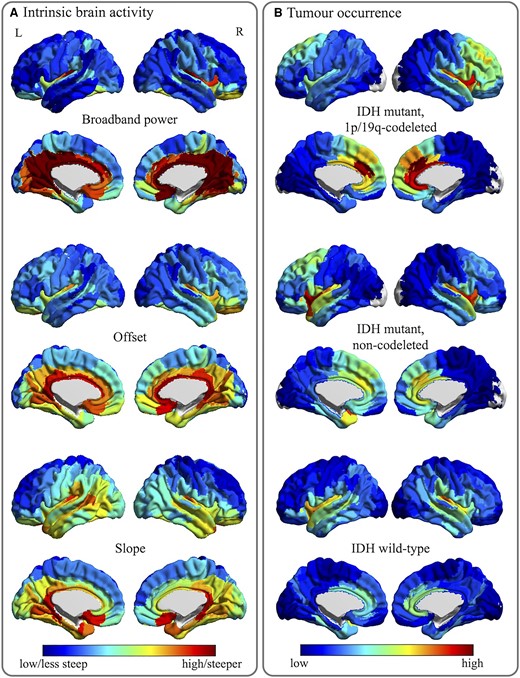
Tumour occurrence and intrinsic regional brain activity maps. (A) The average regional brain activity levels for all 210 cortical regions in the atlas used, for the healthy controls. Cool colours indicate lower values or less steep (less negative) slope values, while warm colours reflect higher values or steeper slope values. (B) The regional occurrence of tumours for the same 210 atlas regions, per tumour subtype. Cool colours reflect low occurrence, warm colours signify high occurrence.
Associations between regional glioma occurrence and regional intrinsic brain activity
| Subgroup | Cohort | n | Broadband power | Offset | Slope |
|---|---|---|---|---|---|
| IDH-mutant, 1p/19q-codeleted | AMS | 21 | 0.003 (0.968) | 0.035 (0.825) | 0.167 (0.524) |
| TCGA | 27 | 0.182 (0.073) | 0.499 (0.009)* | −0.073 (0.706) | |
| Combined | 48 | 0.169 (0.088) | 0.424 (0.037)* | −0.025 (0.923) | |
| IDH-mutant, non-codeleted | AMS | 30 | 0.111 (0.239) | 0.396 (0.023)* | −0.069 (0.747) |
| MGH | 17 | 0.062 (0.051) | 0.305 (0.137) | 0.088 (0.710) | |
| TCGA | 58 | 0.260 (0.012)* | 0.473 (0.004)* | −0.213 (0.309) | |
| Combined | 105 | 0.213 (0.035)* | 0.485 (0.002)* | −0.132 (0.512) | |
| IDH-wild-type | AMS | 15 | 0.177 (0.090) | 0.418 (0.051) | −0.128 (0.583) |
| MGH | 91 | 0.278 (0.006)* | 0.315 (0.034)* | −0.437 (0.005)* | |
| TCGA | 102 | 0.270 (0.003)* | 0.309 (0.040)* | −0.387 (0.002)* | |
| Combined | 208 | 0.307 (0.004)* | 0.429 (0.015)* | −0.446 (0.010)* |
*P < 0.05. Values reflect Spearman correlation coefficients (P-value of the spin test). Combined cohort correlations are in italics to relfect their dependence on the separate cohorts.
Several additional analyses were performed to check the robustness of these results (see Supplementary material for details). Since the included healthy controls were significantly younger than patients in the MGH and TCGA cohorts, additional analyses were performed to assure that any findings in the MGH/TCGA cohorts were not due to this age difference. Results did not change when considering the medial cortical regions as well (Supplementary Table 1). Moreover, since we used the average of the healthy controls per region as an indication of intrinsic brain activity, we explored whether regional differences were larger than individual variations in our three measures. This largely proved to be the case (Supplementary Fig. 1), further supporting the robustness of these findings.
LENS differences between molecular and performance status subgroups
We then investigated whether LENS (i.e. the weighted value characterizing intrinsic healthy brain activity at individual patients’ glioma locations) differed per molecular subgroup. Indeed, there was a significant difference in LENS-bbp between groups (Kruskal–Wallis Z = 9.32, P = 0.009), which was mainly due to the IDH-wild-type glioblastoma patients having higher LENS-bbp than IDH-mutant, 1p/19q-codeleted glioma patients (Supplementary Table 2). A group difference was also found for LENS-slope (Kruskal–Wallis Z = 39.27, P < 0.001), with every subgroup differing significantly from the others and more malignancy going hand in hand with a more negative slope (Fig. 4 and Supplementary Table 2).
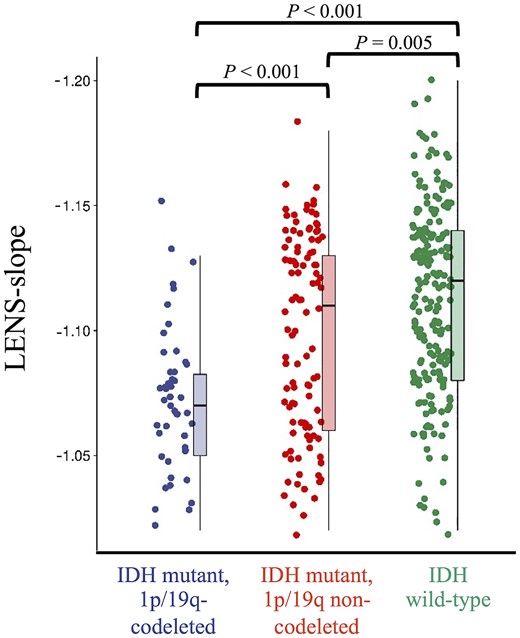
Individual LENS-slope values according to tumour subtype. This figure shows box plots and all individual patient data-points of LENS-slope values per tumour subtype.
When focusing on patients’ performance status, LENS-slope was less steep in patients with KPS < 90, compared to patients with KPS of 90 or 100 (Mann–Whitney U = 8402, P = 0.039; Fig. 5), while LENS-bbp (Mann–Whitney U = 8985, P = 0.227) and LENS-offset (Mann–Whitney U = 9401, P = 0.552) did not differ between groups (Supplementary Table 3). Post hoc tests per tumour subgroup revealed that LENS-slope was particularly less steep in low KPS patients with IDH-mutant, 1p/19q-codeleted glioma, but did not differ according to KPS in patients with IDH-mutant, non-codeleted glioma or IDH-wild-type glioblastoma (Supplementary Table 3).
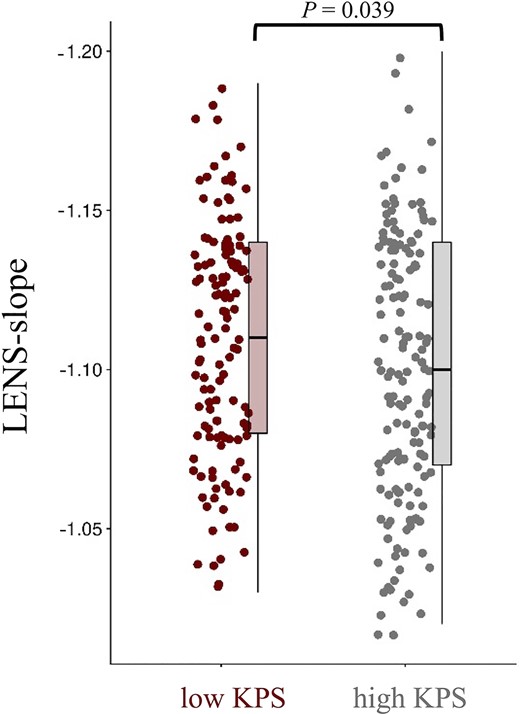
Individual LENS-slope values according performance status. This figure shows box plots and all individual patient data-points of LENS-slope values for patients with low (<90) and high KPS (90–100).
Associations between LENS and other clinical variables
LENS values were not significantly related to tumour volume across tumour subgroups and when adjusting for tumour lateralization (Supplementary Table 4). Presence of epilepsy also did not relate to any LENS values (Supplementary Table 5).
The LENS values were generally not significantly related to PFS or OS in any of the univariate analyses per subgroup (Supplementary Table 6), except for LENS-bbp in the IDH-wild-type glioblastoma patients, which was characterized by a significant hazard ratio of 1.19 [95% confidence interval (1.00 1.41), P = 0.049] for PFS, suggesting that higher LENS-bbp was associated with shorter PFS.
Discussion
We have shown that glioma preferentially occurs in regions intrinsically characterized by higher brain activity. The most malignant subtype, the IDH-wild-type glioblastoma, was also preferentially localized at regions with a relatively lower intrinsic E/I ratio. Furthermore, intrinsic E/I ratio at each patient’s individual tumour location was lowest in IDH-wild-type glioma patients, followed by IDH-mutant, non-codeleted glioma patients and last IDH-mutant, 1p/19q-codeleted glioma patients. Intrinsic E/I ratio at individual tumour locations was associated with KPS, particularly in the IDH-mutant, 1p/19q-codeleted glioma patients.
Our hypothesis regarding the preferential occurrence of glioma in brain regions intrinsically characterized by higher neuronal activity was confirmed: higher offset, potentially the best proxy of neuronal spiking rates due to its disentanglement from the oscillatory behaviour that is also measured with MEG and captured by broadband power,43 was associated with higher glioma occurrence across tumour subgroups. Preclinical literature describes a causal relationship between peritumoral neuronal spiking rates and tumour growth.1–6 Taken together with the current results, regions with intrinsically higher activity may be particularly susceptible to glioma growth, at least in terms of the tumour bulk that is visible on MRI. It remains unclear whether intrinsic spiking rate is a cause of these glioma subtypes originating at particular locations, or merely a contributing factor to its ongoing growth. Regardless of whether brain activity is a cause for occurrence or a byproduct of some underlying mechanism, our results further add to the existing evidence that brain pathology, including glioma, preferentially occurs in brain regions that are intrinsically more active and connected.14–17,60 Such hub regions are thought to be more costly and vulnerable due to their metabolic energy demands.19 In addition to the recent cellular insights into the complex interplay between the brain and glioma,10 these findings underline the circuit-level and potentially whole-brain involvement of healthy brain activity in regional glioma occurrence.
IDH-wild-type glioblastomas also occurred more often in brain regions with intrinsically steeper slope, indicating that a low regional healthy E/I ratio (relatively greater inhibition) associates with higher tumour occurrence. In light of the positive correlation between neuronal activity and tumour growth, regions with relatively greater excitation may intuitively seem more likely to harbour these malignant tumours, particularly since preclinical work has shown glutamate-dependent neurogliomal synapses to drive this relationship.1,2 Previous studies have indicated that alpha band-specific slope is negatively related to offset and power indices when also calculated on narrow frequency bands.43,44 However, it is unclear how slope as calculated on the wide range of frequencies as performed here relates to the other measures; our results indicate that greater neuronal activity as measured with power and offset is reflected by relatively higher inhibition over excitation (lower E/I ratio). Inhibition is thought to shape cortical activity, potentially to a larger extent than excitation,61 particularly when it concerns slower, more distant (>4 mm) interactions.62 As such, regions with greater potential for inhibition may orchestrate neuronal activity to a larger extent than regions with a higher E/I ratio, but future studies combining these measures, investigating both broadband and band-specific components, and verifying the actual contribution of excitatory and inhibitory processes to the signals measured with MEG are necessary. This would be particularly relevant, since the three brain measures used in this study were significantly interrelated and may not reflect fully separate processes.
We also considered intrinsic brain activity profiles at individual patients’ tumour locations using LENS, in an effort to translate intrinsic regional activity patterns to clinically relevant tumour and patient characteristics. Particularly LENS-slope robustly differed between tumour subgroups: the IDH-wild-type glioblastoma patients’ values were highest, while IDH-mutant, 1p/19q-codeleted glioma patients’ values were lowest, suggesting that a lower E/I ratio at individual tumour locations goes hand in hand with increasing malignancy. As such, tumours occurring in regions that are normally characterized by relatively greater inhibitory activity have poorer prognoses. LENS-slope also showed clinical potential, as lower intrinsic E/I ratio at the tumour location was found in patients with lower KPS, particularly in IDH-mutant, 1p/19q-codeleted glioma patients. Perhaps, if regions intrinsically favouring greater inhibition orchestrate overall activity and potentially connectivity, and are invaded by glioma, integration across different brain regions may be affected to a larger extent than when the glioma occurs at a location with less inhibitory, integrative activity. We previously reported higher relative inhibitory activity (lower E/I ratio) in glioma patients in the regions around the tumour, both compared to healthy controls and to the contralateral hemishere.8 The E/I ratio at individual tumour locations may therefore be a relevant factor to further investigate from a clinical perspective, particularly since perampanel, an AMPA inhibitor, has been shown to inhibit tumour growth in vitro.1 Future work may investigate how intrinsic E/I values at the tumour location relate to pathological decreases in this ratio measured at diagnosis, together potentially impacting KPS and perhaps more fine-grained measures of performance, such as cognitive functioning. This is all the more relevant since preserved and dysfunctional activity patterns measured intraoperatively around the tumour during task performance have been shown to be relevant for cognitive processes.9 Also, we have previously shown an intricate relationship between intrinsic, healthy local functional connectivity at individual tumour locations and the level of pathological functional connectivity measured in glioma patients,15 such that patients with tumours occurring in intrinsically less-connected brain regions actually show pathological functional connectivity, whereas those with tumours in more connected brain regions do not display pathological connectivity themselves. Speculatively, combining LENS-slope with brain activity measured in glioma patients may hold further explanatory and predictive value towards functional and cognitive trajectories in these patients.
Previous studies have speculated on the role of epilepsy in promoting activity-dependent tumour growth,4,63 and seizures were found to directly increase the neurogliomal calcium transients leading to tumour growth and infiltration.1 We did not find differences in LENS values between patients with and without epilepsy, potentially due to the low number of patients without epilepsy in our study and the fact that most patients with epilepsy took AEDs. Also, larger tumour volumes did not relate to LENS indices. Of course, tumour volume at diagnosis depends on multiple factors that we cannot disentangle in the current study. For instance, IDH-wild-type gliomas are typically associated with more oedema and mass effects due to faster tumour growth, which may lead to faster diagnosis, even at smaller tumour volumes. Longitudinal studies assessing the relationship between tumour volume, LENS values and patients’ own brain activity levels could further elucidate how non-invasively measured brain activity may provide information about tumour volume over time.
Finally, we did not find LENS values to have predictive power in terms of PFS or OS, except for broadband power: higher LENS values were related to shorter PFS in IDH-wild-type glioblastoma patients. This finding in part corroborates previous work that has shown that MEG broadband power measured in glioma patients before and after tumour resection relates to prognosis, such that greater broadband power is related to shorter survival.35,37 Taking these studies and our current results together, we may speculate that brain activity at the tumour location is already pathologically increased in patients at diagnosis,35,37 potentially due to the bidirectional relationship between (intrinsic) neuronal activity and tumour growth. Intrinsic brain activity at the tumour location, as measured in healthy controls like in the current work, may therefore hold limited specific prognostic value, but longitudinal studies should further explain how brain activity changes during the course of the disease. Faster disease trajectories could for instance be expected for tumours located in brain areas with intrinsically higher brain activity and that also have larger pathological increases of activity at diagnosis.
Several limitations should be kept in mind when interpreting these results. First of all, sample sizes of subgroups, particularly the IDH-mutant, 1p/19q-codeleted patients, were relatively small and may have obscured results. Also, particularly the AMS cohort may have suffered from selection bias, as these patients underwent task-based functional MRI and may not represent the complete population of glioma patients. Second, direct translation of preclinical work to our patient study is hampered by several factors. We non-invasively measured neuronal activity, which may have affected the comparability between previous work concerning spiking rates and the current results. Third, particularly the slope of the aperiodic component of the power spectrum, thought to reflect the balance between excitation and inhibition of the underlying neuronal populations, is a novel measure and has not been extensively validated. Moreover, we adhered to several choices made in previous work regarding the frequency range of interest and parameters used for the analysis of the offset and slope, for which currently no gold standard exists. Finally, we used intrinsic brain activity indices by averaging regional indices over a cohort of healthy controls, although it is clear that there is variation across these subjects that we did not take into account in our analyses. Furthermore, our calculation of LENS values was based on the weighted overlap between patients’ individual tumour masks and average regional brain activity values, while the contribution of different atlas regions’ intrinsic activity values is likely to be more complex.
In conclusion, we have shown that glioma occurs more often in brain regions that are intrinsically more active, with the most malignant glioblastomas also favouring areas that are intrinsically marked by a lower E/I ratio. We also described how the intrinsic E/I ratio at patients’ individual tumour locations independently relate to tumour subtype and performance status, such that patients with prognostically unfavourable tumour subtypes and poorer KPS have tumours in regions with relatively higher inhibition. Taken together, our findings offer a better understanding of activity-dependent preferential tumour occurrence and indicate that glioma localization in terms of intrinsic brain activity levels reflects both tumour biology and performance status.
Funding
Part of the data collection was funded by the Netherlands Organization for Scientific Research (Rubicon grant, Veni grant 91614986, Vidi grant 198.015) and the Branco Weiss Fellowship.
Competing interests
The authors report no competing interests.
Supplementary material
Supplementary material is available at Brain online.
References
Abbreviations
- E/I
excitation/inhibition
- FLAIR
fluid-attenuated inversion recovery
- IDH
isocitrate dehydrogenase
- KPS
Karnofsky Performance Status
- LENS
glioma-specific brain activity signature
- OS
overall survival
- PFS
progression-free survival
- TCGA
The Cancer Genome Altas

