


Abstract
While several studies have attributed the development of tumour-associated seizures to an excitatory-inhibitory imbalance, we have yet to resolve the spatiotemporal interplay between different types of neuron in glioma-infiltrated cortex.
Herein, we combined methods for single unit analysis of microelectrode array recordings with wide-field optical mapping of Thy1-GCaMP pyramidal cells in an ex vivo acute slice model of diffusely infiltrating glioma. This enabled simultaneous tracking of individual neurons from both excitatory and inhibitory populations throughout seizure-like events. Moreover, our approach allowed for observation of how the crosstalk between these neurons varied spatially, as we recorded across an extended region of glioma-infiltrated cortex.
In tumour-bearing slices, we observed marked alterations in single units classified as putative fast-spiking interneurons, including reduced firing, activity concentrated within excitatory bursts and deficits in local inhibition. These results were correlated with increases in overall excitability. Mechanistic perturbation of this system with the mTOR inhibitor AZD8055 revealed increased firing of putative fast-spiking interneurons and restoration of local inhibition, with concomitant decreases in overall excitability.
Altogether, our findings suggest that diffusely infiltrating glioma affect the interplay between excitatory and inhibitory neuronal populations in a reversible manner, highlighting a prominent role for functional mechanisms linked to mTOR activation.
See French (https://doi.org/10.1093/brain/awac351) for a scientific commentary on this article.
Introduction
Tumour-associated seizures (TAS) are the most common presenting symptom in patients with diffusely infiltrating gliomas.1 Such events result from glioma-driven changes to neurons in the glioma microenvironment, including alterations in neuronal number,2–4 neurotransmitter concentration5,6 and ion channel expression.2,7 These changes disrupt the excitatory-inhibitory balance within the surrounding cortex, causing hyperexcitability and facilitating the development of epileptiform activity. Such aberrant neuronal firing can upregulate oncogenic pathways through both synaptic8,9 and non-synaptic10,11 mechanisms, highlighting the importance of studying this process as a target to inhibit TAS and potentially slow tumour progression.
We and others have shown that TAS arise from the cortex at the margins of glioma.4,12,13 This cortex contains glioma cells intermingled with non-neoplastic brain cells,14 which include pyramidal neurons8,9,15 and parvalbumin-expressing (PV) inhibitory interneurons.3,7,15 While previous studies have detailed how both excitatory4,6,16,17 and inhibitory3,4 neurons may be involved in TAS, few have examined the interplay between these two cell classes.2,7 A comprehensive understanding of how excitatory and inhibitory neuronal populations contribute to seizure-like events (SLE) observed in TAS requires simultaneous observation and analysis of each population across an extended spatial region. This can be achieved with single unit analysis18–20 and cell-type-specific genetically encoded calcium indicators.21 Implementing this methodology in a model of TAS also allows for a greater understanding of how targeted drug therapy could affect these populations.
Herein, we combined our previously described methods for high density microelectrode array (MEA) recordings12 and single unit analysis during ictal events18 with simultaneous wide-field optical imaging of pyramidal neurons using an ex vivo acute slice model of diffusely infiltrating glioma in Thy1-GCaMP6f mice.13 This approach allowed us to correlate local field potentials (LFP), multiunit activity (MUA) and single unit activity with observations of excitatory activity captured through GCaMP imaging. We showed that increased excitability of pyramidal neurons in tumour-infiltrated cortex coincided with dysfunctional inhibitory interneuron behaviour. We pharmacologically perturbed this model by inhibiting mammalian target of rapamycin (mTOR), which has been implicated in both gliomagenesis10,11,22 and epileptogenesis.23–25 Doing so enabled us to investigate the effects of mTOR inhibition on the crosstalk between excitatory and inhibitory neuronal populations over an extended spatial area of glioma-infiltrated brain.
Materials and methods
Murine glioma model
All animal handling and experimentation were performed with the approval of the Columbia University Institutional Animal Care and Use Committee. As previously described, PDGFA+/TP53−/− diffusely infiltrating glioma were generated by injecting PDGFA-IRES-Cre expressing retrovirus into the subcortical white matter of transgenic C57BL/6 mice that possessed floxed p53, stop-flox RPL22HA and stop-flox mCherry-luciferase.13 The resulting retrovirus-induced tumours show the histological features of diffusely infiltrating gliomas.13 PDGFA+/TP53−/− glioma cells were then isolated from these retrovirally induced tumours and sustained in culture.26 These cells were injected into the subcortical white matter of adult (∼2 months old) Thy1-GCaMP6f-positive mice of both sexes (stereotaxic coordinates relative to the bregma: 2.0 mm lateral, 2.0 mm rostral and 1.5 mm deep).13 The mice readily formed diffusely infiltrating tumours within 2–3 weeks and developed spontaneous behavioural seizures as early as 3-weeks post-injection.13
Slice preparation
Acute brain slices were prepared from tumour-bearing mice (n = 12) sacrificed 25 to 30 days post-injection; slices were also acquired from non-injected age-matched controls (n = 3). Coronal slices (400-μm thick) were obtained using a Leica VT1000S vibratome (Nussloch) while in ice-cold solution (in mM: 210 sucrose, 10 glucose, 2.5 KCl, 0.5 CaCl2, 7 MgCl2, 26 NaHCO3, 1.25 NaH2PO4). Four slices were obtained from each mouse. The slices were incubated at 35°C for 18 min and then transferred to 22°C for a minimum of 42 min prior to recordings. Contents of the incubation solution are listed as follows (in mM) 1.5 MgCl2, 125 NaCl, 26 NaHCO3, 10 dextrose, 2.5 KCl, 2 CaCl2 and 1.25 NaH2PO4.
AZD8055 treatment
Half of the tumour-bearing mice (n = 6) underwent a single oral gavage with 100 mg/kg of AZD8055 (AZD), a competitive inhibitor of the kinase domains in mammalian target of rapamycin complex 1 (mTORC1) and mammalian target of rapamycin complex 2 (mTORC2), 4–5 h before euthanasia. This time window was selected as we have shown that oral administration of AZD decreases neuronal mTOR activation in vivo within 6 h of administration, as evidenced by decreased phosphorylation of S6 (D. Torres, P.C., unpublished data). The slices obtained from these mice were additionally bathed in 30 nM of AZD during their incubation period before recording. The remaining tumour-bearing mice (n = 6) and non-injected age-matched controls remained untreated.
Microelectrode array slice recordings and wide-field calcium imaging
Slices were placed on top of a 4 × 4 mm MEA with 96 (10 × 10 electrode grid, non-recording corners) 1 mm penetrating microelectrodes at an orthogonal interelectrode spacing of 0.4 mm (Blackrock Microsystems, Inc). The electrode array sampled from across the slices, including both cortical and subcortical regions.
Two slices from each mouse underwent an initial 5-min recording in artificial CSF (in mM: 1.5 MgCl2, 125 NaCl, 26 NaHCO3, 10 dextrose, 5 KCl, 2 CaCl2, 1.25 NaH2PO4), followed by a 30-min recording in zero-magnesium solution (zero-Mg2+). This limited our analysis to early SLEs, which better reflect clinical conditions. Signals from the MEA were acquired continuously on a CerePlex Direct acquisition system with a digital preamplifier (Blackrock Microsystems, Inc) at 30 kHz per channel (0.3 Hz−7.5 kHz bandpass), with 16-bit precision and a range of ±8 mV.
The other two slices from each mouse underwent stimulation in artificial CSF with the addition of 50 μM picrotoxin, a GABA-A receptor antagonist. This allowed us to interrogate excitatory responses to stimulation without the presence of an inhibitory restraint. Each of the 96 electrodes were stimulated in ascending order, with odd-numbered electrodes stimulated before even-numbered ones. Stimulus trains consisted of 25 cathodic first symmetrical pulses with phases lasting 100 μs and separated by an interphase delay of 100 μs, delivered at a frequency of 100 Hz using the Cerestim R96 (Blackrock Microsystems Inc). The total duration of each pulse train was 0.25 s. All electrodes were first stimulated at 5 μA, with a spacing of 3 s between each sequential stimulus. After each electrode had delivered this stimulus, the protocol was repeated at 10, 25 and 50 μA.
Imaging was performed under an upright Leica DM LFS microscope using a ×2.5/0.07 numerical aperture Leica objective and an I3 fluorescence filter cube (Leica Microsystems). GCaMP6f signal was excited using a wavelength band of 450 to 490 nm. Time series images were acquired at a frame rate of 50 Hz and resolution of 1024 × 1024 pixels using an Andor Zyla Plus sCMOS 4.2 MP camera (Oxford Instruments).
Patch-clamp electrophysiology
Acute brain slices (220 μm) were harvested from untreated (n = 5) and AZD-treated tumour-bearing mice (n = 5), transferred to a submerged recording chamber and perfused with oxygenated artificial CSF (3 ml/min) at 32°C. Pyramidal neurons were visually identified using Infrared Differential Interference Contrast Microscopy (Leica DM LFS microscope, ×63 water-immersion objective, Leica Microsystems). During perforated patch-clamp recordings, glass patch-clamp pipettes (borosilicate glass, model G150-4; Warner Instruments LLC) with an open-tip resistance of 3–5 MΩ were filled with intracellular solution (in mM: 130 potassium gluconate, 10 KCl, 10 HEPES, 5 EGTA, 0.3 CaCl2, 1 MgCl2, 3 Mg-ATP, 0.3 Na-GTP (pH 7.3 with KOH). The patch-clamp glass pipette was backfilled with gramicidin (50 μg/ml) dissolved in extracellular solution. Membrane current and voltage signals were recorded and filtered at 3 kHz with a MultiClamp 700A amplifier (Axon Instruments) and digitized at 10 kHz (sampling interval 100 ms) using a Digidata 1322A data acquisition system (Axon Instruments).
GABA-A receptor-mediated currents were induced by the GABA-A receptor agonist muscimol (100 μM, Tocris) while blocking voltage-gated sodium (TTX 1 μM, Tocris), AMPA (NBQX 10 μM, Tocris), and N-methyl-D-aspartic acid (NMDA) (D-APV 25 μM, Tocris) channels. Muscimol was dissolved in the extracellular solution and focally applied by pressurized ejection (3 psi) from a glass pipette using a Pressure System IIe (Toohey Company) and a motorized micromanipulator and controller (MP-225, Sutter Instruments Company). GABA responses were elicited in voltage clamp mode at different holding potentials (−90 to 10 mV). The data was extracted using Clampfit v.11.1 software (Molecular Devices, USA) and the GABA reversal potential (EGABA) was determined using a linear regression to fit the current–voltage relationship.
Histological analysis, antibodies and microscopy
After recording, slices were removed from the array and fixed with 4% paraformaldehyde (PFA) overnight at 4°C. Forty-micrometre sections were cut with a vibratome. For immunohistochemical analysis, free-floating sections were blocked in 10% goat serum (30 min, room temperature) and then incubated with appropriate primary antibodies (overnight at 4°C). Secondary antibodies were applied for 1 h at room temperature. DAPI (5 μg; D9542, Sigma-Aldrich) was added to secondary antibodies for nuclei visualization. Blocking serum, primary antibodies and secondary antibodies were applied in 0.3% Triton X-100 in PBS. Sections for fluorescent microscopy were mounted on slides in Vectashield (#H-1200, Vector Laboratories).
The primary antibodies used were anti-hemagglutinin, a marker of tumour cells (rat monoclonal, catalogue #11867423001, Millipore-Sigma, RRID: AB_390918), anti-parvalbumin (mouse monoclonal, 1:500, #P3088, Sigma-Aldrich, RRID: AB_477329), and anti-phospho-S6 ribosomal protein (pS6), a marker of mTOR activation (rabbit monoclonal, 1:250, #2215, Cell Signaling Technology, RRID: AB_331682). The secondary antibodies used were Alexa Fluor 594 (goat anti-rabbit, 1:300, catalogue #A32740, Invitrogen, RRID: AB_2762824 and goat anti-mouse, 1:300, #A11032, RRID: AB_2534091) and Alexa Fluor 647 (goat anti-rat, 1:300, #A32733, Invitrogen, RRID: AB_2633282 and goat anti-rabbit, 1:300, #A21245, RRID: AB_2535813). Thy1-positive neurons were identified using their endogenous GCaMP fluorescence.
Z-series confocal images were obtained using a spinning disc confocal microscope (Eclipse Ti, Nikon Instruments) under a ×20 air objective (N/A 0.75) (Nikon Instruments). The imaged area was 639 × 639 μm, with a resolution of 1024 × 1024 pixels. Z-stacks were obtained with 7 μm incremental steps. Serial images were obtained with 10% overlap and then stitched together (NIS Elements, Nikon Instruments) to obtain an image of the whole slice. Z-series were then stacked together to generate the max-intensity projection. All confocal images shown were projected views. These images were exported and processed in Fiji27 and MATLAB (MathWorks, Natick, MA). Levels of pS6 fluorescence were calculated using the optical density of the slice in Fiji.27
Quantification of the numbers of PV immunoreactive and GCaMP-positive neurons was performed on images obtained using a Nikon A1R MP confocal microscope from sections double stained for PV and pS6. Images used for quantification were projections from stacks of six adjacent optical sections (observed area 606 × 606 μm, 1024 × 1024 resolution) captured at a distance of 0.3 μm from each other. Images were transferred to Fiji and numbers of PV-positive/pS6-positive and GCaMP-positive/pS6-positive neurons were quantified. Given the diffusely infiltrative nature of the model, all neurons from tumour-bearing slices were considered to be within glioma-infiltrated cortex. Statistical analyses were performed using GraphPad Prism software v.8.4.3 for Windows (GraphPad Software, San Diego, CA, USA).
Data processing and statistical analysis
Local field potential and multiunit activity
For initial analyses, the raw MEA signals were symmetrically bandpass filtered into two frequency bands: LFP (2–50 Hz, 512th order, window-based FIR1 filter in MATLAB) and MUA (500 Hz–5 kHz, 512th order, window-based FIR1 filter in MATLAB). Both filtered data streams were visually reviewed to exclude channels and time periods with excessive artefacts.
Single unit discrimination
For single unit analyses, the MEA signals were symmetrically filtered between 300 Hz and 5 kHz to accommodate potential waveform changes during epileptiform activity (1024th order window-based FIR filter). Extracellular action potential waveforms were detected from this filtered signal using a threshold crossing method.28 Putative single unit spikes were identified as voltage peaks greater than 4.5σ, where σ = median(|x|/0.6745), and x is the filtered signal from that channel. Matrices of waveforms from each channel were created from 0.6 ms prior to 1 ms post each detection, and principal component based semi-automatic cluster cutting was performed using a modified version of the ‘UltraMegaSort2000’ MATLAB toolbox29,30 and the ‘SplitMerge’ graphical interface.18 Clusters that satisfied the following criteria were accepted: (i) clean separation from all other clusters in the Fisher’s linear discriminant in principal component space; (ii) less than 1% contamination of the 2 ms absolute refractory period; (iii) no clear outliers based on the anticipated chi-squared distribution of Mahalanobis distances; and (iv) less than 1% of estimated false negatives as estimated by the amount of a Gaussian fit to the detected voltages fell below the threshold for detection.29
Subclassification of regular- and fast-spiking cells
Single units were subclassified into fast-spiking (FS) cells and regular-spiking (RS) cells based on the unit’s mean waveshape (trough-to-peak duration and spike half-width) from the original, unfiltered signal. Waveform duration has been shown to be shorter in FS cells.31,32 This is a widely used technique, which provides clean separation between FS and RS cell populations. A bimodal distribution was evident in the trough-to-peak data, and a Gaussian mixture model was fitted to find the intersection point between the two components. Each unit’s autocorrelation was obtained using its individual spike timing, and the average autocorrelation for each subpopulation was plotted (Supplementary Fig. 1). Subclassified identities were additionally confirmed through correlation between the cell-type firing rates and local calcium imaging fluorescence.
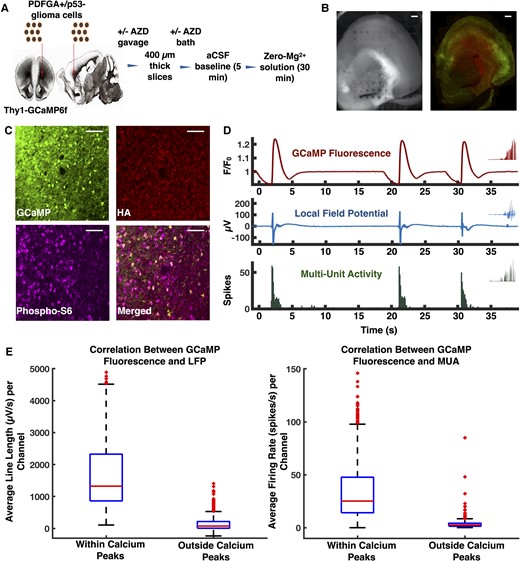
Model of diffusely infiltrating glioma and experimental design. (A) PDGFA+/p53− glioma cells were injected into the subcortical white matter of Thy1-GCaMP6f mice. Coronal slices were obtained 25–30 days post-injection. A subset of mice was treated with a single dose of AZD8055 prior to injection, and slices from these mice were additionally bathed in AZD8055 during incubation. Two slices from each mouse underwent recording in artificial CSF and zero-Mg2+. (B) Orientation of slice on the array in preparation for optical mapping of Thy1-GCaMP fluorescence with histology. (C) Immunofluorescence micrographs demonstrating Thy1-GCaMP positive neurons and HA-positive glioma cells. mTOR signalling was present in both Thy1-GcaMP-positive neurons and HA-positive glioma cells, as indicated by the presence of phosphorylated S6 ribosomal protein. (D) Representative GCaMP fluorescence, LFP, and MUA from the same channel in a tumour-bearing slice. (E) Box plots showing temporal correlation between GCaMP fluorescence with LFP (n = 621, P < 0.01, Mann-Whitney U-test, two-tailed) and MUA (n = 621, P < 0.01, Mann-Whitney U-test, two-tailed). Scale bars = 400 μm (B), 50 μm (C).
Calcium imaging analysis
The average fluorescence within a 140 μm radius of each electrode33 was calculated for each frame of the recording. The average fluorescence in each frame was then normalized to the baseline intensity using a sliding window of 125 frames before and after, channel by channel.
Multimodal recording analysis
Correlation between GCaMP and electrophysiological data
To investigate whether GCaMP fluctuations correlated with changes in electrophysiological data, we identified calcium peaks as those 1% greater than the normalized baseline. The mean LFP line length and MUA firing rate were then calculated within a 1-s window around each peak. The former was obtained by summing the values between each consecutive data-point and dividing by 1 s, while the latter was acquired by dividing the total number of spikes in each window by 1 s. The same analysis was then performed for periods between calcium peaks. Results were pooled across all cohorts. This correlation analysis was restricted to electrodes with overall LFP line lengths and MUA firing rates greater than the mean across the slice.
Slices undergoing recording in zero-Mg2+
Each 30-min recording was divided into three periods of 10 min each to account for the evolving dynamics of activity in zero-Mg2+ solution. Hyperexcitability was then quantified for each period through population-level data, including Thy1-GCaMP6f fluorescence, LFP and MUA. As before, calcium peaks were identified as those 1% greater than the normalized baseline. These were used to calculate average peak amplitude and average number of peaks per channel. Each electrode’s LFP line length and MUA firing rate were additionally calculated, as described previously.
Slices undergoing stimulation in artificial CSF + picrotoxin
The local Thy1-GCaMP response to stimulation was examined for each electrode. Amplitude was evaluated for each response. These values were recorded separately for each level of stimulation at 5, 10, 25 and 50 μA.
Single unit analysis
From all sorted units, the detection rates for RS cells and FS cells were determined for each cohort. The overall firing rate for each unit was determined by dividing their total number of spikes by the length of the recording. The instantaneous firing rate for each unit was also calculated by convolving a Gaussian kernel of 200 ms SD with each unit’s spike timings. Periods of quiescence across the slice were excluded when calculating the average instantaneous firing rate. Population quiescence was defined as periods when the average firing rate across the slice was less than 0.05 spikes per second in the Gaussian convolved firing rates. Pairwise cross-correlograms were constructed for FS cell/RS cell pairs sorted from the same electrode. To account for baseline firing rate differences across slices and experimental conditions the cross-correlograms were normalized both to the total spikes of the FS cell and to the mean firing rate of the RS cell for the given bin-width, such that a resultant value of 1 denoted the expected firing rate of the RS cell at any given time, including quiescent inter-discharge periods.
As previously described, the spike-triggered average (STA) was calculated for each individual unit, with the local Thy1-GCaMP fluorescence as the response.34 This was done for each half of the recording. The max amplitude of the STA from 0 to 200 ms was recorded for each unit across all treatment conditions.
For each FS cell, we obtained the Euclidean distance between its electrode and every other electrode on the array. We then calculated the maxima of the average time-locked GCaMP signal at each electrode within a 400 ms window around the cell’s firing. Across all FS cells, the maxima at each unique distance were averaged together to determine how GCaMP activity varied with distance from FS cell firing. This was done separately for control, untreated tumour and treated tumour cohorts. To differentiate between FS cells recruited to excitatory activity and those contributing to local inhibition, we evaluated the maxima of the average time-locked GCaMP signal at each unique distance for each FS cell. If the signal peaked within 0.4 mm (one electrode) of the FS cell, that cell was classified as recruited to excitatory activity. Otherwise, the cell was classified as contributing to local inhibition. This analysis was confined to the latter half of our recordings. This period was chosen as it was more likely to showcase epileptiform activity, enabling us to characterize the FS cell responses to it.
In vivo electroencephalography of murine glioma
PDGFA+/TP53−/− glioma cells were injected into subcortical white matter of the right hemisphere of C57BL6 mice. EEG electrode implantation of adult male and female mice was performed surgically as recently described35 with minor modifications. Mice were anaesthetized by tribromoethanol injection. Three small burr holes were drilled in the skull (1 mm rostral to the bregma line, bilaterally; 2 mm caudal to the bregma on the left side); one over the cerebellum as a reference. Four teflon-coated silver electron wires soldered onto the pins of a microconnector (Mouser Electronics, 575-501101) were placed between the dura and the skull, and a non-organic dental cap was then applied. The mice were given a postoperative analgesic of carprofen (5 mg/kg subcutaneous Rimadyl) and allowed a 48-h recovery period before recordings were taken. To record EEG signals, mice were connected to flexible cables to allow minimally restricted movements within the cage. Signal (200 samples/s) was acquired on a Quantum 128 amplifier (Natus, Inc.). The three referential traces and synchronous video were collected using Neuroworks software (Natus, Inc.).
Mice underwent EEG and were periodically monitored for 24–48 h video EEG recording sessions between 14–45 days post-injection. For the longitudinal study (Supplemental Fig. 4A), three mice were recorded beginning 14 days post-injection. The last recording day for Mouse 1 and Mouse 3 was 45 days post-injection, and the last recording day for Mouse 2 was 33 days post-injection due to tumour morbidity. To study the effects of AZD administration, three tumour-bearing mice were recorded for 24 h, then administered AZD 100 mg/kg via gavage and subsequently recorded for another 24 h. Time points for drug administration were chosen based on when the animal was displaying epileptiform pathology (Mouse 4: 14 days post-injection, Mouse 5: 39 days post-injection, Mouse 6: 39 days post-injection). Visual inspection of the EEG, as well as quantitative line length analysis using custom MATLAB (MathWorks, Natick, MA) scripts, was performed. For line length analysis, the EEG signal was bandpass filtered to 20–40 Hz using MATLAB zero-phase digital filtering, line length was calculated for each bipolar lead using a sliding window of 1 s and then log-transformed for normality. Best fit lines were computed using data from all three animals with MATLAB’s polyfit for a first-degree polynomial.
Statistical analysis
Unless stated otherwise, all analyses were performed offline using custom scripts and toolboxes written in MATLAB (MathWorks, Natick, MA, USA). Code is available at https://github.com/edmerix. When provided, means were reported ± SEM. Otherwise, the measure of central deviation is stated in the text. All statistical tests for significance were performed using the Mann–Whitney U-test unless otherwise noted, due to the non-Gaussian distributions of data requiring non-parametric testing. For all tests, the level for statistical significance (α) was set to 0.05.
Data availability
The data sets are available from the corresponding author on reasonable request.
Results
GCaMP transients coincide with bursts in local field potential and multiunit activity during epileptiform activity
Wide-field optical imaging and dense MEA recordings were used to characterize the glioma-infiltrated regions of acute ex vivo slices obtained 25–30 days post-injection from a previously described murine model of diffusely infiltrating glioma, in which PDGFA+/p53− glioma cells were injected into Thy1-GCaMP6f mice. These mice expressed the calcium-sensitive green fluorescent protein in excitatory Thy1 positive pyramidal cells, typically found in layers 2, 3 and 5. Coronal slices obtained from these mice first underwent a 5-min recording in artificial CSF followed by a 30-min recording in zero-Mg2+ (Fig. 1A and Supplementary Video 1, available from Figshare: doi:10.6084/m9.figshare.19686381). The recording was limited to this early time period as it best mimicked the glutamatergic environment observed in human glioma.6 To determine whether GCaMP fluctuations correlated with electrophysiological changes, we examined LFP line length and MUA firing rate during GCaMP transients across all slices. At baseline GCaMP activity, the mean LFP line length and MUA firing rate were 147.9 ± 9.2 μV/s and 4.2 ± 0.6 spikes/s, respectively, while during GCaMP transients, these values significantly increased to 5341.1 ± 664.1 μV/s and 36.9 ± 1.7 spikes/s (Fig. 1E). These findings confirmed that in this slice model, GCaMP transients represented population-level excitation, as they coincided both spatially and temporally with large amplitude changes in LFP and bursts of MUA.
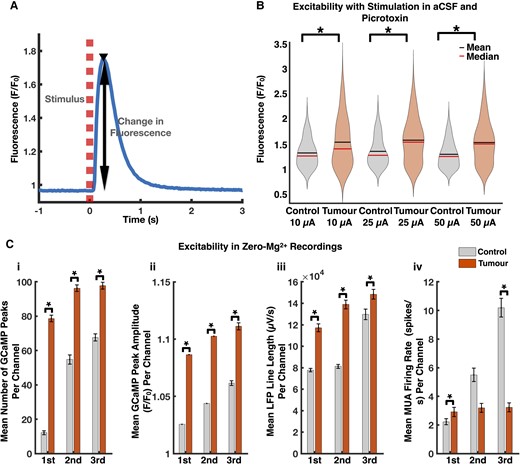
Tumour-bearing slices exhibit increased excitability compared to controls. (A) Representative local Thy1-GCaMP response (solid blue line) to microelectrode stimulation (dashed red line). (B) Violin plots displaying increased excitability in tumour-bearing slices. The mean GCaMP peak amplitude (F/F0) at electrodes which demonstrated a response at 10 μA, 25 μA, and 50 μA was 1.55 ± 0.04, 1.58 ± 0.03, and 1.54 ± 0.03 in tumour-bearing slices and 1.33 ± 0.03, 1.36 ± 0.02, and 1.30 ± 0.02 in controls (10 μA control: n = 79,10 μA tumour: n = 135, 25 μA control: n = 226, 25 μA tumour: n = 274, 50 μA control: n = 255, 50 μA tumour: n = 280, P < 0.01 in each, Mann–Whitney U-test, two-tailed). (C) Tumour-bearing slices were more excitable than controls with respect to mean number of GCaMP peaks per channel (i), mean GCaMP peak amplitude per channel (ii), and mean LFP line length per channel (iii) (control: n = 480, tumour: n = 883, P < 0.01 for each analysis in each period, Mann–Whitney U-test, two-tailed). The MUA firing rates (control: n = 480, tumour: n = 883, P < 0.01 in first period, P = 0.67 in second period, P < 0.01 in third period, Mann–Whitney U-test, two-tailed) (iv) were discordant with these results.
Tumour-bearing slices displayed increased excitability compared to age-matched controls at a population level
In vivo continuous EEG recordings of three tumour-bearing mice in this study demonstrated a progressive increase in the development of spontaneous epileptiform activity, as measured by the mean EEG line length ipsilateral to the tumour-bearing hemisphere (Supplementary Fig. 4). This is consistent with previously published in vivo data from our Thy1-GCaMP6f murine glioma model that showed the development of frequent epileptiform events, which appeared as high amplitude GCaMP fluctuations most prominent at the margins of the tumour.13
By combining wide-field optical imaging with high density MEA recordings, we were able to demonstrate increased excitability in acute ex vivo slices from these tumour-bearing mice. We measured local responses of Thy1-GCaMP pyramidal cells to electrical stimulation in the presence of the GABA-A receptor antagonist picrotoxin (Supplementary Video 2, available from Figshare: doi:10.6084/m9.figshare.19686393) because GABAergic signalling can drive excitability in tumour-bearing slices.2,7 Thus, to evaluate the degree to which Thy1-GCaMP-positive pyramidal cells in tumour-infiltrated cortex are intrinsically more likely to fire, we used picrotoxin to block GABAergic synaptic transmission, thereby facilitating an assessment of GABA-independent excitability. The mean GCaMP peak amplitude (F/F0) within a 140 μm radius of electrodes (see “Materials and methods” section) that demonstrated a response at 10, 25 and 50 μA was 1.55 ± 0.04, 1.58 ± 0.03 and 1.54 ± 0.03 in tumour-bearing slices and 1.33 ± 0.03, 1.36 ± 0.02 and 1.30 ± 0.02 in controls (Fig. 2B).
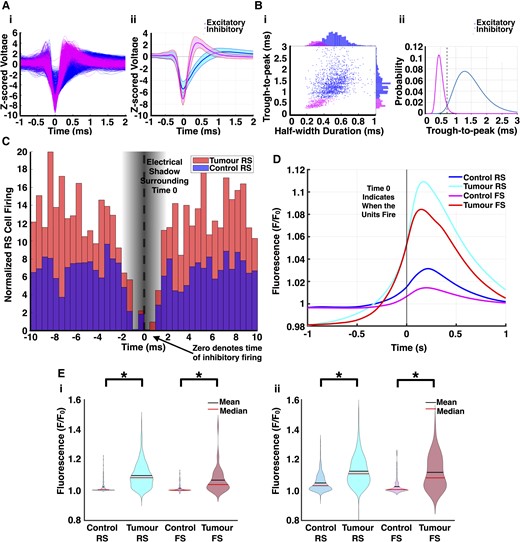
Single unit analysis demonstrates decreased inhibitory detection with dysfunctional inhibitory firing in glioma-infiltrated cortex. (A) Waveforms of all putative RS cells (blue) and FS cells (magenta) (i) after subclassification with average waveform (ii) of both groups. Shading represents SD. (B) Trough-to-peak and half-width maximum were the two parameters chosen to describe spike waveforms. Each cell's average waveform is represented in the 2D space of the two parameters with outliers excluded (i). A bimodal distribution was evident in the trough-to-peak data, and a Gaussian mixture model was fitted to find the intersection point (0.7165 ms, dashed line) between the two components (ii). (C) Average of all cross-correlograms constructed for pairs of RS cells and FS cells sorted from the same channel. Time 0 indicates FS cell firing, while bars represent RS cell firing from −10 to 10 ms. Because of the nature of spike detection, the values of the cross-correlograms from −1.5 to 1.5 ms are thus artificially reduced. While the firing rates of FS cells were decreased in tumour-bearing slices, their activity was more concentrated within periods of increased pyramidal cell firing (control: n = 602 pairs, tumour: n = 92 pairs, P < 0.01, Mann–Whitney U-test, two-tailed). (D) Mean STA GCaMP signals of each cell type in tumour-bearing slices and controls. Time 0 indicates when units fired. (E) Violin plots depicting the maximum amplitude of the STA GCaMP signals from 0 to 200 ms by cell type. In the first half of the recording (i), the median RS cell STA GCaMP signal amplitude (F/F0) was 1.08 in tumour-bearing slices versus 1.01 in controls (control: n = 350, tumour: n = 768, P < 0.01, Mann–Whitney U-test, two-tailed); the median FS cell STA GCaMP signal amplitude (F/F0) was 1.04 in tumour-bearing slices versus 1.00 in controls (control: n = 204, tumour: n = 41, P < 0.01, Mann–Whitney U-test, two-tailed). In the second half of the recording (ii), the median RS cell STA GCaMP signal amplitude (F/F0) was 1.08 in tumour-bearing slices versus 1.03 in controls (control: n = 376, tumour: n = 784, P < 0.01, Mann–Whitney U-test, two-tailed); the median FS cell STA GCaMP signal amplitude (F/F0) was 1.11 in tumour-bearing slices versus 1.00 in controls (control: n = 204, tumour: n = 43, P < 0.01, Mann–Whitney U-test, two-tailed).
Increased excitability in tumour-bearing slices was also displayed in zero-Mg2+ recordings, which were divided into three 10-min periods. The mean number of GCaMP peaks per channel, mean GCaMP peak amplitude (F/F0) per channel, and mean LFP line length per channel were significantly increased in tumour-bearing slices throughout all three periods (Fig. 2C). Since GCaMP and LFP reflect pyramidal cell and local summed synaptic activity,36 respectively, these findings recapitulated increased excitability in tumour-bearing slices. In contrast, the MUA firing rates were decreased in tumour-bearing slices during the second and third periods (Fig. 2C). Initially, these MUA results suggested decreased excitability in tumour-slices. However, considering MUA reflects the collective firing of all nearby neurons, including both excitatory and inhibitory ones,37 we performed single unit analysis to assess the contributions of excitatory and inhibitory neurons.
Single unit analysis demonstrates alterations in excitatory and inhibitory activity in tumour-bearing slices
We performed single unit analysis to explore the behaviour of individual neurons from both excitatory and inhibitory neuronal populations. 877 total units were sorted from zero-Mg2+ recordings in tumour-bearing slices (n = 12) versus 858 in controls (n = 6). By using standard methods, each unit was subclassified as an RS cell, which is representative of putative pyramidal neurons, or an FS cell, which is representative of putative PV inhibitory interneurons, by their action potential waveforms38,39 ('Materials and methods' section). The waveform trough-to-peak and half-width durations exhibited two automatically detected well-defined clusters (Fig. 3A and B). As illustrated by previous groups,40 average spike-time autocorrelograms for sorted units demonstrated successful separation of RS cells—characterized by a tendency to fire in bursts —and FS cells that had longer refractory periods (Supplementary Fig. 1). Correlating the instantaneous firing rate of each unit to the local GCaMP amplitude over time independently confirmed this subclassification across both control and tumour-bearing slices, with a higher mean correlation coefficient for RS cells than for FS cells (0.21 ± 0.01 and 0.08 ± 0.01, respectively; FS: n = 258, RS: n = 1000, P < 0.0001, Mann–Whitney U-test, two-tailed).
Five per cent (n = 44) of units from tumour-bearing slices were subclassified as FS cells, with the remaining 95% (n = 833) subclassified as RS cells. In comparison, 31% (n = 268) of units in controls were subclassified as FS cells, with the remaining 69% (n = 590) subclassified as RS cells. The lower FS cell detection rates seen in tumour-bearing slices was probably due to a combination of factors, including glioma-associated PV interneuron loss3,7 and decreased PV interneuron firing rates.3 While there was no significant difference in excitatory RS cell firing rates between the two cohorts (0.23 ± 0.01 spikes/s in tumour versus 0.26 ± 0.02 spikes/s in control, tumour: n = 822, control: n = 590, P = 0.85, Mann–Whitney U-test, two-tailed), the FS cells fired slower in tumour-bearing slices at 0.26 ± 0.03 spikes/s versus 0.65 ± 0.05 spikes/s in controls (tumour: n = 44, control: n = 268, P < 0.0001, Mann–Whitney U-test, two-tailed). Similarly, an analysis of average instantaneous firing rates demonstrated statistically significant differences between FS cells in tumour-bearing slices and controls (2.17 ± .13 versus 2.72 ± .10 spikes/s, respectively, P = 0.0132, Mann–Whitney U-test). The decreased detection of inhibitory units and inhibitory firing in glioma-infiltrated regions both contributed to the overall decreased multiunit firing seen in tumour-bearing slices.
We constructed normalized pairwise cross-correlograms to characterize the temporal relationship between the firing of RS cells and FS cells sorted from the same electrode (602 pairs in control, 92 pairs in tumour) (Fig. 3C). Cross-correlograms were normalized to the firing rates of both the FS cell and RS cell in each pair, to account for baseline firing differences by cohort ('Materials and methods' section). This allowed us to analyse the response of FS cells to RS cell bursting induced by zero-Mg2+ solution (Fig. 3C). While the firing rates of FS cells were decreased in tumour-bearing slices, their activity was more concentrated within periods of increased RS cell firing (Fig. 3C and Supplementary Fig. 6). In control slices, however, FS cell firing was also maintained between bursts. Spike-triggered averaging of the time-locked local GCaMP signal to single unit firing corroborated the relationship between FS cell firing and excitatory activity in both cohorts (Fig. 3D). The maximum amplitude of the STA GCaMP signal from 0 to 200 ms was recorded for both RS cells and FS cells. These values were significantly higher in tumour-bearing slices for FS cells across the entire recording (Fig. 3E). This highlights how FS cell firing in tumour-bearing slices is temporally associated with increased pyramidal activity.
Elevated intracellular chloride concentration in pyramidal neurons has been shown to result in excitatory responses to inhibitory firing.41 To determine whether similar alterations in pyramidal cells were occurring in the glioma-infiltrated cortex of this model, we measured the resting membrane potential (RMP) and GABA reversal potential (EGABA) of pyramidal neurons using perforated patch-clamp recordings. We found significant increases in both the EGABA (−45.25 mV versus −66.58 mV, P-value = 0.0134, Mann–Whitney U-test) and RMP (−58.19 mV versus −73.74 mV, P-value = 0.00053, Mann–Whitney U-test) of pyramidal neurons in tumour-bearing cortex compared to the non-tumour-bearing contralateral hemisphere (Supplementary Fig. 3). This result from tumour-bearing mice is consistent with previous reports,2,7 where changes in the EGABA and RMP of pyramidal cells in tumour-infiltrated cortex will alter their response to GABAergic input, contributing to increased cortical excitability and reduced inhibitory tone.
mTOR inhibition reduces the excitability of neurons within glioma-infiltrated cortex
The mTOR pathway is of special interest as its upregulation has been demonstrated in both glioma42,43 and epilepsy.44 Moreover, oral administration of AZD (100 mg/kg), a competitive inhibitor of the kinase domains of mTORC1 and mTORC2, decreased epileptiform activity in three tumour-bearing mice undergoing continuous EEG in vivo. All three mice demonstrated evidence of epileptiform activity (seizures in two mice, frequent interictal discharges in one) within the 12 h of recording before AZD administration. In contrast, no seizures or discharges were seen for the 12 h following AZD administration, and all mice showed significant decreases in EEG for the 12 h following AZD administration (Supplementary Fig. 5). These results demonstrate that AZD can acutely attenuate epileptiform events.
We thus used AZD, to characterize the functional consequences of mTOR inhibition on specific neuronal populations within the glioma-infiltrated microenvironment. A single oral gavage of AZD (100 mg/kg) was administered to tumour-bearing mice 4–5 h before euthansia. Slices obtained from these mice were additionally bathed in 30 nM of AZD during their incubation period prior to recording. Immunofluorescence analysis demonstrated that the single dose of AZD significantly reduced levels of phospho-S6 in both GCaMP-positive and PV-positive neurons in the glioma-infiltrated cortex (Fig. 4A–C and Supplementary Fig. 2).
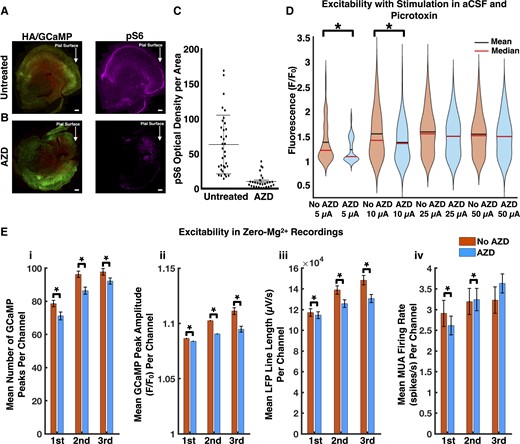
mTOR inhibition decreases excitability within glioma-infiltrated cortex. Low power immunofluorescence micrographs of untreated (A) and treated (B) tumour-bearing slices, demonstrating decreased mTOR signalling in neuronal and neoplastic cells of treated slices. This was evidenced by reduced levels of phosphorylated S6 ribosomal protein (untreated: n = 34, treated: n = 27, P < 0.01, unpaired t-test, two-tailed) (C). (D) Violin plots displaying decreased excitability in treated tumour-bearing slices. The mean amplitudes of the local GCaMP response (F/F0) at 5 μA was 1.37 ± 0.04 in untreated slices versus 1.23 ± 0.03 in treated ones (5 μA untreated tumour: n = 102, 5 μA treated tumour: n = 53, P < 0.05, Mann–Whitney U-test, two-tailed); at 10 μA it was 1.55 ± 0.04 in untreated slices versus 1.37 ± 0.04 in treated ones (10 μA untreated tumour: n = 135, 10 μA treated tumour: n = 116, P < 0.01, Mann–Whitney U-test, two-tailed). (E) Excitability was decreased in treated tumour-bearing slices with respect to mean number of GCaMP peaks per channel (i), mean GCaMP peak amplitude per channel (ii) and mean LFP line length per channel (iii) (untreated tumour: n = 883, treated tumour: n = 916, P < 0.01 for each analysis in each period, Mann–Whitney U-test, two-tailed). The MUA firing rates (untreated tumour: n = 883, treated tumour: n = 916, P < 0.05 in first period, P < 0.01 in second period, P = 0.12 in third period, Mann–Whitney U-test, two-tailed) (iv) were discordant with these results. Scale bars = 400 µm (A), 400 µm (B).
We reassessed excitability of tumour-bearing slices in the setting of mTOR inhibition. In comparison to untreated tumour-bearing slices, direct stimulation of treated slices in the setting of GABAergic antagonism with picrotoxin displayed significantly decreased mean amplitudes of the local GCaMP response at 5 μA (1.37 ± 0.04 versus 1.23 ± 0.03 F/F0) and 10 μA (1.55 ± 0.04 versus 1.37 ± 0.04 F/F0) (Fig. 4D).
Decreased excitability in treated tumour-bearing slices was also demonstrated in zero-Mg2+ recordings (Fig. 4E). The mean number of GCaMP peaks per channel, mean GCaMP peak amplitude (F/F0) per channel, and mean LFP line length (μV/s) per channel were significantly decreased in treated slices throughout all three periods of the recording (Fig. 4E). While these three metrics showed decreased excitability after mTOR inhibition, we were unable to draw similar conclusions from an assessment of the multiunit firing rates in these tumour-bearing slices (Fig. 4E). This called for an evaluation of mTOR inhibition’s effects on individual neuronal populations.
mTOR inhibition reverses tumour-associated alterations in excitatory and inhibitory firing in glioma-infiltrated cortex
Single unit analysis was performed for treated tumour-bearing slices as described above. 794 total units were sorted from treated slices (n = 12), of which 15% (n = 119) were subclassified as FS cells, an increase from the 5% detected in untreated tumour-bearing slices (Fig. 5A). Treated FS cells fired at an average rate of 0.70 ± 0.09 spikes/s, exceeding the 0.26 ± 0.03 spikes/s seen in untreated tumour-bearing slices (Fig. 5B). An analysis of average instantaneous firing rates also demonstrated a significant increase in FS cells in AZD-treated compared to untreated tumour-bearing slices (3.29 ± 0.24 spikes/s versus 2.17 ± 0.13, P = 0.0014, Mann–Whitney U-test). There was no significant difference in RS cell firing rates.
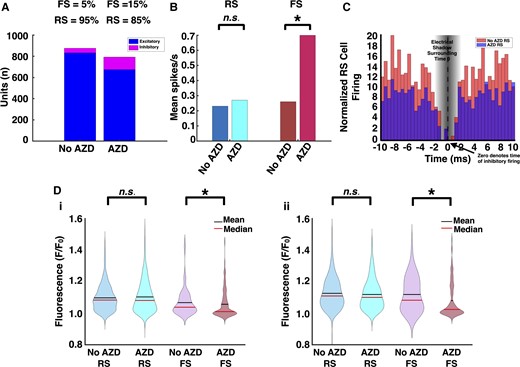
FS cells in tumour-bearing slices demonstrate decreased entrainment to RS cell firing after mTOR inhibition. (A) In treated tumour-bearing slices, 15% of sorted units were subclassified as FS cells versus 5% in untreated slices. (B) FS cells from treated slices fired at 0.70 ± 0.09 spikes/s, as opposed to 0.26 ± 0.03 spikes/s in untreated slices (untreated tumour: n = 44, treated tumour: n = 119, P < 0.01, Mann–Whitney U-test, two-tailed). (C) In comparison to those from untreated tumour-bearing slices, pairwise cross-correlograms from treated ones revealed decreased RS cell firing in temporal relationship to FS cell firing, suggesting greater FS cell activity between SLEs (untreated tumour: n = 92 pairs, treated tumour: n = 199 pairs, P < 0.01, Mann–Whitney U-test, two-tailed). (D) Similarly, spike-triggered averaging of the local GCaMP response to FS cell firing was decreased in treated tumour-bearing slices in the first (untreated tumour: n = 41, treated tumour: n = 117, P < 0.05, Mann–Whitney U-test, two-tailed) (i) and second (untreated tumour: n = 43, treated tumour: n = 118, P < 0.01, Mann–Whitney U-test, two-tailed) (ii) halves of the recording. There was no significant difference for spike-triggered averaging of the local GCaMP responses to RS cell firing.
In comparison to those from untreated tumour-bearing slices, pairwise cross-correlograms (199 pairs) from AZD-treated slices revealed decreased RS cell firing in temporal relationship to FS cell firing (Fig. 5C and Supplementary Fig. 6). Similarly, STAs of the local GCaMP signal to FS cell firing were significantly decreased in AZD-treated tumour-bearing slices (Fig. 5D). As expected, there was no difference between STAs of the local GCaMP signal to RS cell firing. These findings indicated increased FS cell firing between excitatory bursts in treated tumour-bearing slices.
The decreased association between FS cell firing and excitatory bursts in treated tumour-bearing slices was further explored using a perforated patch clamp. We found that similar to controls, both the EGABA (−67.12 mV versus −45.25 mV, P-value = 0.0027, Mann–Whitney U-test) and RMP (−69.85 mV versus −58.19 mV, P-value = 0.0076, Mann–Whitney U-test) were significantly decreased in AZD-treated tumour-bearing slices compared to untreated ones (Supplementary Fig. 3). These findings show how mTOR inhibition potentially alters the response of pyramidal cells in tumour-infiltrated cortex to GABAergic input, contributing to decreased excitability and restored inhibitory tone.
mTOR inhibition restores fast-spiking cell-mediated local inhibition during seizure-like events
Ictal events are characterized by a spatial restraint in which inhibitory barrages from FS cells prevent the propagation of epileptiform activity.45–51 Previous studies have shown that interneurons located outside the region bounded by the ictal wavefront contribute to local inhibition.48 In contrast, interneurons focal to the ictal activity have been implicated in its propagation46 and have been shown to alter their behaviour prior to and during seizures.7,52,53 These interneuron states, however, have yet to be characterized in the setting of TAS. Consequently, we sought to assess how the spatial landscape of local inhibition was impacted by our findings of glioma-induced FS cell dysfunction.
We combined wide-field optical imaging with single unit analysis to characterize the spatial relationship between FS cell firing and propagating GCaMP transients. For each FS cell, we obtained the Euclidean distance between the electrode at which the FS cell firing was detected, and every other electrode on the array. We then calculated the maxima of the average time-locked GCaMP signal at each electrode during a 400 ms window around the cell’s firing. Across all FS cells, the maxima at each unique distance were averaged together to determine how GCaMP activity varied with distance from FS cell firing ('Materials and methods' section).
With this technique, we were able to identify FS cells both proximal to and distant from electrodes with excitatory activity, as measured by GCaMP fluorescence, in our control slices (Fig. 6A). This was visualized as a bimodal distribution when plotting the average maximum fluorescence at each unique distance across all FS cells (Fig. 6A). We interpreted this as evidence of interneurons which have either been recruited to or lie outside of SLEs, with the latter suggesting local inhibition. To deconvolve these two subpopulations, we evaluated the maxima of the average time-locked GCaMP signal at each unique distance for each FS cell. If the signal peaked within 0.4 mm (one electrode) of the FS cell, that cell was classified as recruited to excitatory activity ('Materials and methods' section). Otherwise, the cell was classified as contributing to local inhibition ('Materials and methods' section).
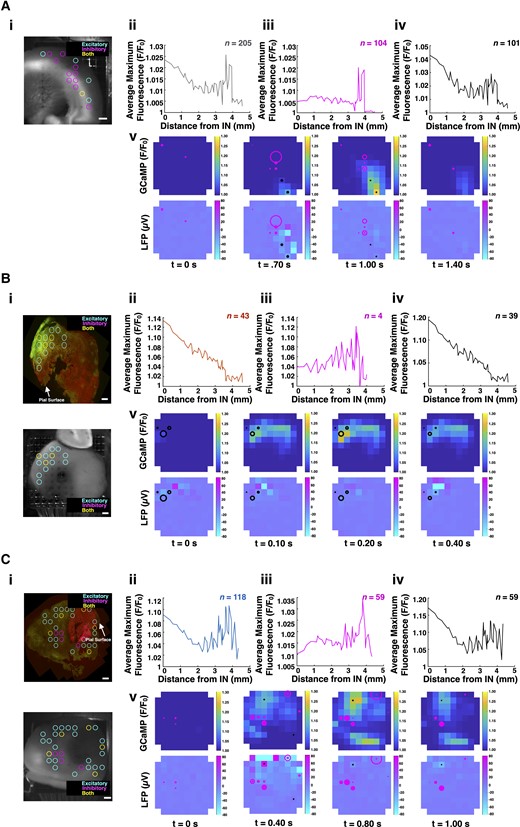
mTOR inhibition restores FS cell-mediated local inhibition during SLEs. (A) In control slices, the time-locked GCaMP signal around FS cell firing suggested intact local inhibition. Areas with increased GCaMP activity were located both proximal to and distal from areas with FS cell firing (ii). Four consecutive time points are shown (v) from Supplementary Video 3 (doi:10.6084/m9.figshare.19686390) during a representative SLE from a control slice. The representative slice shows that maximum GCaMP activity occur at a distance from the FS cells. Moreover, the FS cells appear to inhibit spread. (B) In untreated tumour-bearing slices, the time-locked GCaMP signals with the greatest amplitudes were proximal to electrodes with FS cell firing (ii). As distance from the electrodes with these FS cells increased, the time-locked GCaMP signal amplitude decreased. Four consecutive time points are shown (v) from Supplementary Video 4 (doi:10.6084/m9.figshare.19686387) during a representative SLE from an untreated tumour-bearing slice. The representative slice shows maximum GCaMP activity occurring in the electrodes with FS cell firing. (C) Treated tumour-bearing slices recapitulated the findings seen in controls, suggesting that mTOR inhibition restores the contribution of FS cells to local inhibition during SLEs (ii). Four consecutive time points are shown (v) from Supplementary Video 5 (doi:10.6084/m9.figshare.19686384) during a representative SLE from a treated tumour-bearing slice. The representative slice shows maximum GCaMP activity occurring at a distance from FS cell firing. Across all cohorts, areas of increased GCaMP activity occurred distal to FS cells engaged in local inhibition (iii) and proximal to FS cells recruited to excitatory activity (iv) (A–C). Control and treated tumour-bearing slices possessed a greater percentage of FS cells contributing to local inhibition (50.7% and 50%, respectively) compared to untreated tumour-bearing slices (9.3%). Representative histology (HA-positive glioma cells, red; Thy1-positive neurons, green) shown with pictures of slices placed on the array (i). Scale bars = 400 µm. Heat maps denote GCaMP (top) and LFP (bottom) amplitude. Radii of circles (magenta for FS cells contributing to local inhibition, black for FS cells recruited to excitatory activity) on heatmaps indicate the instantaneous firing rate of the FS cells in that electrode.
In control slices, 104 FS cells (50.7%) were classified as contributing to local inhibition, while 101 (49.3%) were classified as recruited (Fig. 6A). The average firing rate of FS cells contributing to local inhibition was 0.95 ± 0.10 spikes/s, and the average firing rate of FS cells recruited to excitatory activity was 0.66 ± 0.08 spikes/s (local inhibition: n = 104, recruited to excitatory activity: n = 101, P = 0.0017, Mann–Whitney U-test, two-tailed). The observed reduction in the firing rate of the recruited FS cells suggests a breakdown in inhibitory firing. Supplementary Video 3 (available from Figshare: doi:10.6084/m9.figshare.19686390) displays the spread of excitatory activity (GCaMP, LFP) across a representative control slice, with FS cell firing overlays (magenta circles for FS cells contributing to local inhibition and black circles for FS cells recruited to excitatory activity, whose radii are determined by their instantaneous firing rates relative to elsewhere in the recording). The four consecutive time points shown demonstrate the presence of FS cells both recruited to areas of excitatory activity or contributing to local inhibition, illustrating how the observed epileptiform burst did not extend beyond the region containing the latter (Fig. 6A).
In untreated tumour-bearing slices, maximum GCaMP activity was observed more within areas proximal to FS cell firing and less in regions distant to the interneurons. As distance from the FS cells increased, the average maximum fluorescence decreased (Fig. 6B). This suggested that the areas with the most excitatory activity colocalized with areas of FS cell firing, suggesting that the FS cells failed to inhibit and may contribute to excitatory activity in untreated tumour-bearing slices. Thirty-nine FS cells (90.1%) were classified as recruited to excitatory activity, while only four (9.9%) were classified as contributing to local inhibition. There was no significant difference in the firing rates between these two groups. A representative SLE from an untreated tumour-bearing slice can be seen in Supplementary Video 4 (available from Figshare: doi:10.6084/m9.figshare.19686387). The four consecutive time points shown highlight how the epileptiform activity begins in the region with FS cell firing, which we interpreted as indicative of a loss of local inhibition (Fig. 6B).
AZD-treated tumour-bearing slices demonstrated findings similar to those of control slices. Increased levels of GCaMP were observed both proximal to and distant from regions with FS cell firing (Fig. 6C). Fifty-nine FS cells (50.0%) were classified as contributing to local inhibition, which was increased from the 9.9% seen in untreated tumour-bearing slices. The average firing rate of FS cells contributing to local inhibition was 1.03 ± 0.16 spikes/s, and the average firing rate of FS cells recruited to excitatory activity was 0.38 ± 0.08 spikes/s (local inhibition: n = 59, recruited to excitatory activity: n = 59, P < 0.0001, Mann–Whitney U-test, two-tailed). Supplementary Video 5 (available from Figshare: doi:10.6084/m9.figshare.19686384) showcases epileptiform activity in a treated tumour-bearing slice. The four consecutive time points highlight how regions with maximum GCaMP fluorescence are at a distance from FS cells contributing to local inhibition (Fig. 6C). These findings are consistent with a restoration of local inhibition within the glioma-infiltrated cortex following treatment with AZD.
Discussion
We combined optical mapping of Thy1-GCaMP6f fluorescence with single unit analysis from multielectrode extracellular recordings, acquiring both population and individual-level cell-type specific data across an extended region of glioma-infiltrated cortex. While metrics drawn from Thy1-GCaMP fluorescence and LFP served as surrogates for population-level excitability, MUA could not do so because it represented activity from both excitatory and inhibitory neuronal populations. Consequently, we performed single unit analysis, which allowed us to interrogate the spatiotemporal behaviour of both putative pyramidal cells and PV interneurons in a diffusely infiltrating model of glioma. This approach provided an electrophysiologic correlate for the GCaMP fluctuations observed in longitudinal in vivo imaging of this model.13 Our ex vivo acute tumour-bearing slices demonstrated increased excitability4,7,12,17,54 and decreased FS cell firing.3 Additionally, FS cell firing in tumour-bearing slices was less likely to occur between SLEs, as it occurred predominantly within epileptiform bursts. This breakdown in inhibitory firing was associated with deficits in local inhibition. These findings suggest that increased excitability is correlated with inhibitory dysfunction, building on reports of GABAergic disinhibition in TAS.2,7 Previous studies have shown that loss of inhibitory interneurons is a progressive, and presumably irreversible process, leading to disinhibition in the glioma-infiltrated cortex2–4; however, in this study we have shown that mTOR-mediated inhibitory dysfunction within glioma-infiltrated cortex is reversible and this has therapeutic implications for both TAS and glioma progression.
Increased mTOR signalling has been observed in both neoplastic and the non-neoplastic cells of the glioma microenvironment.43,55 mTOR hyperactivation within neurons in particular can lead to dysfunctional axon production, enlarged neuronal soma size, upregulation of immature NMDA receptors25 and decreased GABA-A receptor trafficking.56 All of these changes can contribute to increased excitability. In this study, we perturbed our ex vivo acute slice model of diffusely infiltrating glioma with the mTOR inhibitor AZD, which inhibits the kinase domains of both mTORC1 and mTORC2.57 This treatment reduced excitability, as evidenced by both local stimuli delivered in picrotoxin and recordings performed in zero-Mg2+. These results highlight a role for mTOR signalling in alterations of the excitatory-inhibitory balance at the infiltrative margins of glioma.
Glioma-induced changes to PV interneurons have been implicated in the generation of TAS and probably account for the alterations in FS cells seen in our study. Within the glioma-infiltrated microenvironment, PV interneurons are decreased in number2–4 and fire at slower rates.3 Moreover, glioma-induced changes to chloride regulation in pyramidal neurons result in paradoxical GABAergic excitatory responses.2,7 Using our model, we show that FS cells and their effects on the excitatory-inhibitory landscape in tumour-infiltrated cortex can be modulated through mTOR inhibition. In treated tumour-bearing slices, FS cell firing was increased but less concentrated around pyramidal bursts, suggesting greater FS cell firing between SLEs. Moreover, we found that mTOR inhibition reduces both EGABA and RMP of pyramidal neurons within glioma-infiltrated cortex, potentially attenuating excitatory GABAergic responses. These findings add to the evidence that gliomas induce changes to the excitatory-inhibitory balance,3,7 and show that glioma-induced excitatory-inhibitory imbalance is partially reversible.
Previous ex vivo,45,47,48in vivo49 and human58 studies have demonstrated the contribution of PV interneurons, of which FS cells are representative,38,39 to local inhibition during ictal events. In such instances, PV interneurons rapidly respond to excitatory firing and restrain spatial propagation.45–50 Functional impairment of these interneurons leads to collapse of local inhibition and facilitates seizure spread.47 Herein, we combined single unit analysis with cell-type-specific GCaMP imaging to characterize local inhibition in acute ex vivo slices. This allowed us to spatially investigate whether putative PV interneurons were contributing to inhibition or recruited to ongoing SLEs. Both states were seen in control slices, where increased GCaMP fluorescence was observed distal to some FS cells and proximal to others. In tumour-bearing slices, increased GCaMP fluorescence was predominantly found, on average, only proximal to FS cells. We attributed this to a glioma-induced breakdown in local inhibition. Tumour-bearing slices treated with AZD, however, demonstrated findings similar to that of controls. This suggests that mTOR inhibition can restore FS cell-mediated local inhibition. These findings may have implications for the clinical course of patients with diffusely infiltrating glioma. Recent reports have shown that aberrant neuronal activity can lead to glioma proliferation through various mechanisms.4,8–10,13,15 Thus, mTOR-mediated restoration of local inhibition could potentially reduce the spread of such aberrant firing and in turn decrease tumour progression. Future studies incorporating direct imaging of PV interneurons, and determining the effects of AZD on glioma progression, are warranted.
In conclusion, we have described the spatiotemporal behaviour of individual neuronal populations in an acute ex vivo model of diffusely infiltrating glioma. By doing so, we have demonstrated alterations in the excitatory-inhibitory landscape of the glioma-infiltrated cortex, including increased excitability, a reduction in FS cell between SLEs and a loss of local inhibition. These changes were partially reversed with a single dose of AZD, suggesting that functional mechanisms linked to mTOR activation are prominently involved. Our findings have implications for both seizure susceptibility and glioma progression, warranting further analysis of mTOR’s role in TAS.
Acknowledgements
Image processing and analysis for this work was performed in the Confocal and Specialized Microscopy Shared Resource of the Herbert Irving Comprehensive Cancer Center at Columbia University, supported by NIH grant no. P30 CA013696 (National Cancer Institute). We would like to thank Sabrina Petri for her help with the in vivo mouse EEG recordings. Additionally, we are grateful to other members of the Bartoli Brain Tumour and Schevon Laboratory for their useful comments.
Funding
Research reported in this manuscript was supported by the Citizens United for Research in Epilepsy (CURE) Prevention of Acquired Epilepsies Award, Neurosurgery Research and Education Foundation (NREF) Young Clinician Investigator Award, Schaefer Scholar Award, Columbia VP&S Dean’s Research Grant, the American Epilepsy Society (AES) Seed Grant, and National Institute of the Neurological Disorders and Stroke (NINDS) of the National Institute of Health under award numbers R01 NS084142, R03 NS090151, R03 NS103125 and T32 NS07153.
Competing interests
The authors report no competing interests.
Supplementary material
Supplementary material is available at Brain online.
References
Abbreviations
- FS
fast spiking
- LFP
local field potential
- MEA
microelectrode array
- mTOR
mammalian target of Rapamycin
- MUA
multiunit activity
- PV
parvalbumin
- RS
regular spiking
- SLE
seizure-like events
- STA
spike-triggered average
- TAS
tumour-associated seizures
Author notes
Brian J. A. Gill, Farhan A. Khan, Alexander R. Goldberg, Edward M. Merricks, Guy M. McKhann, Peter Canoll and Catherine A. Schevon contributed equally to this work.

