


Abstract
Tauopathy is a hallmark pathology of Alzheimer’s disease with a strong relationship with cognitive impairment. As such, understanding tau may be a key to clinical interventions. In vivo tauopathy has been measured using cerebrospinal fluid assays, but these do not provide information about where pathology is in the brain. The introduction of PET ligands that bind to paired helical filaments provides the ability to measure the amount and distribution of tau pathology. The heritability of the age of dementia onset tied to the specific mutations found in autosomal dominant Alzheimer’s disease families provides an elegant model to study the spread of tau across the course of the disease as well as the cross-modal relationship between tau and other biomarkers. To better understand the pathobiology of Alzheimer’s disease we measured levels of tau PET binding in individuals with dominantly inherited Alzheimer’s disease using data from the Dominantly Inherited Alzheimer Network (DIAN). We examined cross-sectional measures of amyloid-β, tau, glucose metabolism, and grey matter degeneration in 15 cognitively normal mutation non-carriers, 20 asymptomatic carriers, and 15 symptomatic mutation carriers. Linear models examined the association of pathology with group, estimated years to symptom onset, as well as cross-modal relationships. For comparison, tau PET was acquired on 17 older adults with sporadic, late onset Alzheimer disease. Tau PET binding was starkly elevated in symptomatic DIAN individuals throughout the cortex. The brain areas demonstrating elevated tau PET binding overlapped with those seen in sporadic Alzheimer’s disease, but with a greater cortical involvement and greater levels of binding despite similar cognitive impairment. Tau PET binding was elevated in the temporal lobe, but the most prominent loci of pathology were in the precuneus and lateral parietal regions. Symptomatic mutation carriers also demonstrated elevated tau PET binding in the basal ganglia, consistent with prior work with amyloid-β. The degree of tau tracer binding in symptomatic individuals was correlated to other biomarkers, particularly markers of neurodegeneration. In addition to the differences seen with tau, amyloid-β was increased in both asymptomatic and symptomatic groups relative to non-carriers. Glucose metabolism showed decline primarily in the symptomatic group. MRI indicated structural degeneration in both asymptomatic and symptomatic cohorts. We demonstrate that tau PET binding is elevated in symptomatic individuals with dominantly inherited Alzheimer’s disease. Tau PET uptake was tied to the onset of cognitive dysfunction, and there was a higher amount, and different regional pattern of binding compared to late onset, non-familial Alzheimer’s disease.
Introduction
Alzheimer’s disease is pathologically characterized by the aggregation of extracellular plaques composed of amyloid-β and intracellular neurofibrillary tangles (NFTs) composed of hyperphosphorylated tau protein (Braak and Braak, 1991). Clinicopathological studies indicate that tauopathy is a stronger predictor of cognitive decline than amyloid-β pathology (Arriagada et al., 1992; Bierer et al., 1995). The introduction of PET ligands thought to co-localize with NFTs (Chien et al., 2013; Marquie et al., 2015; Lowe et al., 2016) has provided a new tool to understand the biological changes occurring in Alzheimer’s disease, and may be key to identifying the transition between cognitive normality and impairment.
Tau PET tracer uptake has been shown to be elevated in sporadic, late onset Alzheimer’s disease (LOAD) dementia (Brier et al., 2016; Cho et al., 2016; Gordon et al., 2016; Johnson et al., 2016; Schöll et al., 2016; Schwarz et al., 2016; Day et al., 2017; Ossenkoppele et al., 2018) and modestly elevated in cognitively normal individuals with abnormal amyloid-β pathology (Chhatwal et al., 2016; Gordon et al., 2016; Schöll et al., 2016; Mishra et al., 2017; Schultz et al., 2018). Increased levels of tau PET binding have been associated with glucose hypometabolism (Bischof et al., 2016; Ossenkoppele et al., 2016; Smith et al., 2016), structural atrophy (Wang et al., 2016; LaPoint et al., 2017; Xia et al., 2017; Gordon et al., 2018b), changes in white matter integrity (Jacobs et al., 2018; Strain et al., 2018), CSF markers of total tau and phosphorylated tau (Chhatwal et al., 2016; Gordon et al., 2016; Mattsson et al., 2017), altered functional activity (Jones et al., 2017; Schultz et al., 2017), and worse cognitive performance on neuropsychological tests (Schöll et al., 2016; Mishra et al., 2017; Aschenbrenner et al., 2018; Maass et al., 2018). This ongoing work has begun to elucidate cross-modal relationships in LOAD. Still, it is yet not fully understood how changes in tau PET compare to other Alzheimer’s disease biomarkers measured in parallel in the temporal progression from the asymptomatic to symptomatic phases of the disease (Hardy and Higgins, 1992; Bateman et al., 2012; Jack et al., 2013).
Autosomal dominant Alzheimer’s disease (ADAD) arises from mutations in the presenilin 1 (PSEN1), presenilin 2 (PSEN2), and amyloid precursor protein (APP) genes. ADAD provides a model to study the temporal emergence of biomarkers due to the virtually complete penetrance of the mutations and conservation of symptom onset tied to the specific mutations inherited within families (Moulder et al., 2013; Ryman et al., 2014). The consistent age at symptom onset within families and mutation types allows participants to be staged relative to their expected dementia onset. ADAD is also relatively free of age-related pathologies that may contribute to the secondary accumulation of tau in the brain (Crary et al., 2014). Prior work with ADAD has indicated that markers of amyloid-β plaque formation become abnormal up to 20 years before the expected onset of dementia, while neurodegenerative markers first become abnormal between five and 15 years before predicted cognitive impairment (Bateman et al., 2012; Fleisher et al., 2012, 2015; Benzinger et al., 2013; Araque Caballero et al., 2018; Gordon et al., 2018a; Kinnunen et al., 2018; McDade et al., 2018). Prior neuroimaging studies of neurodegenerative markers in ADAD utilized only non-specific (Jack et al., 2016) markers of neurodegeneration such as structural MRI and flurodeoxyglucose (FDG) PET. While tau PET has been examined in ADAD (Smith et al., 2016; Quiroz et al., 2018), this work had very small samples of impaired individuals (<3), and had limited additional biomarkers. The current work uses neuroimaging to concurrently examine tau, amyloid-β, glucose metabolism, and structural atrophy in a population of ADAD participants. Using multiple biomarkers allows us to elucidate the sequential emergence of multiple Alzheimer’s disease pathologies and the cross-modal relationships between biomarkers. Additionally, we compare the spatial patterns of tau PET binding between ADAD and LOAD.
Materials and methods
Clinical assessment
The presence of impairment was assessed using the Clinical Dementia Rating (CDR) (Morris, 1993). A participant’s estimated years from expected symptom onset (EYO) was calculated based upon their current age relative to the age when the affected parent first had progressive cognitive decline. EYO is calculated identically for mutation carriers and non-carriers. The presence or absence of an ADAD mutation was determined using PCR-based amplification of the appropriate exon followed by Sanger sequencing (Bateman et al., 2012). Clinical evaluators were blind to ADAD participants’ mutation status. In addition to the clinical assessment, participants underwent neuropsychological testing. For each neuropsychological test values were converted to z-scores and then a global z-score composite was calculated for each subject. The neuropsychological tests included the number of items recalled on the immediate and delayed Logical Memory Test from the Wechsler Memory Scale, the seconds taken in completing Trail Making Test Part A and B, the number of items completed in the Wechsler Adult Intelligence Scale (WAIS-R) Digit Symbol test, and the number of animal and vegetables generated in a category fluency test. The Trail Making test z-scores were inverted so that a higher score consistently represented better cognitive performance. Neuropsychological data were missing for one symptomatic individual.
Participants
Individuals were recruited from the local Washington University in St. Louis cohort of the Dominantly Inherited Alzheimer’s Network (DIAN) observational study (n = 22, DIAN-OBS, https://dian.wustl.edu/our-research/observational-study/) and the baseline data (i.e. prior to drug intervention) from participants recruited from nine performance sites participating in the DIAN trials unit (n = 29, DIAN-TU, https://dian.wustl.edu/our-research/clinical-trial/) study. DIAN data can be requested through the DIAN websites. All DIAN OBS and TU participants with tau PET scans collected between March 2015 and September 2016 were considered for inclusion in the study. The institutional review board at Washington University in St. Louis provided supervisory review and human studies approval. Participants or their caregivers provided written informed consent in accordance with their local institutional review boards. There were 16 mutation non-carriers, 20 asymptomatic carriers (CDR = 0), and 15 symptomatic carriers (13 CDR = 0.5, one CDR = 1, one CDR = 3). In the larger cohort, a subset of scans did not pass quality control for tau PET (n = 1), FDG PET (n = 1) or both FDG and amyloid-β imaging (n = 1). One non-carrier participant was amyloid-β positive and was not included in subsequent analyses, reducing the total population of non-carriers to 15. For comparative purposes, tau PET imaging was also examined in a cohort of 17 amyloid-β-positive impaired older adults with LOAD (13 CDR = 0.5, three CDR = 1, one CDR = 2) followed at Washington University in St. Louis. Participants with sporadic Alzheimer’s disease were included if they had a CDR > 0 as well as being positive on a florbetapir amyloid-β PET scan (Table 1). DIAN data were acquired between March 2015 and September 2016. Sporadic Alzheimer’s disease data were acquired between October 2014 and January 2017.
Demographics of autosomal dominant, late onset and sporadic cohorts
| Non-carriers (n = 15) | Asymptomatic carriers (n = 20) | Symptomatic carriers (n = 15) | Late onset AD (n = 17) | Sporadic AD (n = 17) | |
|---|---|---|---|---|---|
| Age | 36.1 (10.1) | 38.9 (10.5) | 49.6 (12.1)a,b | 77.5 (6.8) | 77.5 (6.8) |
| Female (%) | 8 (53) | 11 (55) | 15 (53) | 12 (71) | 12 (71) |
| Family mutation | 1/10/4 | 2/11/7 | 1/13/1 | - | - |
| APP/PSEN1/PSEN2, % | 7/67/27 | 10/55/35 | 7/87/7 | ||
| EYO | −10.9 (9.9) | −10.5 (10.3) | 1.3 (3.7)a,b | - | - |
| MMSE | 29.2 (1.5) | 29.1 (1.3) | 21.9 (6.2)a,b | 24.9 (4.0) | 24.9 (4.0) |
| APOE ɛ4 (%) | 8/15 (53) | 6/20 (30) | 5/15 (33) | 10/17 (59) | 10/17 (59) |
| Global amyloid-β, centiloids | 0.99 (3.46) | 37.82 (45.34) | 106.45 (47.23) | 82.33 (25.72) | 82.33 (25.72) |
| Precuneus PiB SUVR | 1.19 (0.09) | 2.41 (1.44)a | 4.58 (1.48)a,b | - | - |
| Precuneus FDG SUVR | 1.96 (0.13) | 1.95 (0.14) | 1.67 (0.22)a,b | - | - |
| Precuneus thickness, mm | 2.46 (0.11) | 2.35 (0.14) | 2.10 (0.14)a,b | - | - |
| Precuneus tau SUVR | 1.21 (0.18) | 1.31 (0.42) | 4.55 (2.62)a,b | 1.93 (0.78)c | - |
| Entorhinal tau SUVR | 0.93 (0.19) | 1.20 (0.42) | 2.07 (0.66)a,b | 1.70 (0.64) | - |
| Caudate tau SUVR | 1.02 (0.20) | 1.08 (0.20) | 1.57 (0.55)a,b | 1.53 (0.26) | - |
| Putamen tau SUVR | 1.16 (0.21) | 1.23 (0.26) | 1.68 (0.56)a,b | 1.80 (0.29) | - |
| Choroid plexus SUVR | 1.28 (0.39) | 1.36 (0.30) | 1.50 (0.69) | 1.66 (0.82) | - |
| Global AV45 (SUVR) | - | - | - | - | 2.34 (0.48) |
Values represent mean and standard deviations. SUVR values represent partial volume corrected data.
AD = Alzheimer’s disease; MMSE = Mini-Mental State Examination.
aSignificantly different from non-carriers.
bSignificantly different from asymptomatic carriers.
cSignificantly different between symptomatic carriers and late onset Alzheimer’s disease.
MRI
For DIAN and older adult participants, structural MRI was acquired with an MPRAGE sequence (1.1 × 1.1 × 1.2-mm voxels, repetition time = 2300, echo time = 2.95, flip angle 9°). All DIAN data were acquired on 3 T scanners that are required to pass regular quality control assessments. Older adult MRI scans were acquired on a 3 T Siemens Biograph mMR or TIM Trio 3. FreeSurfer 5.3 (Fischl and Dale, 2000; Fischl, 2012) was used to define eight subcortical and 34 cortical regions of interest as well as the choroid plexus using the Desikan atlas (Desikan et al., 2006). The cortical and subcortical labels identified on the MRI were utilized for the regional processing of all PET data. A full list of regions is available in the Supplementary material. For statistical analyses, subcortical volumes were corrected for intracranial volume using a regression approach, and both cortical thickness and volume measures were averaged across hemispheres as there were no a priori laterality predictions.
PET
In the ADAD cohort, amyloid-β imaging was performed using 11C-Pittsburgh compound B (PiB). Data from the 40–70 min post-injection window were converted to regional standardized uptake value ratios (SUVRs) using regions of interest derived from the MRI scans (Su et al., 2013). Metabolic imaging was performed with 18F- FDG and data from the 40–60 min window were converted to SUVRs. Tau imaging was performed using 18F-AV-1451 (flortaucipir). Data from the 80–100 min window were converted to SUVRs. Differences in scanner spatial resolutions were accounted for by applying scanner-specific spatial filters to achieve a common resolution of 8 mm (Joshi et al., 2009). All region of interest PET data were converted to SUVRs using the cerebellar grey as a reference and partial volume corrected using a regional spread function for each region, which when combined form a geometric transfer matrix (Rousset et al., 1998; Su et al., 2015).
In the older adult sporadic Alzheimer’s disease cohort, AV-1451 data were acquired on a Siemens Biograph PET CT and processed identically to the ADAD cohort. Amyloid-β imaging was performed using 18F-AV-45 (florbetapir) acquired on a Biograph mMR scanner and attenuation corrected using a standalone CT. Data from the 50–70 min post-injection window were converted to regional SUVRs relative to the cerebellar cortex and were partial volume corrected. All participants with sporadic Alzheimer’s disease were required to be amyloid-β positive using a mean florbetapir cortical SUVR cut-off of 1.22 (Mishra et al., 2017). The software used to process the PET data are freely available (https://github.com/ysu001/PUP)
Vertex-wise PET visualizations
For visualization purposes voxel-wise maps of PiB-, FDG-, and tau-PET were generated for the non-carrier, asymptomatic carrier, and symptomatic carrier groups as well as for the tau PET data in the LOAD group. Using tools from the fMRIB Software Library (FSL, https://fsl.fmrib.ox.ac.uk), PET data for each participant were aligned to their individual MPRAGE using a rigid body transform and then transformed to a common atlas space (MNI) using a non-linear registration and resampled into a 1 mm isotropic resolution. Group average data were then placed onto the cortical surface using Freesurfer to make vertex-wise maps (Fig. 1).
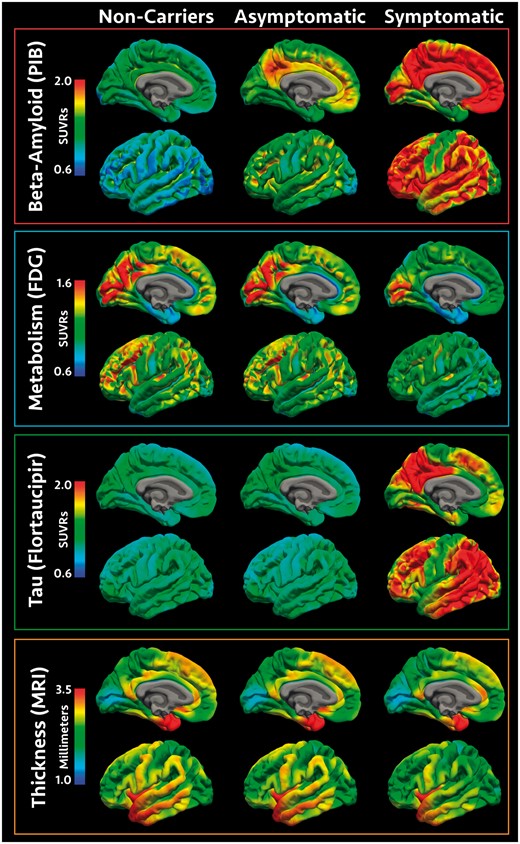
Visualization of pathology across the cohort. Spatial renderings in mutation non-carriers, asymptomatic mutation carriers, and symptomatic mutation carriers for amyloid-β deposition measured with PiB PET, glucose metabolism measured with FDG PET, neurofibrillary tau pathology measured with AV1451, and cortical thickness measured with MRI. PET values represent SUVRs relative to the cerebellar cortex and cortical thickness values are in millimetres. For convenience, data are shown for the inflated left hemisphere.
Statistical analyses
All statistics were run in R version 3.3.2. In ADAD the precuneus shows early and dramatic amyloid-β accrual, hypometabolism, and structural atrophy (Benzinger et al., 2013; Gordon et al., 2018a). As a result, primary analyses focused a priori on comparing neuroimaging measures in the precuneus between familial ADAD non-carrier, asymptomatic carrier, and symptomatic carrier groups while including a main effect of age as a covariate and a random intercept for specific family mutation (e.g. Asn141Ile) using the R function lmer. The significance of the models was tested using the R program lmerTest Satterthwaite’s degrees of freedom method. For a complete depiction of the data, additional group comparisons were also carried out for all of the remaining regions of interest (Supplementary material). When considering the main effect of group in each region of interest P-values were corrected for multiple comparisons at a false discovery rate of 0.05 using the Benjamini-Hochberg procedure (Benjamini and Hochberg, 1995) implemented in R using the p.adjust package. If a region showed a significant main effect of group, pairwise comparisons were then conducted between mutation non-carriers, asymptomatic mutation carriers and symptomatic mutation carriers to determine group differences. As an alternative to region of interest analyses, voxel-wise analyses of the PET data and vertex-wise analyses of MRI data are presented in the Supplementary material.
As it has previously been shown to be the most sensitive region to pathology in ADAD (Benzinger et al., 2013; Gordon et al., 2018a) analyses focus on the precuneus. To assess the influence of EYO, for each modality, data from the precuneus were examined using a linear regression with EYO modelled as a cubic spline (Gordon et al., 2018a) looking at the main effects of EYO, mutation status (carrier or non-carrier), the interaction between EYO and mutation status, and a random intercept for specific family mutation (e.g. Asn141Ile). One individual had an EYO >10 and was not used for model fitting. Due to the limited sample sizes, these results are presented for qualitative interpretation, while main statistical inferences are restricted to the comparisons of non-carrier, asymptomatic carrier, and symptomatic carrier groups. As there were no a priori laterality predictions, regional PET and MRI data were averaged across hemispheres for all analyses.
Cross-modal relationships in mutation carriers
Using region of interest data Pearson correlations between precuneus tau, precuneus PiB, precuneus FDG, precuneus cortical thickness, and the cognitive composite were examined. Correlations were calculated in the entire DIAN cohort sample and then separately within each of the three groups.
Comparison between symptomatic ADAD and late onset Alzheimer’s disease
The inferior temporal cortex is the most prominent area of tau PET signal in late onset Alzheimer’s disease (Brier et al., 2016; Cho et al., 2016; Gordon et al., 2016; Johnson et al., 2016; Day et al., 2017), while the precuneus is the most prominent neuroimaging locus in ADAD (Benzinger et al., 2013; Gordon et al., 2018a). Linear regressions were used to compare tau PET binding in the inferior temporal cortex, precuneus, and the ratio of the precuneus to the inferior temporal cortex between symptomatic carriers and LOAD controlling for Mini-Mental State Examination (MMSE) and gender.
Data availability
Data from the DIAN observational study and baseline data from the DIAN TU can be requested through an online submission process (https://dian.wustl.edu/our-research/observational-study/dian-observational-study-investigator-resources/data-request-form/).
Results
Group-wise comparisons within ADAD
Results for the precuneus are presented in Fig. 2 and Table 1. Numeric results for every region of interest are presented in Supplementary Tables 1–4 and cortical results are presented visually in Fig. 3. Precuneus data plotted by EYO are presented in Fig. 4 for visualization. The results from identical analyses using non-partial volume corrected PET data are also presented in the Supplementary material.
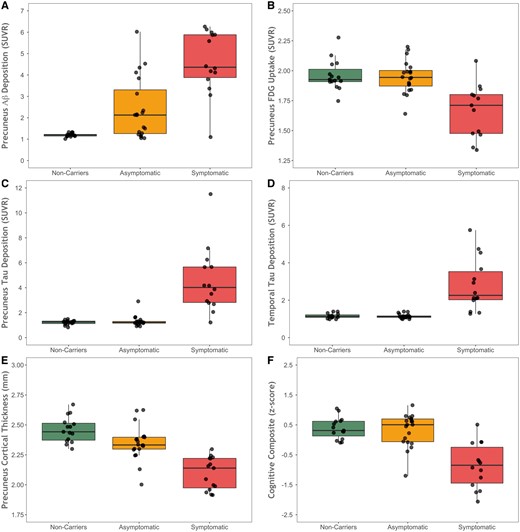
Biomarker values across the three groups. Box and whisker plots showing (A) precuneus PiB PET, (B) precuneus FDG PET, (C) tau PET in the precuneus, (D) tau PET in the inferior temporal lobe, (E) cortical thickness in the precuneus from MRI, and (F) scores on the cognitive composite for mutation non-carriers, asymptomatic mutation carriers, and symptomatic mutation carriers. Aβ = amyloid-β.
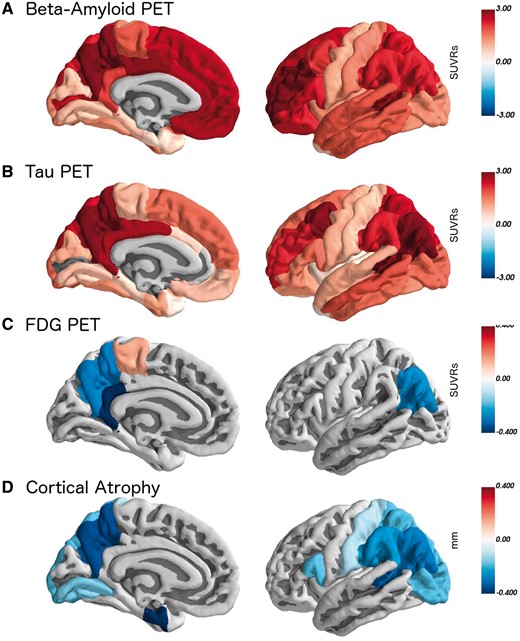
All regions where pathology was significantly different in symptomatic mutation carriers relative to non-carriers. The colour scale represents the difference between groups in the units of that measurement (SUVRs for PET, and mm for thickness). Data were for the averaged left and right regions of interest, but are presented here on the left hemisphere for visualization.
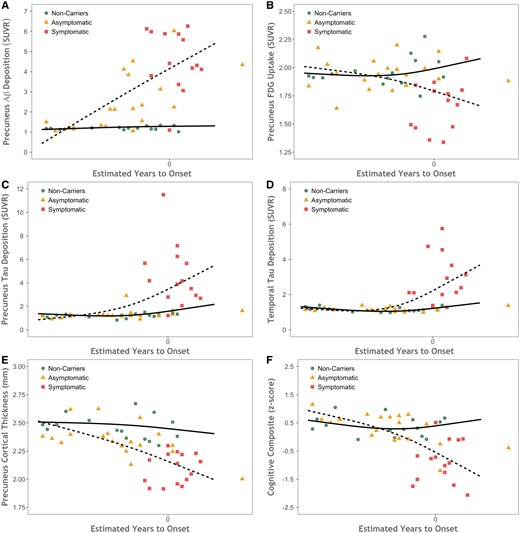
Scatter plots showing biomarker values as a function of disease severity. Biomarkers plotted by estimated years to symptom onset (EYO) for mutation non-carriers (green circles), asymptomatic carriers (orange triangles), and symptomatic carriers (red squares) for (A) precuneus PiB PET, (B) FDG PET, (C) cortical thickness from MRI, and (D) tau PET. The dashed line shows the model fit for mutation carriers and the solid line is for non-carriers. Aβ = amyloid-β.
When examining precuneus tau PET binding there was a main effect of group [F(2,28.3) = 44.51, P < 0.0001]. There was no significant difference between non-carrier and asymptomatic carriers group (SUVRs 1.21 versus 1.31, t = −0.09, P = 0.93) but symptomatic carriers did show increased binding relative to non-carrier (SUVRs 4.55 versus 1.21, t = 8.37 P < 0.0001) and asymptomatic carrier (SUVRs 4.55 versus 1.31, t = 9.02 P < 0.0001) groups. When examining precuneus PiB binding there was a main effect of group [F(2,40.1 = 18.92, P < 0.0001]. The asymptomatic carrier group had greater PiB binding than non-carriers (SUVRs 2.41 versus 1.19, t = 2.89, P = 0.0064), while symptomatic carrier participants had elevated PiB levels relative to both non-carrier (SUVRs 4.58 versus 1.19, t = 6.15 P < 0.0001) and asymptomatic carrier (SUVRs 4.58 versus 2.41, t = 4.22 P = 0.0001) groups.
When examining precuneus glucose utilization there was a main effect of group [F(2,43.1) = 10.52, P = 0.004]. There was no significant difference between the non-carrier and asymptomatic carrier groups (SUVRs 1.96 versus 1.95, t = −0.03, P = 0.97) but symptomatic carriers did show significant hypometabolism relative to non-carriers (SUVRs 1.67 versus 1.96, t = −4.04 P = 0.0002) and asymptomatic carriers (SUVRs 1.67 versus 1.95, t = − 4.33 P < 0.0001). When examining precuneus thickness measured with MRI there was a main effect of group [F(2,45.9) = 26.53, P < 0.0001]. There was a significant difference between the non-carrier and asymptomatic carrier groups (2.46 and 2.35 mm, t = −2.82, P = 0.007), and symptomatic carriers showed significant thickness reductions relative to non-carriers (2.10 versus 2.46 mm, t = −7.22 P < 0.0001) and asymptomatic carriers (2.10 versus 2.35 mm, t = −5.35 P < 0.0001).
Cross-modal relationships in the precuneus
Brain areas in symptomatic carriers with elevated tau PET spatially overlap the other biomarkers, particularly glucose hypometabolism and cortical thinning (Fig. 3). The relationships in the precuneus between tau PET and the other neuroimaging markers are presented in Fig. 5. For the entire sample there was a significant correlation between precuneus tau precuneus PiB (r = 0.73, P < 0.0001), precuneus FDG (r = −0.63, P = 0.0019), precuneus cortical thickness (r = −0.69, P < 0.0001), and the cognitive composite (r = −0.65, P = 0.00000056). In the non-carriers cohort alone, the associations with tau were non-significant for PiB (r = 0.17, P = 0.54), FDG (r = 0.41, P = 0.13), cortical thickness (r = 0.09, P = 0.74), and the cognitive composite (r = 0.92, P = 0.74). In the asymptomatic carriers cohort the association of tau with precuneus PiB was significant (r = 0.50, P = 0.02), but was not significantly related with precuneus FDG (r = −0.26, P = 0.26), precuneus cortical thickness (r = −0.27, P = 0.25), or the cognitive composite (r = −0.39, P = 0.09). In the symptomatic carriers cohort levels of tau PET binding were significantly correlated with PiB (r = 0.71, P = 0.006), FDG (r = −0.64, P = 0.02), and cortical thickness (r = −0.75, P = 0.002) but not the cognitive composite (r = −0.38, P = 0.21).
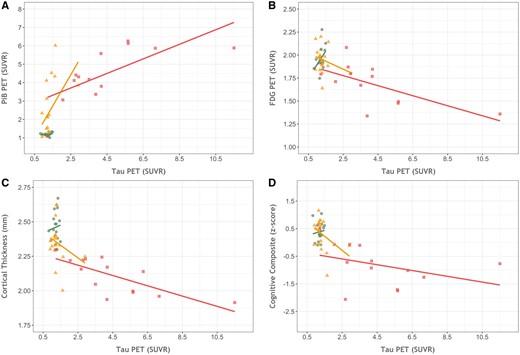
Cross-modal relationships between biomarkers. The relationship between precuneus tau PET binding in the precuneus and (A) precuneus PiB binding, (B) precuneus FDG uptake, and (C) precuneus cortical thickness and the (D) cognitive composite for mutation non-carriers (green circles), asymptomatic carriers (orange triangles), and symptomatic carriers (red squares).
Comparison with sporadic Alzheimer’s disease
When comparing tau PET between symptomatic carriers versus LOAD the inferior temporal lobe showed similar levels of uptake (mean SUVR 2.82 in symptomatic carriers and 2.50 in LOAD; t = 0.29, P = 0.77), but the symptomatic carriers had significantly higher precuneus SUVRs (mean 4.55 in symptomatic carriers and 1.93 in LOAD; t = 3.64, P = 0.001) and a correspondingly higher precuneus to inferior temporal ratio (1.69 in symptomatic carriers and 0.80 in LOAD, t = 5.06, P = 0.00003). This spatial difference can clearly be seen in Fig. 6 and comparisons between the two groups across all regions is presented in the Supplementary material.
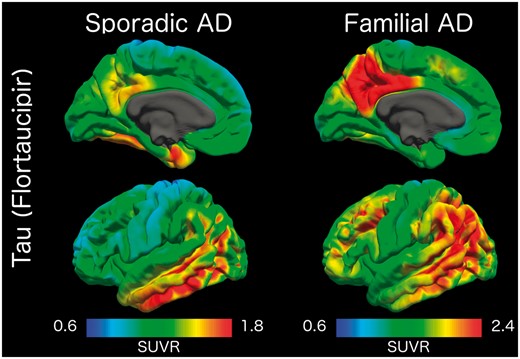
Comparison of tau PET binding in symptomatic mutation carriers (left) and older adults with sporadic Alzheimer’s disease (right) with cognitive impairment. Values represent SUVRs relative to the cerebellar cortex. AD = Alzheimer’s disease.
Discussion
There is increasing evidence for the utility of tau PET imaging to study Alzheimer’s disease. However promising, gaps remain in our understanding of how tau PET binding relates to other modalities and how sensitive it is in the transition from cognitive normality to dementia. ADAD provides a strong model of the sequential emergence of Alzheimer’s disease pathological biomarkers due to the highly conserved age of dementia onset tied to specific familial mutations. We found robust tau PET binding in ADAD individuals that was tied to cognitive status and was strongly related to levels of other Alzheimer’s disease biomarkers.
The level of tau tracer binding in the symptomatic ADAD population was greater than that typically seen in sporadic Alzheimer’s disease (Brier et al., 2016; Cho et al., 2016; Gordon et al., 2016; Johnson et al., 2016; Schöll et al., 2016; Schwarz et al., 2016; Day et al., 2017), particularly in the precuneus and the rest of the neocortex. Early onset Alzheimer’s disease (onset age <65 years) has also shown elevated tau PET relative to late onset Alzheimer’s disease (Cho et al., 2017; Schöll et al., 2017). Early onset Alzheimer’s disease also tends to exhibit more prominent neocortical glucose hypometabolism (Rabinovici et al., 2010) and atrophy (Möller et al., 2013). This suggests that processes leading to neurodegeneration and tauopathy may be more aggressive at a younger age, or that more Alzheimer’s disease pathology is needed to manifest the same severity of clinical symptoms. A similar pattern may be expected in ADAD, as it typically manifests at a younger age than early onset sporadic Alzheimer’s disease. In support of the neuroimaging data, tau pathology is abundant in ADAD brains at autopsy (Fig. 7) and generally greater neuropathological burdens of beta-amyloidosis and tauopathy are seen in ADAD in comparison with late onset Alzheimer’s disease (Shepherd et al., 2009; Ringman et al., 2016). Tauopathy, as measured by the area fraction of tau, is made of up of three lesions, NFTs, neuritic plaques, and neuropil threads. The increased PET-tau signal seen in ADAD may reflect increases in all three lesions, not just neurofibrillary tangle burden. Future autoradiography work in ADAD should examine how tau PET tracers bind to the different markers of tauopathy.
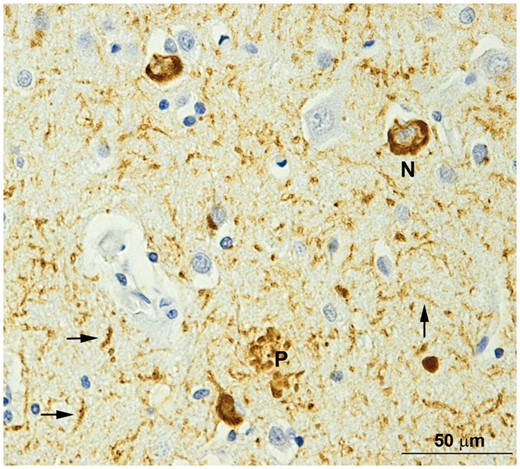
Tauopathy in the frontal lobe of a DIAN participant. N = neurofibrillary tangle; P = a neuritic plaque; arrows = neuropil threads. Phosphorylated tau (PHF1) immunohistochemistry. Scale bar = 50 mm.
In the current cohort tau PET binding was not significantly elevated in asymptomatic or preclinical individuals, counter to what has been shown in sporadic Alzheimer’s disease (Chhatwal et al., 2016; Gordon et al., 2016; Schöll et al., 2016; Mishra et al., 2017), although continuous levels of tau and amyloid-β PET were modestly related in asymptomatic individuals (r = 0.50, P = 0.02). With advancing age, tauopathy may be present in the medial temporal lobe as an Alzheimer’s disease-independent process. As a result, tau pathology in the temporal lobes may be elevated in older cohorts without immediate associated cognitive impairment, an entity called primary age-related tauopathy (PART) (Crary et al., 2014). In younger cohorts, tau PET binding likely represents an Alzheimer’s disease-dependent process and may therefore be more strongly tied to impaired cognition. Amyloid-β plaques may also create an environment that facilitates tau aggregations into all three of the major tau-related pathologies (He et al., 2017). Given the greater levels of amyloid-β seen in ADAD, once tau aggregation in the brain begins it may proceed more rapidly and to a greater extent than in late onset Alzheimer’s disease. With more rapid progress, there would be a shorter temporal window where tau can be elevated but where cognition would remain normal. The drastic increase in tau PET binding seen in the symptomatic participants is consistent with this notion. Longitudinal work in LOAD also suggests increases in tau PET uptake are modest during the preclinical phase of the disease, and increase more rapidly in cognitively impaired individuals (Jack et al., 2018). The increase in tau PET signal, and corresponding dementia, seen in both LOAD and ADAD may represent a critical point that is a result of cascading network failure (Jones et al., 2017). Although the causative relationship between tau pathology and impairment is still unknown, the current work indicates that tau PET may have high utility as a prognostic marker in clinical trials.
Prior work using separate cohorts has shown that tau PET binding is in turn associated with worse amyloid-β pathology (Gordon et al., 2016; Mishra et al., 2017), glucose hypometabolism (Bischof et al., 2016; Ossenkoppele et al., 2016; Smith et al., 2016), and structural atrophy (Wang et al., 2016; LaPoint et al., 2017). In a single cohort, we demonstrated that increasing tau PET binding was associated with greater levels of amyloidosis, glucose hypometabolism, and structural atrophy, and that the symptomatic mutation carriers primarily drove this result. Spatially (Fig. 3) we observed good regional correspondence between biomarkers, particularly measures of tauopathy, glucose hypometabolism, and cortical thinning, and all four biomarkers show a distinctly precuneus and lateral parietal focus of pathology. Prior research with LOAD has shown that the most prominent loci are the temporal lobes, although tau PET uptake extends to medial and lateral parietal regions as well (Brier et al., 2016; Cho et al., 2016; Gordon et al., 2016; Johnson et al., 2016; Schöll et al., 2016; Schwarz et al., 2016; Day et al., 2017; Ossenkoppele et al., 2018). Although prior work suggested similar spatial tau PET topologies in sporadic and autosomal forms of Alzheimer’s disease (Quiroz et al., 2018), the current results show the greatest levels of tracer uptake in medial and lateral parietal regions, although values are also significantly elevated in the temporal lobe. This suggests that, although the general brain networks affected by pathology are similar, the regional spatial emphasis within these networks varies slightly between the two forms of the disease. This is consistent with prior work examining multimodal spatial patterns of Alzheimer’s disease biomarkers in both LOAD (La Joie et al., 2012) and ADAD (Benzinger et al., 2013; Gordon et al., 2018a). In terms of tau pathology, the spatial differences may be influenced by age. In sporadic Alzheimer’s disease, primary age-related tau pathology (Crary et al., 2014) in the temporal lobes may interact with emergent Alzheimer’s disease pathophysiology to foster a temporal lobe predominance early in the disease. Without such age-related tau, tauopathy in ADAD would emerge in areas of the brain such as the precuneus that demonstrate the most abnormal amyloid-β pathology.
Results from large populations of ADAD individuals indicate that pathological levels of amyloid-β, glucose metabolism, CSF tau and p-tau, and structural atrophy may be detected in asymptomatic individuals and that these changes accrue at the population level over decades (Bateman et al., 2012; Reiman et al., 2012; Benzinger et al., 2013; Fagan et al., 2014; Gordon et al., 2018a; Kinnunen et al., 2018; McDade et al., 2018). When examining the effect of EYO, the current work finds consistent patterns (Fig. 4) suggesting that amyloid-β, FDG uptake, and cortical thickness measures all become abnormal in asymptomatic individuals, although the effect was non-significant for FDG in this cohort. This is in contrast to tau PET binding, which was increased only in the cognitively impaired individuals. This relatively late manifestation of tau PET suggests at least a partial incongruency with CSF, as prior work with ADAD cohorts has also shown that tau and p-tau become abnormal before dementia onset (Bateman et al., 2012; Fagan et al., 2014). Although CSF and PET measures of tauopathy are associated (Chhatwal et al., 2016; Gordon et al., 2016; Mattsson et al., 2017), the strength of these relationships has been modest. This suggests that, similar to what is seen with amyloid-β (Palmqvist et al., 2016; Vlassenko et al., 2016), CSF measures of tauopathy likely become abnormal prior to PET measures (Mattsson et al., 2017). However, the current results examining EYO are qualitative and are drawn from a modest population of participants. Work with larger ADAD populations is needed to definitively establish the relative order and timing of tau PET deposition compared to FDG, structural MRI, CSF tau and p-tau, as well as how strongly tau PET predicts the onset of cognitive dysfunction.
Prior studies utilizing AV-1451 have consistently reported elevated binding in the basal ganglia (Gordon et al., 2016; Johnson et al., 2016; Lowe et al., 2016; Schöll et al., 2016) in individuals with Alzheimer’s disease pathology as well as older adult controls. In the current work we found low levels of AV-1451 uptake in the non-carrier controls as well as the asymptomatic carriers. These low levels of binding suggest that the high levels of AV-1451 off-target binding seen in older adult cohorts is likely age-related, as has been previously observed within older adult cohorts (Gordon et al., 2016). A more in-depth study using a population of controls that span the age spectrum is needed to further validate this observation. Within our ADAD cohort we found increased binding for both tau PET and PiB in the basal ganglia in symptomatic carriers relative to non-carriers (Table 1 and Supplementary material). This selective increase cannot be explained by off-target binding and is consistent with previous work with amyloid-β PET noting that pathology in the basal ganglia is a prominent feature of ADAD (Klunk et al., 2007; Villemagne et al., 2009; Fleisher et al., 2012; Benzinger et al., 2013).
The current study provides the first insight into how tau PET, amyloid-β PET, glucose hypometabolism, and structural atrophy are related in ADAD. Tau pathology was markedly elevated in symptomatic, but not presymptomatic individuals. Increased PET binding was seen in temporal and parietal areas typical of sporadic Alzheimer’s disease, but with even greater relative levels of neocortical deposition. When considering multiple biomarkers, we observed a strong relationship between AV-1451 binding in the brain and other markers of Alzheimer’s disease. These results indicate that tauopathy plays a vital role in the pathophysiology of Alzheimer’s disease and that tau PET will and have high utility in clinical trials and is a potential surrogate biomarker of clinical outcomes.
Abbreviations
- ADAD
autosomal dominant Alzheimer’s disease
- CDR
Clinical Dementia Rating
- DIAN
Dominantly Inherited Alzheimer’s Network
- EYO
estimated years to symptom onset
- LOAD
late-onset Alzheimer’s disease
- SUVR
standardized uptake value ratio
Acknowledgements
Most of all we wish to acknowledge the dedication of the participants and their families, without whom these studies would not be possible. We acknowledge the technical expertise of Michael Baxter, Aime Burns-Harring, and Erin Franklin. We additionally thank all of the participating researchers and coordinators in the DIAN and DIAN-TU (https://dian.wustl.edu/our-research/observational-study/dian-observational-study-sites/ and https://dian.wustl.edu/our-research/clinical-trial/study-sites/) who support the studies. DIAN ClinicalTrials.gov identifier, NCT00869817; DIAN-TU trial ClinicalTrials.gov identifier NCT01760005.
Funding
This research was funded by the National Institutes of Health (NIH) K01AG053474, R01AG052550, UFAG 032438, UL1TR000448, P30NS098577, R01EB009352, P50AG05131, U01AG042791, U01AG042791-S1 (FNIH and Accelerating Medicines Partnership), R1AG046179, the German Center for Neurodegenerative Diseases (DZNE), the National Institute for Health Research (NIHR) Queen Square Dementia Biomedical Research Centre, and the Medical Research Council Dementias Platform UK (MR/L023784/1 and MR/009076/1), the Alzheimer’s Association, Eli Lilly and Company, Genentech/Roche, Avid Radiopharmaceuticals, Cogstate, Bracket, GHR Foundation, and an anonymous organization. The DIAN-TU Pharma Consortium has provided funding and support for the DIAN-TU with pre-competitive trial design, but not the trial itself. We acknowledge the support of Fred Simmons and Olga Mohan, the Barnes-Jewish Hospital Foundation, the Charles F. and Joanne Knight Alzheimer’s Research Initiative, the Hope Center for Neurological Disorders, the Mallinckrodt Institute of Radiology, the Paula and Rodger Riney fund, and the Brennan fund. Computations were performed using the facilities of the Washington University Center for High Performance Computing, which were partially funded by NIH grants 1S10RR022984–01A1 and 1S10OD018091–01.
Competing interests
Outside of this manuscript, R.J.B. reports grant/research/clinical trial support: NIH, Alzheimer's Association, BrightFocus Foundation, Rainwater Foundation Tau Consortium, Association for Frontotemporal Degeneration, Cure Alzheimer's Fund, the Tau SILK Consortium (AbbVie, Biogen, and Eli Lilly), Janssen, and an anonymous foundation. R.J.B. reports consulting fees/honoraria from Janssen, Pfizer, Roche, Eisai, and Merck. R.J.B. reports equity ownership interest/advisory board income from C2N Diagnostics. C.H.vD reports consulting fees from Kyowa Kirin, Roche, and Janssen and grants for clinical trials from Biogen, Novartis, Eli Lilly, Merck, Eisai, Janssen, Roche, Genentech, and Toyama. All other authors report no disclosures. M.A.M is an employee of Avid Radiopharmaceuticals. G.K. and S.R. are employees of Roche Pharmaceuticals.

