


Abstract
The most frequently invaded margins on pancreatoduodenectomy specimens for pancreatic ductal adenocarcinoma are vascular margins, particularly the superior mesenteric artery (or mesopancreatic) margin. Due to limited exploration of the radiological aspect of the mesopancreas, the aim of this study was to evaluate mesopancreatic infiltration through imaging of patients with pancreatic ductal adenocarcinoma who underwent pancreatoduodenectomy, to correlate these findings with histopathology and evaluate their impact on survival.
Data for all patients who underwent pancreatoduodenectomy for pancreatic ductal adenocarcinoma from 2015 to 2021 were reviewed, including review of surgical margin histopathology and blinded review of preoperative diagnostic imaging. According to qualitative radiological assessment, the mesopancreas was characterized as having normal fat, fat stranding, or solid infiltration. Survival data were analysed using Cox regression.
A total of 149 patients were included. At baseline imaging, mesopancreatic fat stranding or solid infiltration was present in 47 patients (31.5%) and 20 patients (13.4%) respectively. Median overall survival and disease-free survival were significantly lower with mesopancreatic solid infiltration (17 and 8 months) compared with normal fat (30 and 14 months) and fat stranding (29 and 16 months) (P = 0.017 and 0.028 respectively). In multivariable analysis, pathological tumour size was an independent prognostic factor for overall survival, and tumour location in the uncinate process and pathological tumour size were independent prognostic factors for disease-free survival.
At diagnostic imaging, solid infiltration (but not fat stranding) of the mesopancreas is associated with a poor prognosis for pancreatic ductal adenocarcinoma patients who undergo pancreatoduodenectomy. Pathological tumour size significantly influences the prediction of overall survival, and tumour location in the uncinate process and pathological tumour size significantly influence the prediction of disease-free survival, suggesting further exploration of underlying mechanisms related to retroperitoneal tumoral invasion of vascular margins and the mesopancreas.
Introduction
The main goal of surgery for pancreatic ductal adenocarcinoma (PDAC) is to perform a complete oncological resection with surgical margins free from cancer invasion (R0 resection)1,2. PDACs located in the pancreatic head pose intricate challenges during surgical dissection and resection. During the past decade, the definition of the surgical margin has been re-evaluated, now requiring greater than 1 mm of free margin, even at the level of the mesenteric vessels, which can be challenging due to vessel encasement1,3,4. Pathological reports have been standardized to ensure a more precise and reliable definition of resection status5. The rate of R1 resection reaches 70% in some series, primarily attributable to invasion of vascular margins (superior mesenteric vein (SMV) and/or superior mesenteric artery (SMA) margins). The circumferential resection margin (CRM) is frequently employed to evaluate the resection status after pancreatoduodenectomy (PD), regrouping the medial margin (or vascular margin), the posterior margin, and the anterior surface of the specimen. The current definition of CRM remains controversial and several centres do not consider one or every surface as a resection margin and therefore do not include it in the CRM6,7. Only a few studies have separately evaluated SMV and SMA margins. The SMA margin, also called the uncinate process or mesopancreatic margin, is frequently included in the posterior margin and it represents the primary site of incomplete resection8,9.
Although the terminology is still controversial, the mesopancreas is generally defined as the fatty tissue between the pancreatic head and uncinate process, the SMA, and the coeliac artery, and contains blood and lymphatic vessels, lymph nodes, and nerve fibres10. It rises from the embryological mesentery attaching the pancreatic bud to the abdominal wall and it may be hypothesized that tumour cells drain into lymphatic and blood vessels, spread along nerves, and infiltrate the retroperitoneum, potentially explaining the high frequency of positive margins at this site. Despite its significance, the radiological characterization of the mesopancreas has been poorly explored. Some studies have found perivascular SMA stranding as a predictor of resection status and poor overall survival (OS)11,12.
The aim of this study was to accurately evaluate the infiltration of the mesopancreas according to diagnostic imaging and establish correlations with histopathology and survival outcomes in PDAC patients who underwent PD.
Methods
Patient cohort
This study was approved by the Institutional Review Board (P2020/378) and the requirement for written informed consent was waived. It was performed in accordance with the Declaration of Helsinki. From January 2015 to December 2021, all consecutive patients who underwent PD for PDAC with curative intent at Erasme University Hospital were reviewed from a prospective database. Each case was evaluated at diagnosis and before surgery at tumour board meetings to determine eligibility for surgery after receiving or not receiving neoadjuvant treatment (NAT). Patients for whom preoperative imaging was not available for re-evaluation were excluded from the study and patients who were lost to follow-up or who died after surgery or within the first year for a reason unrelated to PDAC were excluded from the survival analyses.
The research was not pre-registered in an independent institutional registry.
Objectives
The primary objective was the assessment of mesopancreatic infiltration. Secondary objectives were to assess correlations between mesopancreatic infiltration and the histopathological analysis of surgical margins, disease-free survival (DFS) and OS after PD, and risk factors of death and recurrence. DFS was calculated from the date of surgery until the date of the first radiological sign of recurrence. OS was calculated from the date of surgery until death from any cause.
Neoadjuvant treatment and surgical procedure
When patients were selected for NAT at tumour board meetings, neoadjuvant chemotherapy was administered first, possibly followed by radiotherapy (conventional radiotherapy or isotoxic high-dose stereotactic body radiotherapy (iHD-SBRT))13,14. Indications for NAT were borderline resectable and locally advanced disease, or high-risk resectable PDAC, defined as a tumour with SMV contact of less than 180° and/or with high levels of carbohydrate antigen 19-9 (greater than 500 kU/l)15. The type of chemotherapy was heterogeneous over time, but always involved FOLFIRINOX (folinic acid, 5-fluorouracil, irinotecan, and oxaliplatin) or gemcitabine-based regimens.
Tumour resection was performed either by laparotomy or by laparoscopy and involved standard PD with lymphadenectomy. The SMA-first approach was used in the case of suspected vascular contact with the SMA and/or SMV according to diagnostic imaging. The SMA was dissected using a medial uncinate approach. The mesopancreas triangle, delimited by the posterior surface of the SMV/posterior vein, the anterior surface of the aorta between the coeliac artery and the SMA origin, and the right hemi-circumferences of the coeliac artery and the SMA16, was removed in a cranial direction, after transection of the proximal jejunum and an uncrossing manoeuvre behind the superior mesenteric vessels. Additional venous resection was performed in cases of suspected SMV invasion. All patients underwent reconstruction either by pancreatojejunostomy or by pancreatogastrostomy, based on the surgeon’s discretion (except in the case of total pancreatectomy), completed by hepaticojejunostomy and gastrojejunostomy.
Margins were identified by the surgeon and the pathologist with multicolour inking, including the mesenterico-portal vein groove or SMV margin and the pancreatic transection margin17. Before April 2019, the SMA and posterior margins were inked together and, after April 2019, they were coloured separately. In this study, the mesopancreatic margin included both SMA and posterior margins.
Radiological analysis
Preoperative radiographic images were reviewed by two radiologists, expert in pancreatic imaging (M.P. and M.A.B.) and blinded with regard to the histopathology results. Contrast-enhanced CT (CE-CT) was the method of choice to determine radiological tumour size, vascular contacts, and mesopancreas infiltration; MRI was used in cases of intolerance to iodinated contrast media. PDAC resectability was classified according to National Comprehensive Cancer Network (NCCN) guidelines18. The location of SMV and SMA contacts was evaluated by quadrants according to the transversal plane: right antero-lateral, right postero-lateral, left antero-lateral, and left postero-lateral. According to qualitative radiological assessment, the mesopancreas was characterized as having normal fat (NF), fat stranding (FS), or solid infiltration (SI) (Fig. 1). When patients were selected for NAT at tumour board meetings, the outcomes of mesopancreas and vascular contacts for the statistical analyses were based on CE-CT at diagnosis. When acute pancreatitis occurred after biliary drainage, new CE-CT was performed after pancreatitis resolution (before surgery or the start of NAT) and was chosen for radiological evaluation.
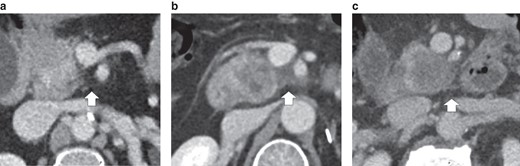
Characterization of mesopancreas infiltration according to contrast-enhanced CT
a Normal fat. b Fat stranding. c Solid infiltration.
Histopathological analysis
A review of all pathological specimens was conducted by pathologists experienced in pancreatic diseases (P.D., L.V., and N.D.), with the intention of evaluating the presence or absence of vascular margin involvement by PDAC. Serial axial slicing of the entire pancreatic specimen was performed according to the Leeds Pathology Protocol3. Tumours were staged according to the eighth edition of the AJCC Cancer Staging Manual19.
The margin was considered involved (R1) when tumoral cells were present at less than or equal to 1 mm from the surgical margin. R1 resections were subcategorized into ‘R1 indirect’, when tumoral cells were less than or equal to 1 mm from the margin, but not present on the surgical margin, and ‘R1 direct’, in cases with tumoral deposits on the surgical margin. Vascular surgical margins included the SMV margin and the mesopancreatic (or SMA) margin.
Follow-up
According to the histopathological analysis of the surgical specimen and the tumour board decision, adjuvant therapy was usually proposed to patients in good clinical condition within 3 months after surgery. Long-term follow-up usually included clinical evaluation, laboratory tests, and imaging studies (three times per year in years 1 and 2, two times per year in years 3, 4, and 5, and then annually).
Statistical analysis
Descriptive statistics are used to report patient characteristics for the whole cohort. Counts and percentages are presented for each category of the categorical variables. Medians and interquartile ranges are used to describe skewed distributions. Normality was assessed based on graphical representations (histogram, box plot). Skewed distributions were compared between groups using the Kruskal–Wallis test. Frequencies were compared between groups using Fisher’s exact test or Pearson’s chi-squared test, depending on the expected numbers. OS and DFS were analysed using the Kaplan–Meier method and compared between groups using the log rank test. The association between several factors and the time to death and/or time to recurrence was analysed using univariable Cox regression. Multivariable analysis was conducted based on variables with P < 0.080 in the univariable Cox regression. HRs are presented with their 95% confidence intervals. P ≤ 0.050 (two-sided) was considered statistically significant. The analyses were performed using the gtsummary version 1.7.2 package in the R version 4.2.3 and RStudio version 2023.3.0.386 environments.
Results
Patient demographics
Among the 151 patients who underwent PD or total pancreatectomy for PDAC over the study interval, 149 patients were included in the analysis (2 patients were excluded). Patient characteristics are summarized in Table 1 and are displayed according to the radiological aspect of the mesopancreas. The median age at surgery was 67 (interquartile range 59–73) years. A significantly higher percentage of patients had biliary drainage at diagnosis in the FS group compared with the NF group (P = 0.002). NAT was administered to 53 patients (35.6%) (24 patients received chemotherapy, 23 patients received chemotherapy/iHD-SBRT, and 6 patients received chemoradiotherapy). Higher percentages of FS and SI patients received NAT compared with NF patients. Concomitant venous resection was performed in 41 patients (27.5%) and higher percentages of FS and SI patients underwent concomitant venous resection compared with NF patients (P < 0.004).
Patient characteristics according to the radiological aspect of the mesopancreas
| Mesopancreas fat | P | ||||||
|---|---|---|---|---|---|---|---|
| Overall, n = 149 | NF, n = 82 | FS, n = 47 | SI, n = 20 | NF/FS | NF/SI | FS/SI | |
| Age (years), median (i.q.r.) | 67 (59–73) | 67 (59–73) | 67 (59–72) | 68 (58–69) | 0.761 | 0.676 | 0.853 |
| Sex | 0.454 | 0.186 | 0.081 | ||||
| Female | 80 (53.7) | 44 (53.7) | 22 (46.8) | 14 (70.0) | |||
| Male | 69 (46.3) | 38 (46.3) | 25 (53.2) | 6 (30.0) | |||
| BMI (kg/m2), median (i.q.r.) | 25.0 (22.1–28.8) | 24.9 (22.1–28.5) | 26.0 (22.9–28.5) | 24.6 (21.9–29.7) | 0.370 | 0.966 | 0.696 |
| Biliary drainage | 87 (58.4) | 40 (48.8) | 36 (76.6) | 11 (55.0) | 0.002* | 0.618 | 0.077 |
| Carbohydrate antigen 19–9 >37 kU/l | 0.834 | 0.771 | >0.999 | ||||
| No data | 15 (10.1) | 11 (13.4) | 3 (6.4) | 1 (5.0) | |||
| No | 34 (22.8) | 19 (23.2) | 11 (23.4) | 4 (20.0) | |||
| Yes | 100 (67.1) | 52 (63.4) | 33 (70.2) | 15 (75.0) | |||
| Neoadjuvant treatment | 0.094 | 0.006* | 0.188 | ||||
| No | 96 (64.4) | 61 (74.4) | 27 (57.4) | 8 (40.0) | |||
| Chemotherapy | 24 (16.1) | 12 (14.6) | 8 (17.0) | 4 (20.0) | |||
| Chemoradiotherapy | 6 (4.0) | 2 (2.4) | 1 (2.1) | 3 (15.0) | |||
| Chemotherapy/iHD-SBRT | 23 (15.4) | 7 (8.5) | 11 (23.4) | 5 (25.0) | |||
| Type of surgery | >0.999 | >0.999 | >0.999 | ||||
| Pancreatoduodenectomy | 140 (94.0) | 77 (93.9) | 44 (93.6) | 19 (95.0) | |||
| Total pancreatectomy | 9 (6.0) | 5 (6.1) | 3 (6.4) | 1 (5.0) | |||
| Concomitant venous resection | <0.001* | 0.003* | 0.981 | ||||
| No | 108 (72.5) | 71 (86.6) | 26 (55.3) | 11 (55.0) | |||
| Yes | 41 (27.5) | 11 (13.4) | 21 (44.7) | 9 (45.0) | |||
| Adjuvant treatment | 0.141 | 0.514 | 0.729 | ||||
| No | 50 (33.6) | 34 (41.5) | 10 (21.3) | 6 (30.0) | |||
| Yes | 99 (66.4) | 48 (58.5) | 37 (78.7) | 14 (70.0) | |||
Values are n (%) unless otherwise indicated. *Statistically significant. NF, normal fat; FS, fat stranding; SI, solid infiltration; i.q.r., interquartile range; iHD-SBRT, isotoxic high-dose stereotactic body radiotherapy.
Blinded review of diagnostic imaging
After review of imaging at the time of diagnosis, the median radiological tumour size was 25 (interquartile range 20–30) mm. The pancreatic neoplasm was located in the head or the uncinate process in 82 patients (55.0%) and 67 patients (45.0%) respectively and chronic obstructive pancreatitis was observed in 88 patients (59.1%) (Table S1). At diagnosis, PDACs were classified as resectable (90 patients), borderline resectable (43 patients), and locally advanced (16 patients) according to the NCCN classification. The most frequent quadrant involved in the case of tumoral vascular contact with the SMV or the SMA was the right posterior lateral quadrant for both (90 instances (88.2%) and 24 instances (100%) respectively) (Fig. S1). The median delay between CE-CT at diagnosis and surgery was 29 (interquartile range 18–50) days in patients who underwent upfront surgery and 203.5 (interquartile range 154–241) days in patients who received NAT before surgery. CE-CT for restaging after NAT was performed at a median time of 25.5 (interquartile range 14–41) days before surgery.
At diagnosis, FS or SI in the mesopancreas was present in 47 patients (32%) and 20 patients (13%) respectively. Radiological tumour size was smaller in NF patients compared with FS and SI patients (P < 0.001) (Table S1). Tumours were located in the uncinate process in the majority of patients with SI and half of patients with FS; a lower proportion of patients with NF had tumours that were located in the uncinate process (P < 0.005).
Histopathological outcomes
Pancreatic adenocarcinoma was ductal in 131 patients (87.9%) and associated with an intraductal papillary mucinous neoplasm in 18 patients (12.1%) (Table 2). At final pathology, lymph nodes were positive in 103 patients (69.1%) and perineural, lymphatic, and microvascular invasion were present in 119 patients (80.0%), 80 patients (53.7%), and 56 patients (37.6%) respectively. An R0 resection (greater than 1 mm) was achieved in 54 patients (36.2%); in all patients with an R1 resection (less than or equal to 1 mm), a vascular margin (SMV and/or SMA) was involved. The pathological tumour size was smaller in patients from the NF group (P < 0.007). Significantly higher percentages of SI patients (but not FS patients) had a positive SMV margin, a positive SMA margin, and an R1 direct resection status (P < 0.050) compared with NF patients. Mesopancreas infiltration was not associated with perineural or lymphovascular invasion.
Histopathological findings according to the radiological aspect of the mesopancreas
| Mesopancreas fat | P | ||||||
|---|---|---|---|---|---|---|---|
| Overall, n = 149 | NF, n = 82 | FS, n = 47 | SI, n = 20 | NF/FS | NF/SI | FS/SI | |
| Type of carcinoma | 0.403 | >0.999 | 0.418 | ||||
| Ductal | 131 (87.9) | 71 (86.6) | 43 (91.5) | 17 (85.0) | |||
| Associated with an IPMN | 18 (12.1) | 11 (13.4) | 4 (8.5) | 3 (15.0) | |||
| Tumour differentiation | 0.409 | 0.095 | 0.209 | ||||
| Well | 52 (34.9) | 34 (41.5) | 13 (27.7) | 5 (25.0) | |||
| Moderate | 70 (47.0) | 35 (42.7) | 23 (48.9) | 12 (60.0) | |||
| Poor | 18 (12.1) | 11 (13.4) | 7 (14.9) | 0 (0.0) | |||
| Unknown | 9 (6.0) | 2 (2.4) | 4 (8.5) | 3 (15.0) | |||
| Pathological tumour size (mm), median (i.q.r.) | 30 (23–40) | 26 (22–35) | 34 (26–43) | 38 (26–49) | 0.002* | 0.006* | 0.651 |
| Lymph node status | 0.052 | 0.283 | 0.756 | ||||
| Negative | 46 (30.9) | 31 (37.8) | 10 (21.3) | 5 (25.0) | |||
| Positive | 103 (69.1) | 51 (62.2) | 37 (78.7) | 15 (75.0) | |||
| Perineural invasion | 0.502 | >0.999 | 0.741 | ||||
| No | 30 (20.1) | 18 (22.0) | 8 (17.0) | 4 (20.0) | |||
| Yes | 119 (79.9) | 64 (78.0) | 39 (83.0) | 16 (80.0) | |||
| Lymphatic invasion | 0.855 | 0.769 | 0.689 | ||||
| No | 69 (46.3) | 38 (46.3) | 21 (44.7) | 10 (50.0) | |||
| Yes | 80 (53.7) | 44 (53.7) | 26 (55.3) | 10 (50.0) | |||
| Microvascular invasion | 0.739 | 0.424 | 0.609 | ||||
| No | 93 (62.4) | 53 (64.6) | 29 (61.7) | 11 (55.0) | |||
| Yes | 56 (37.6) | 29 (35.4) | 18 (38.3) | 9 (45.0) | |||
| SMV margin | 0.333 | 0.022* | 0.249 | ||||
| Free | 82 (55.0) | 52 (63.4) | 24 (51.1) | 6 (30.0) | |||
| ≤1mm | 38 (25.5) | 16 (19.5) | 14 (29.8) | 8 (40.0) | |||
| Invasion | 29 (19.5) | 14 (17.1) | 9 (19.1) | 6 (30.0) | |||
| SMA margin | 0.159 | 0.050* | 0.315 | ||||
| Free | 77 (51.7) | 49 (59.8) | 20 (42.6) | 8 (40.0) | |||
| ≤1mm | 41 (27.5) | 21 (25.6) | 16 (34.0) | 4 (20.0) | |||
| Invasion | 31 (20.8) | 12 (14.6) | 11 (23.4) | 8 (40.0) | |||
| Resection status | 0.473 | 0.033* | 0.206 | ||||
| R0 | 54 (36.2) | 35 (42.7) | 15 (31.9) | 4 (20.0) | |||
| R1 indirect | 48 (32.2) | 26 (31.7) | 17 (36.2) | 5 (25.0) | |||
| R1 direct | 47 (31.5) | 21 (25.6) | 15 (31.9) | 11 (55.0) | |||
Values are n (%) unless otherwise indicated. *Statistically significant. NF, normal fat; FS, fat stranding; SI, solid infiltration; IPMN, intraductal papillary mucinous neoplasm; i.q.r., interquartile range; SMV, superior mesenteric vein; SMA, superior mesenteric artery.
Survival analyses
The median follow-up was 46 (interquartile range 42–50) months. The median OS and DFS were significantly lower in the case of SI (17 and 8 months respectively) compared with NF (30 and 14 months respectively) and FS (29 and 16 months respectively) in the mesopancreas (P = 0.017 and 0.028 respectively) (Fig. 2). Regarding the impact of NAT in patients with mesopancreatic FS or SI at diagnosis, no significant impact on OS and DFS was observed (Fig. S2).
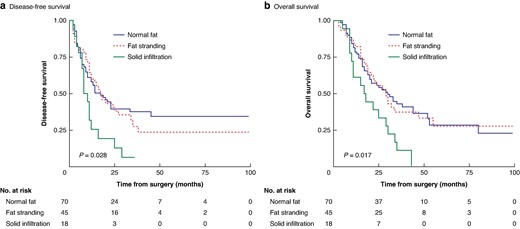
Kaplan–Meier survival curves according to mesopancreas infiltration
a Disease-free survival. b Overall survival. Statistical significance was evaluated using the log rank test.
Tumour location in the uncinate process, SI of the mesopancreas, pathological tumour size, a positive lymph node status, perineural and microvascular invasion, and an invaded SMA margin were relevant for predicting OS in univariable analysis (Table 3). Pathological tumour size was an independent prognostic factor for OS in multivariable analysis.
Univariable and multivariable analyses of prognostic factors for overall survival after pancreatoduodenectomy for pancreatic ductal adenocarcinoma
| Univariable analysis | Multivariable analysis | |||
|---|---|---|---|---|
| HR (95% c.i.) | P | HR (95% c.i.) | P | |
| Age | ||||
| ≤Median | – | – | – | – |
| >Median | 0.89 (0.59,1.35) | 0.594 | – | – |
| Sex | ||||
| Female | – | – | – | – |
| Male | 1.10 (0.73,1.66) | 0.659 | – | – |
| BMI | 0.97 (0.92,1.02) | 0.203 | – | – |
| Tumour location | ||||
| Head | – | – | – | – |
| Uncinate process | 1.68 (1.11,2.54) | 0.014* | 1.29 (0.80,2.08) | 0.289 |
| Mesopancreas | ||||
| Normal fat | – | – | – | – |
| Fat stranding | 1.01 (0.64,1.62) | 0.953 | 0.75 (0.46,1.23) | 0.261 |
| Solid infiltration | 2.16 (1.23,3.81) | 0.007* | 1.22 (0.63,2.36) | 0.546 |
| Pathological tumour size | 1.02 (1.01,1.03) | <0.001* | 1.01 (1.00,1.03) | 0.024* |
| Lymph node status | ||||
| Negative | – | – | – | – |
| Positive | 1.99 (1.20,3.31) | 0.008* | 1.62 (0.92,2.85) | 0.096 |
| Perineural invasion | ||||
| No | – | – | – | – |
| Yes | 2.14 (1.20,3.80) | 0.010* | 1.52 (0.83,2.78) | 0.174 |
| Lymphatic invasion | ||||
| No | – | – | – | – |
| Yes | 1.43 (0.94,2.17) | 0.100 | – | – |
| Microvascular invasion | ||||
| No | – | – | – | – |
| Yes | 1.87 (1.23,2.84) | 0.003* | 1.33 (0.84,2.12) | 0.223 |
| SMV margin | ||||
| Free | – | – | – | – |
| ≤1mm | 1.10 (0.67,1.81) | 0.705 | – | – |
| Invasion | 1.53 (0.90,2.60) | 0.118 | – | – |
| SMA margin | ||||
| Free | – | – | – | – |
| ≤1mm | 1.26 (0.77,2.06) | 0.349 | 0.98 (0.58,1.63) | 0.928 |
| Invasion | 2.20 (1.31,3.70) | 0.003* | 1.31 (0.72,2.37) | 0.373 |
*Statistically significant. BMI, body mass index; SMV, superior mesenteric vein; SMA, superior mesenteric artery.
Regarding prognostic factors for DFS, tumour location in the uncinate process, SI of the mesopancreas, pathological tumour size, a positive lymph node status, perineural and microvascular invasion, and an invaded SMA margin were significant in univariable analysis. Tumour location in the uncinate process and pathological tumour size were independent prognostic factors for DFS in multivariable analysis (Table 4).
Univariable and multivariable analyses of prognostic factors for disease-free survival after pancreatoduodenectomy for pancreatic ductal adenocarcinoma
| Univariable analysis | Multivariable analysis | |||
|---|---|---|---|---|
| HR (95% c.i.) | P | HR (95% c.i.) | P | |
| Age | ||||
| ≤Median | – | – | – | – |
| >Median | 0.88 (0.58,1.33) | 0.546 | – | – |
| Sex | ||||
| Female | – | – | – | – |
| Male | 0.96 (0.64,1.46) | 0.866 | – | – |
| BMI | 1.01 (0.96,1.06) | 0.718 | – | – |
| Tumour location | ||||
| Head | – | – | – | – |
| Uncinate process | 2.10 (1.38,3.20) | <0.001* | 1.79 (1.11,2.88) | 0.018* |
| Mesopancreas | ||||
| Normal fat | – | – | – | – |
| Fat stranding | 1.11 (0.70,1.76) | 0.658 | 0.80 (0.49,1.30) | 0.358 |
| Solid infiltration | 2.16 (1.21,3.87) | 0.010* | 0.84 (0.42,1.68) | 0.617 |
| Pathological tumour size | 1.03 (1.02,1.04) | <0.001* | 1.02 (1.01,1.04) | 0.008* |
| Lymph node status | ||||
| Negative | – | – | – | – |
| Positive | 1.90 (1.14,3.16) | 0.013* | 1.57 (0.89,2.79) | 0.121 |
| Perineural invasion | ||||
| No | – | – | – | – |
| Yes | 1.84 (1.06,3.22) | 0.031* | 1.31 (0.73,2.36) | 0.371 |
| Lymphatic invasion | ||||
| No | – | – | – | – |
| Yes | 1.46 (0.96,2.23) | 0.079 | 0.78 (0.44,1.40) | 0.407 |
| Microvascular invasion | ||||
| No | – | – | – | – |
| Yes | 1.66 (1.09,2.52) | 0.019* | 1.28 (0.72,2.28) | 0.402 |
| SMV margin | ||||
| Free | – | – | – | – |
| ≤1mm | 1.13 (0.69,1.85) | 0.632 | – | – |
| Invasion | 1.53 (0.90,2.62) | 0.116 | – | – |
| SMA margin | ||||
| Free | – | – | – | – |
| ≤1mm | 1.48 (0.91,2.41) | 0.115 | 1.13 (0.67,1.90) | 0.644 |
| Invasion | 2.38 (1.42,4.01) | 0.001* | 1.46 (0.82,2.61) | 0.194 |
*Statistically significant. BMI, body mass index; SMV, superior mesenteric vein; SMA, superior mesenteric artery.
Discussion
In the present study, the radiological patterns of presumed mesopancreatic infiltration are compared and their survival impact after PD for PDAC is assessed. SI of the mesopancreas is associated with a poor prognosis, whereas FS does not significantly affect DFS and OS. The radiological texture of the mesopancreas correlates with tumour location, radiological vascular contacts, and radiological tumour size, but shows no association with perineural or lymphovascular invasion or lymph node status. In multivariable analysis, tumour location in the uncinate process and pathological tumour size are prognostic factors for DFS, and pathological tumour size is a prognostic factor for OS, whereas the radiological aspect of the mesopancreatic fat is not a prognostic factor for DFS or OS.
The term ‘mesopancreas’ was introduced by Gockel et al.10 in 2007, by analogy to total mesorectal excision in rectal cancer. It consists of fibrous bundles and adipose tissue containing blood and lymphatic vessels, lymph nodes, and nerve fibres, and is positioned between the uncinate process, the SMA, and the SMV; its boundaries are not clearly defined20,21. Embryologically, the mesopancreas loses its peritoneal attachment during duodenal rotation that leads to the fusion of both ventral and dorsal pancreatic buds. Vascular margins, including the SMA (or mesopancreatic) margin, are the most frequently involved margins on PD specimens for PDAC and this was observed in the present study as well22. The plan for SMA dissection during surgery is less obvious to find than for SMV dissection, and, therefore, periarterial tissue is often left in place, leading to a positive margin at this level. The prognosis was significantly poorer for uncinate process PDAC compared with cephalic PDAC, highlighting the potential role of the mesopancreas in cancer aggressiveness. The underlying mechanisms are not fully understood and might be related to both the spatial distribution of the invasion front and the epithelial-mesenchymal transition, as well as the influence of mesopancreatic adipocytes on cancer cell growth.
CE-CT is the method of choice to assess the resectability of PDAC with regard to the mesenteric vessels. The radiological evaluation of the mesopancreas has not been extensively studied, despite its increasing relevance in the surgical literature23,24. Safi et al.11 analysed the mesopancreas of PDAC patients undergoing PD, classifying it according to the size of the radiological infiltration and its contact with the major vessels, and found a correlation with the histopathological status of the surgical margins. Radiological mesopancreatic infiltration can be characterized more specifically, considering not only its size and vessel contact, but also the qualitative aspects of fat infiltration, as found in the present study. It was observed that SI of the mesopancreas was associated with poorer DFS and OS, whereas this was not the case for FS. Some studies have hypothesized that perivascular SMA stranding is caused by fibrotic infiltration25,26, stromal reaction27, or tumoral infiltration associated with fibrotic thickening of inflammatory adipose tissue (named the ‘reticular pattern’)28. Mesopancreatic FS was not correlated with positive SMV/SMA margins or R1 resection, unlike mesopancreatic SI.
A previous study evaluated the NAT response in the mesopancreas according to CE-CT and the corresponding histopathology29; the study demonstrated persistent mesopancreatic infiltration according to imaging after NAT in 74% of patients and a positive circumferential margin in 37% of patients, although no correlation between these findings was established; only the mesopancreatic histological margin correlated with the radiological tumour response. In the present study, no significant impact of NAT was observed on DFS and OS in patients with FS or SI at diagnostic imaging. Only a few patients with SI underwent upfront surgery rather than NAT, because of a misinterpretation of diagnostic imaging regarding resectability. Given the small number of patients in these subgroups and the heterogeneity of patients who were compared in terms of NAT regimen and NCCN resectability, the influence of NAT on mesopancreatic imaging should be evaluated in a prospective fashion and with similar populations.
The retrospective design of the analysis may have introduced a potential bias into the radiological evaluation, as CE-CT was not always triphasic and MRI sequences were occasionally incomplete. The volume of the mesopancreas varies according to body morphology and slim patients may have a very thin mesopancreas, making the assessment more challenging. Regarding the time for radiological assessment in NAT patients, considering CE-CT at diagnosis may misjudge the tumour resectability before surgery. CE-CT restaging after NAT may show poor specificity for differentiation of residual viable tumour and post-treatment-induced changes at the tumour–vessel interface due to a lack of contrast resolution. The lack of clearly defined boundaries for the mesopancreas may result in a more ambiguous histopathological analysis of this margin. Although differentiation between the SMA and the posterior margins has been implemented at the involved centre recently, they were, before April 2019, pooled together as circumferential margins. Only the mesopancreatic margin was histologically analysed and not the entire mesopancreas, which introduces some bias in the correlation analysis for radiological mesopancreatic fat. The sample size in this study was relatively small.
The prognosis for patients who underwent PD for PDAC was found to be worse when their mesopancreas exhibited SI according to diagnostic imaging, whereas no significant impact was observed when it demonstrated FS. Tumour location in the uncinate process and pathological tumour size were prognostic factors for survival, but not mesopancreatic FS, which implies the existence of aetiopathogenic mechanisms that might explain and characterize tumoral invasion of vascular margins and the mesopancreas. This could be determined by in-depth transcriptomic and genomic analyses of vascular margins on surgical PDAC specimens. The effect of NAT on FS and SI warrants further investigation in future trials focusing on NAT.
Funding
This work was supported by a doctoral grant from the ‘Fonds Erasme’.
Acknowledgements
The authors would like to acknowledge the contribution of a medical writer, Sandy Field, PhD, for English language editing of this manuscript, and a statistician, Mélina Houinsou Hans, for the statistical analyses.
Disclosure
The authors declare no conflict of interest.
Supplementary material
Supplementary material is available at BJS Open online.
Data availability
The data sets used and analysed during this study are available from the corresponding author upon reasonable request.
Author contributions
Julie Navez (Conceptualization, Data curation, Formal analysis, Funding acquisition, Investigation, Methodology, Project administration, Visualization, Writing—original draft, Writing—review & editing), Martina Pezzullo (Conceptualization, Data curation, Methodology, Writing—review & editing), Christelle Bouchart (Data curation, Formal analysis, Resources, Writing—review & editing), Tatjana Arsenijevic (Conceptualization, Formal analysis, Methodology, Supervision, Writing—review & editing), Pieter Demetter (Conceptualization, Data curation, Formal analysis, Project administration, Supervision, Writing—review & editing), Jean Closset (Conceptualization, Data curation, Validation, Writing—review & editing), Oier Azurmendi Senar (Conceptualization, Formal analysis, Investigation, Methodology, Writing—review & editing), Marie-Lucie Racu (Data curation, Formal analysis, Writing—review & editing), Nicky D’Haene (Data curation, Resources, Writing—review & editing), Jacques Deviere (Conceptualization, Data curation, Investigation, Supervision, Writing—review & editing), Laurine Verset (Data curation, Formal analysis, Resources, Writing—review & editing), Maria A. Bali (Conceptualization, Data curation, Methodology, Validation, Writing—review & editing), and Jean-Luc van Laethem (Conceptualization, Methodology, Project administration, Supervision, Validation, Writing—review & editing)
