


Abstract
Histopathological growth patterns are one of the strongest prognostic factors in patients with resected colorectal liver metastases. Development of an efficient, objective and ideally automated histopathological growth pattern scoring method can substantially help the implementation of histopathological growth pattern assessment in daily practice and research. This study aimed to develop and validate a deep-learning algorithm, namely neural image compression, to distinguish desmoplastic from non-desmoplastic histopathological growth patterns of colorectal liver metastases based on digital haematoxylin and eosin-stained slides.
The algorithm was developed using digitalized whole-slide images obtained in a single-centre (Erasmus MC Cancer Institute, the Netherlands) cohort of patients who underwent first curative intent resection for colorectal liver metastases between January 2000 and February 2019. External validation was performed on whole-slide images of patients resected between October 2004 and December 2017 in another institution (Radboud University Medical Center, the Netherlands). The outcomes of interest were the automated classification of dichotomous hepatic growth patterns, distinguishing between desmoplastic hepatic growth pattern and non-desmoplatic growth pattern by a deep-learning model; secondary outcome was the correlation of these classifications with overall survival in the histopathology manual–assessed histopathological growth pattern and those assessed using neural image compression.
Nine hundred and thirty-two patients, corresponding to 3.641 whole-slide images, were reviewed to develop the algorithm and 870 whole-slide images were used for external validation. Median follow-up for the development and the validation cohorts was 43 and 29 months respectively. The neural image compression approach achieved significant discriminatory power to classify 100% desmoplastic histopathological growth pattern with an area under the curve of 0.93 in the development cohort and 0.95 upon external validation. Both the histopathology manual–scored histopathological growth pattern and neural image compression-classified histopathological growth pattern achieved a similar multivariable hazard ratio for desmoplastic versus non-desmoplastic growth pattern in the development cohort (histopathology manual score: 0.63 versus neural image compression: 0.64) and in the validation cohort (histopathology manual score: 0.40 versus neural image compression: 0.48).
The neural image compression approach is suitable for pathology-based classification tasks of colorectal liver metastases.
Introduction
Colorectal cancer (CRC) is the third most common cancer and second cause of cancer mortality worldwide1,2. Approximately one-third of these patients are afflicted with metastatic disease, with the liver representing the most predominant metastatic site3,4. The presence of CRC distant metastases itself does not preclude potentially curative treatment5–12. Although half of all patients with colorectal liver metastases (CRLM) may now be eligible for local treatment13, the results are still unsatisfactory, with only a quarter of patients achieving a long-term cure14,15. This has garnered a longstanding interest in the prediction of prognosis and treatment effect, with the ultimate goal of guiding patient selection and improving outcome16.
In the search for new biomarkers, histological evaluation of liver metastases has emerged as a promising candidate. Light-microscopic evaluation of resected metastases allows for the determination of distinct histopathological growth patterns (HGPs)17. The most clinically relevant distinction between HGPs is desmoplastic versus non-desmoplastic HGP, according to the Rotterdam 50% cut-off. A desmoplastic HGP is recognized with an approximate two-fold reduction in mortality and cancer recurrence18,19. Beside prognosis, several studies suggest that HGP is also predictive for treatment effect2,20,21. Although HGPs have been shown to describe the biological properties of the tumour relating to therapy response and prognosis, they are not routinely scored yet. Expertise is required because there are several caveats in scoring22. Moreover, as HGP scoring requires a pathologist to score the full interface between the liver and the tumour cell by cell, the task is time-consuming. The lack of an efficient, objective and ideally automated HGP classification method substantially limits the implementation of HGPs in daily practice and research.
Developments in the application of artificial intelligence, and specifically deep learning, to high-resolution digitalized whole-slide images (WSI) has led to a rapidly growing research field at the interface of medical and computer sciences23,24. Several deep-learning models are already approaching or even surpassing dedicated pathologists in histology-based marker determination tasks25–32. Moreover, deep-learning models can predict prognosis by learning directly from the histology slides, effectively creating novel AI-based computational biomarkers32.
This study aims to assess whether a novel state-of-the-art deep-learning approach can be employed for the automated classification of the desmoplastic HGP in resected CRLM.
Methods
The current study adheres to the REporting recommendations for tumour MARKer prognostic studies (REMARK)33. Institutional ethical review was obtained from both the medical ethics committee of the Erasmus Medical Centre (MEC-2018-1743), which granted a waiver for (renewed) informed consent, and the Ethical Committee of the Radboud University Medical Centre (MEC 2015–1637).
Patient cohorts and sample preparation
The patient cohort used for development consisted of patients undergoing surgical treatment of CRLM at the Erasmus MC Cancer Institute, Rotterdam, the Netherlands, between January 2000 and February 2019. For external validation purposes patients treated in a similar time frame (October 2004 to December 2017) at a different centre, the Radboud University Medical Centre, Nijmegen, the Netherlands, were selected. All available haematoxylin and eosin–stained slides of all resection specimens were requested from the respective pathology departments and subsequently digitalized. Patients were included only if they underwent first curative intent CRLM resection (that is, resection specimens for recurrent disease were excluded, and patients had to have had curative intent local treatment of all known cancerous disease at time of first liver surgery). Follow-up was obtained through the electronic patient record as patients are scheduled for regular follow-up after resection.
Histopathological growth patterns determination
All slides were scanned at the pathology department of the Radboud UMC using a 3DHistech P1000 scanner at a spatial resolution of 0.25 µm/pixel. Digital assessment of all WSI was performed by a trained observer (DJH) to confirm slide content and assess WSI quality.
The HGP was previously determined in accordance with international consensus guidelines within the context of retrospective cohort studies18,19,34. The HGPs represent distinct histomorphological tumour–liver interface phenotypes of resected liver metastasis (Fig. S1), and can be grossly divided into two classes. The desmoplastic HGP is characterized by a broad band of desmoplastic stroma barring tumour–liver cell contact, and often displays a dense lymphocytic infiltrate peripherally to this desmoplastic stroma. The non-desmoplastic types most often exhibit cell-to-cell contact between tumour and liver cells, with the replacement of hepatocytes by tumour cells retaining the liver-cell plate architecture, that is the ‘replacement’ HGP. Although HGPs can appear in conjunction, we performed classification of the dichotomous presence of any non-desmoplastic HGP (Fig. S1) rather than relative abundance for the development and validation of the model, as this best distinguishes prognosis and is therefore clinically most relevant17–19.
Neural image compression algorithm with multitask learning and attention pooling
For the classification of WSI we developed a neural image compression (NIC) algorithm with a supervised multitask-learning encoder framework (Fig. 1), building upon previous work35. The multitask NIC pipeline consists of two steps.
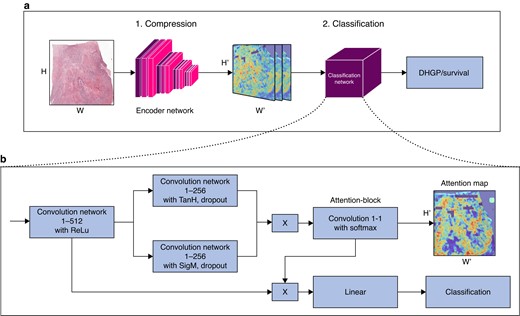
Neural image compression pipeline (A) with a supervised multitask learning encoder framework and convolutional neural networks classifier (B) Neural image compression with attention pipeline. First the slide is compressed, then classified. The classification architecture consists of four 1 × 1 convolutional layers and a final linear layer starting with a 1 × 1 convolution reducing the input channels from 2048 to 512 (conv1-512). H and W stand for height and width of the image respectively. H' and W' are the height and width of the compressed images respectively with H' << than H and W' << than W.
First, subregions of the entire gigapixel WSI are compressed into low-dimensional embedding vectors using a convolutional neural network (CNN), the encoder. These vectors are subsequently organized to form a compressed representation of the WSI, maintaining the spatial arrangement of the original WSI. The encoder model is responsible for gleaning high-level discriminatory information contained in the WSI for a variety of downstream tasks, while simultaneously suppressing image noise and spurious correlations35,36. To improve the extraction of high-level discriminatory factors that are transferable between a variety of tasks, we initially developed a supervised multitask learning architecture and trained an encoder on four histopathological tasks35. This approach demonstrated increased performance when compared to an unsupervised single-task framework. Independently, another author developed a similar multitask encoder, trained on 22 classification tasks and with validated performance increase compared to non-histopathological pretrained encoders37. In this work, we therefore use the new multitask encoder37, which compresses a tile of size 256 × 256 × 3 into a vector of size 2048. As input, we use here tiles at resolution 5 × (2 µm/px).
Second, a second CNN is trained on the entire compressed WSI as input to predict an outcome of interest, for example the HGP. For the CNN classifier, we adapted the attention-based architecture introduced in previous works (Fig. 1)38,39. In the context of neural networks, the term ‘attention’ refers to the capability of a network to learn to focus, that is to attend to specific regions of the input image. Using attention allows neural networks to make efficient use of training data as well as provide visually interpretable outputs via so-called ‘attention maps’. In one of the authors' previous works, they demonstrated the performance advantage of attention on a task for lung cancer subtyping compared to a convolutional architecture without attention.40 After a single layer, an attention block is applied, resulting in a score for each compressed tile. It follows a matrix multiplication of the attention map with the output of the first layer (‘attention pooling’), resulting in a single vector which is then fed to the final classification layer. In the attention block, a dropout rate of 0.25 was used. The attention maps were used to visualize what is relevant for the network’s prediction and thus contributes to the interpretability of the model.
Experimental setup
Following the compression of the slides using the encoder model, we trained the CNN with cross-entropy loss minimization to predict the image label of interest (that is the HGP). Development was performed using a five-fold cross-validation (three folds for training, one for validation, one for testing). The training was done with balanced sampling, batch size of one, and early stopping with 25 epoch patience using the validation ROC-AUC (receiver operating characteristic area under the curve) as stopping criteria. External validation was performed on previously unseen slides of the Nijmegen cohort by averaging the predictions of the five models. A patient-level score was subsequently obtained by averaging the scores of all slides belonging to a single patient.
Outcomes of interest
The primary outcome of interest was the classification of dichotomous hepatic growth patterns, distinguishing between desmoplastic hepatic growth pattern and non-desmoplastic growth pattern by a deep-learning model. The secondary outcome was the correlation of these classifications with overall survival, irrespective of the underlying cause of death.
Statistical analysis
All statistical analyses were performed using the R project for statistical computing (https://www.r-project.org/). A complete case analysis was performed because of a low percentage of missing data (<5%) and large sample size. Categorical variables are reported as absolute numbers with corresponding percentages and non-parametric ordinal or numerical variables as medians with corresponding interquartile ranges, and were compared using the chi2 or Kruskall Wallis tests respectively. Assessment of HGP classifier performance was done through ROC curve analysis with the slide-level ensemble score and observer-based HGP as the predictor and label respectively and the AUC with corresponding 95% c.i. as the performance metric. Given the class imbalance (roughly 80% of patients have a non-desmoplastic HGP), the optimality criteria were modified according to the prevalence of desmoplastic samples in the development cohort as proposed by others41. This threshold was subsequently applied in the external validation cohort to the patient-level ensemble scores, using the balanced accuracy as a performance metric42. Kaplan–Meier and Cox proportional regression survival analyses were performed to assess the prognostic value of the histopathology observer–based HGP and NIC-classified HGP. Multivariable models were corrected for age, sex, pT-stage, pN-stage, right-sided colorectal cancer, disease-free interval, number of liver metastasis, diameter of largest liver metastasis, preoperative carcinoembryonic antigen level and extrahepatic disease.
Results
Of 1254 patients treated at the development institution, 965 met the inclusion criteria and 932 were eligible for analysis. On the other hand, of 305 patients treated at the validation centre, 294 were eligible for analysis. A timeline of patients’ enrolment over the years at the development and the validation centres is presented respectively in Fig. S2 and Fig. S3.
Patient and treatment characteristics of the original and validation cohort are provided in Table S1. The development cohort comprised a total of 3.641 WSI from 932 patients (median follow-up time 43 months) undergoing first curative intent surgical treatment for CRLM. For external validation, a total of 870 WSI from 294 patients were available (median follow-up time 29 months). Fifty-five per cent of the patients in the development cohort received neo-adjuvant chemotherapy and 72.1% in the validation cohort. pT-stage did not differ significantly between the two cohorts (P = 0.94); however, a higher proportion of pN0-stage primary tumour was observed in the development cohort (P = 0.02). No statistically significant difference in HGP proportions was observed between the two cohorts.
Automated HGP classification
Using a five-fold cross-validation the NIC classifier achieved an AUC of 0.93 (95% c.i. 0.93 to 0.94) in the original cohort to classify the slide-level HGP (Fig. 2). Applying the optimal threshold for the ensemble score (0.69) based on the ROC curve/Youden’s J statistic (Fig. 2) resulted in a patient-level sensitivity of 82%, a specificity of 93% and a balanced accuracy of 88% (Fig. 2, Table 1). Upon external validation in the 870 previously unseen WSI of the validation cohort the NIC classifier achieved a similar AUC of 0.95 (95% c.i. 0.93 to 0.96) to classify the slide-level HGP (Fig. 2). Application of the optimal threshold from the development cohort achieved a patient-level sensitivity of 87%, a specificity of 91% and a balanced accuracy of 89% when compared to the observer-based HGP (Fig. 2).
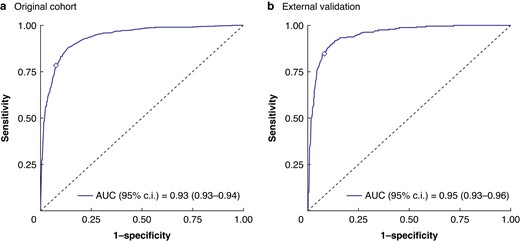
ROC curves of the automated histopathological growth pattern (HGP) classification in the original (a) and in the external validation cohort (b)
NIC HGP classification performance in the development and validation cohorts
| TP | TN | FP | FN | Sens. | Spec. | PPV | NPV | Bal. Acc. | |
|---|---|---|---|---|---|---|---|---|---|
| Development—patient level (n = 932) | 180 | 662 | 51 | 39 | 82% | 93% | 78% | 94% | 88% |
| Validation—patient level (n = 294)* | 52 | 213 | 21 | 8 | 87% | 91% | 71% | 96% | 89% |
| TP | TN | FP | FN | Sens. | Spec. | PPV | NPV | Bal. Acc. | |
|---|---|---|---|---|---|---|---|---|---|
| Development—patient level (n = 932) | 180 | 662 | 51 | 39 | 82% | 93% | 78% | 94% | 88% |
| Validation—patient level (n = 294)* | 52 | 213 | 21 | 8 | 87% | 91% | 71% | 96% | 89% |
*According to the predefined classification cut-off determined in the development cohort. Bal. Acc., balanced accuracy; FN, false negative; FP, false positive; NIC, neural image compression; NPV, negative predictive value; PPV, positive predictive value; Sens., sensitivity; Spec., specificity; TN, true negative; TP, true positive.
Survivals
Table 2 reports the survival estimates and regression results for the observer-based and the NIC-classified HGP in both the development and external validation cohort, and Fig. 3 and Fig. 4 display the respective overall survival (OS) curves with stratification for chemo-naïve and pretreated. Overall, the NIC-classified HGP exhibited similar prognostic impact on OS as the histopathology observer–based HGP, also upon external validation. For example, the adjusted hazards ratio (95% c.i.) for desmoplastic versus non-desmoplastic patients based on the NIC-classified HGP was 0.64 (0.51 to 0.79) in the original cohort and 0.48 (0.28 to 0.83) upon external validation, compared to 0.63 (0.50 to 0.79) and 0.40 (0.22 to 0.75) respectively for the observer-based HGP (Table 1). Figure S4 shows examples of attention maps of four different histological slides of liver tissue samples paired with their corresponding attention maps. The attention maps are generated using predictive models to visualize the areas of importance for classifying the hepatic growth pattern, thus providing insights into the model's decision-making process. An initial analysis of the attention maps shows that the model is indeed mainly focusing on the tumour–stroma border to determine the HGP.
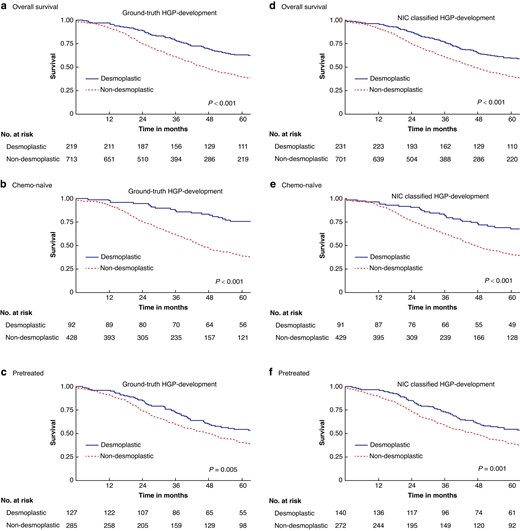
Overall survival (OS) curves for the observer-based (a–c) and neural image compression (NIC) (d–f) classified histopathological growth pattern (HGP) in the development cohort and stratified for pretreatment (c,f) and chemo-naïve (b,e) patients
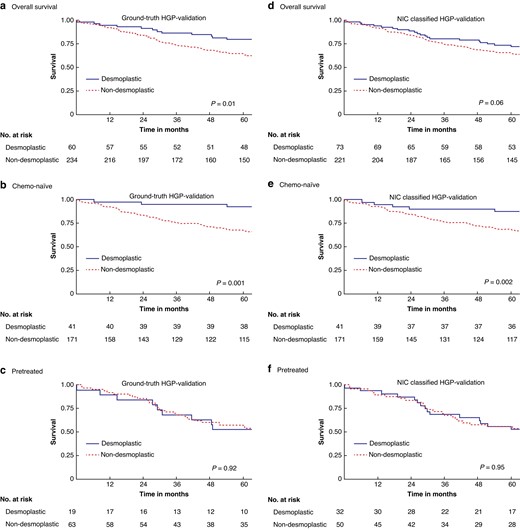
Overall survival (OS) curves for the observer-based (a–c) and neural image compression (NIC) (d–f) classified histopathological growth pattern (HGP) in the validation cohort and stratified for pretreatment (c,f) and chemo-naïve (b,e) patients
Survival analyses on the ground-truth and NIC-classified HGP
| Desmoplastic versus non-desmoplastic | Non-desmoplastic 5-year OS (95% c.i.) | Desmoplastic 5-year OS (95% c.i.) | Desmoplastic versus non-desmoplastic | |
|---|---|---|---|---|
| Univariable HR (95% c.i.) | Multivariable HR (95% c.i.)* | |||
| Development cohort (n = 932) | ||||
| Ground-truth HGP | 40% (36,44) | 63% (57,70) | 0.57 (0.47,0.70) | 0.63 (0.50,0.79) |
| NIC-classified HGP | 40% (37,44) | 60% (54,67) | 0.61 (0.50,0.75) | 0.64 (0.51,0.79) |
| Validation cohort (n = 294) | ||||
| Ground-truth HGP | 64% (58,71) | 80% (70,91) | 0.51 (0.30,0.86) | 0.40 (0.22,0.75) |
| NIC-classified HGP | 66% (60,72) | 73% (63,84) | 0.64 (0.41,1.02) | 0.48 (0.28,0.83) |
*Corrected for age, sex, primary tumour location, pT-stage, pN-stage, disease-free interval, number of CRLM, diameter of largest CRLM, preoperative CEA, and extrahepatic disease. CEA, carcinoembryonic antigen; CRLM, colorectal liver metastasis; HGP, histopathological growth pattern; NIC, neural image compression; OS, overall survival.
Discussion
In this study the authors developed and validated a deep-learning–based pipeline with compression and attention to classify HGP on a large data set of digitalized WSI of resected CRLM without manual input from a clinician. The developed NIC classifier performed similarly across the development and previously unseen external validation cohort, achieving high levels of classifier performance and demonstrating generalizability with a balanced accuracy of ≥ 88%. In addition, the NIC-classified HGP demonstrated similar prognostic impact in terms of OS when compared to observer-based pathologist determination with the added benefit of faster output.
Literature shows that HGP is an independent prognostic factor for survival and there are studies suggesting HGP as a predictive factor for therapeutic effectiveness, making it a clinically highly relevant biomarker2,15,21,43. It is of the utmost importance that such a biomarker is objective and reproducible, independent of the scoring physician. It is known that scoring of HGPs has several caveats, so expertise is necessary. The results of this study demonstrate high levels of HGP classification performance in both the development and validation cohorts (AUC ≥ 0.93), suggesting the development of an objective and reproducible clinically relevant scoring method that can automatically be determined. This will substantially help the implementation of HGPs in daily practice and research.
The attention maps illustrate that the NIC model concentrates on various regions of the slide. By analysing these maps, we can understand which features or regions of the slide are most influential in the model’s assessment of the HGP. This can be particularly useful for identifying potential areas for improvement in the model or for validating that the model is focusing on clinically relevant regions or even potentially to discover new histopathological biomarkers.
Although promising, these results also suggest the limits of the NIC classification pipeline with incorporation of even larger data sets and different immunohistochemical staining. This study includes only two tertiary university hospitals with very high performance both in the development and validation cohorts, which could be a sign of model overfitting to these specific data sets. Additional development and validation cohorts of different centres in multiple countries could improve this model even further and alleviate this problem. A recent study has suggested that a more granular, non-dichotomous approach could potentially offer enhanced prognostic value and stratify patient survival even further than the dichotomous classification. Lastly, this study did not explore how the deep-learning model could be seamlessly integrated into existing clinical workflows. Addressing the practical challenges of implementation in daily clinical practice is essential for ensuring the model’s effective use in real-world settings. Further research is necessary to validate these results44.
In conclusion, these experimental results show that automated NIC-based models are promising to objectively classify HGP following surgical treatment of CRLM.
Funding
This study was partly funded by a grant from Stichting Coolsingel, Rotterdam, the Netherlands, and by the European Union through the Horizon 2020 framework under grant agreement No. 825292 (ExaMode, htttp://www.examode.eu/).
Acknowledgements
D.J.H. and W.A. are contributed equally. F.C. and C.V. are jointly supervised this work.
Disclosure
David Tellez is now affiliated with Aiosyn BV, the Netherlands. Jeroen van der Laak was a member of the advisory boards of Philips, the Netherlands and ContextVision, Sweden, and received research funding from Philips, the Netherlands, ContextVision, Sweden, and Sectra, Sweden in the last 5 years. He is chief scientific officer and a shareholder of Aiosyn BV, the Netherlands. Francesco Ciompi was Chair of the Scientific and Medical Advisory Board of TRIBVN Healthcare, France, and received advisory board fees from TRIBVN Healthcare, France in the last 5 years. He is a shareholder of Aiosyn BV, the Netherlands.
All other authors have no conflict of interests to declare.
Supplementary material
Supplementary material is available at BJS Open online.
Data availability
All clinical data and corresponding digital WSI used in this study are not publicly available but can be requested from and may be provided at the discretion of the corresponding authors of each respective centre and under the provision of appropriate data and material transfer agreements.
All developed deep-learning models are published online and are freely accessible at https://grand-challenge.org/algorithms/colorectal-liver-metastases-survival-prediction upon request. We also provide the code to create the correct input (slide as.tif or.svs file with correct background mask as.tif file) for the algorithm: https://grand-challenge.org/algorithms/tissue-segmentation-and-packing. The source code for NIC is available at https://github.com/DIAGNijmegen/pathology-whole-slide-learning.
Author contributions
Diederik Höppener (Conceptualization, Data curation, Formal analysis, Funding acquisition, Investigation, Methodology, Project administration, Validation, Visualization, Writing—original draft, Writing—review & editing), Witali Aswolinskiy (Conceptualization, Formal analysis, Funding acquisition, Investigation, Methodology, Project administration, Visualization, Writing—original draft, Writing—review & editing), Zhen Qian (Visualization, Writing—review & editing), David Tellez (Writing—review & editing), Pieter Nierop (Writing—review & editing), Martijn Starmans (Writing—review & editing), Iris Nagtegaal (Writing—review & editing), Michail Doukas (Writing—review & editing), Johannes De Wilt (Writing—review & editing), Dirk Grünhagen (Writing—review & editing), Jeroen van der Laak (Writing—review & editing), Peter Vermeulen (Writing—review & editing), Francesco Ciompi (Conceptualization, Funding acquisition, Project administration, Supervision, Writing—review & editing), and Cornelis Verhoef (Conceptualization, Funding acquisition, Project administration, Supervision, Writing—review & editing)
