


Abstract
Oesophageal cancer, in particular adenocarcinoma, has a strong male predominance. However, the impact of patient sex on operative and oncologic outcomes and recovery of health-related quality of life is poorly documented, and was the focus of this large multicentre cohort study.
All consecutive patients who underwent oncological oesophagectomy from 2009 to 2015 in the 20 European iNvestigation of SUrveillance after Resection for Esophageal cancer study group centres were assessed. Clinicopathologic variables, therapeutic approach, postoperative complications, survival and health-related quality of life data were compared between male and female patients. Multivariable analyses adjusted for age, sex, tumour histology, treatment protocol and major complications. Specific subgroup analyses comparing adenocarcinoma versus squamous cell cancer for all key outcomes were performed.
Overall, 3974 patients were analysed, 3083 (77.6%) male and 891 (22.4%) female; adenocarcinoma was predominant in both groups, while squamous cell cancer was observed more commonly in female patients (39.8% versus 15.1%, P < 0.001). Multivariable analysis demonstrated improved outcomes in female patients for overall survival (HRmales 1.24, 95% c.i. 1.07 to 1.44) and disease-free survival (HRmales 1.22, 95% c.i. 1.05 to 1.43), which was caused by the adenocarcinoma subgroup, whereas this difference was not confirmed in squamous cell cancer. Male patients presented higher health-related quality of life functional scores but also a higher risk of financial problems, while female patients had lower overall summary scores and more persistent gastrointestinal symptoms.
This study reveals uniquely that female sex is associated with more favourable long-term survival after curative treatment for oesophageal cancer, especially adenocarcinoma, although long-term overall and gastrointestinal health-related quality of life are poorer in women.
Introduction
Oesophageal cancer (OC) has a strong male predominance, accounting for 75–89% of patients in published series1–3. Recently, sex-related differences have been suggested in OC cancer biology, in terms of treatment response, toxicity and oncologic outcomes4,5. Furthermore, female patients experience higher toxicity from standard doses of systemic chemotherapy than males, which cannot solely be attributed to lean body mass differences5. Moreover, among patients with OC of similar stage and tumour location, female patients were reported to receive less often transthoracic oesophagectomy and neoadjuvant therapy6,7, or even cancer-specific systemic treatment in case of metastatic/advanced disease8.
Sex-related differences have previously been described in gastric and colorectal cancer for instance, where an obvious link between hormonal drive and tumour progression is not known to exist7,9. Such results have also been described for OC, where male patients were reported to have poorer long-term survival after surgery3,6,10. A Swedish nationwide study reported a prognostic advantage for female patients with oesophageal squamous cell cancer (SCC), whereas no such difference was observed for adenocarcinoma (AC)11. In addition, health-related quality of life (HRQoL) is another major long-term issue in OC patients12. The LASER (Lasting Symptoms after Esophageal Resection) study revealed that 66.9% of patients have persistent symptoms impacting HRQoL 1 year after oesophagectomy; however, the potential impact of patient sex was not specifically assessed13,14. Thus, despite a suggestion of a multifaceted impact of patient sex on OC, the underlying mechanisms and specific impact on key outcome measures remain poorly understood.
The aim of the present study, drawing on a population of almost 4000 patients from the ENSURE (European iNvestigation of SUrveillance after Resection for Esophageal cancer) registry, was to explore potential sex-related differences in treatment strategies, operative and oncologic outcomes, as well as HRQoL after OC treatment with curative intent.
Methods
Inclusion criteria
All consecutive patients operated on for OC between January 2009 and June 2015 in the 20 participating European and North-American centres of the ENSURE study group were assessed for eligibility (Table S1). Inclusion criteria were age >18 years, treatment with curative intent including surgery, upfront, after neoadjuvant therapy or salvage, for any histological type of non-metastatic (TxNxM0) cancer of the oesophagus or the oesophagogastric junction (Siewert I–III). Patients treated with definitive chemoradiation alone were excluded.
Study endpoint definitions
Long-term survival was assessed by means of overall survival (OS), disease-specific survival (DSS) and disease-free survival (DFS). Treatment allocation was assessed via the following surrogate endpoints: access to systemic oncological treatment (neoadjuvant, or in case of cancer recurrence) and choice of surgical approach. To assess HRQoL, the EORTC (European Organisation for Research and Treatment of Cancer) QLQ-30 questionnaire15 was collected from patients who were recurrence free at 1 year after surgery, through database matching with the LASER dataset13.
Postoperative complications were recorded and graded according to the validated 5-scale Clavien–Dindo system. All complications, including mortality rate, are reported for the entire hospital stay after the index operation (in-hospital)16. Anastomotic leak and all other specific complication types were universally defined as per the ECCG (Esophagectomy Complications Consensus Group) expert consensus17. For HRQoL items, each Likert-scale answer was linearly transformed to a 0–100 scale continuous variable, with a > 10-point difference considered clinically relevant. Higher HRQoL and functional scales illustrate a better functional level, whereas higher symptom scale scores correspond to higher symptom burden. All outcomes of the EORTC QLQ-30 questionnaire, including financial problems, were self-reported18.
Data collection and ethical considerations
Data for the present analysis were prospectively collected within the institutional databases of participating centres. The study was registered in clinicaltrials.gov (NCT03461341) and approved by the primary investigator centre (St James’ Hospital, Dublin, Ireland, approval number #4982, SJH/Tallaght University Hospital Research Ethics Committee #2018-08-CA). All participating centres obtained approval from local institutional review boards, according to local policies (e.g. Vaud Ethics Committee CER-VD #2022-00123). The study was conducted according to the Declaration of Helsinki for medical research.
Statistical analysis
All relevant clinicopathologic variables were compared between male and female patients. The χ2 test was used for categorical variables, while continuous data were compared with the t-test and Satterthwaite correction for unequal variances. For time-to-event outcomes, the Kaplan–Meier method and log-rank test were used, while HRQoL variables were expressed with mean scores and standard deviation (s.d.). Multivariable Cox regression was performed for all survival outcomes adjusted for age, ASA class, patient sex, histological type, cN stage, treatment protocol (neoadjuvant treatment, upfront surgery, definitive chemoradiation) and occurrence of major postoperative complications (Clavien ≥ IIIa). For HRQoL continuous outcome variables, multivariable linear regression adjusted for age, sex, histological type, treatment protocol and major postoperative complications (Clavien ≥ IIIa) was performed. Missing data are reported in detail for all studied variables. For multivariable analyses, multiple imputation was performed for missing values.
Planned subgroup analyses for patients with AC and SCC were performed for all selected outcomes (treatment allocation, survival and HRQoL). Two-tailed P < 0.05 was the threshold for statistical significance. All statistical analyses were conducted by a dedicated biostatistician (A.J.), using the SAS 9.4 software (SAS Institute Inc., Cary, NC, USA).
Results
Overall, 3974 patients (3083 (77.6%) male and 891 (22.4%) female) were included in the present study. Baseline characteristics are detailed in Table 1 for the whole cohort and stratified by sex, and in Table S2 stratified separately by histological type.
Baseline patient and tumour characteristics stratified by patient sex
| All N = 3974 | Male N = 3083 | Female N = 891 | P value | |
|---|---|---|---|---|
| ASA class | 0.001 | |||
| I | 1003 (25.2) | 740 (24.0) | 263 (29.5) | |
| II | 1947 (49.0) | 1525 (49.5) | 422 (47.4) | |
| III | 861 (21.7) | 693 (22.4) | 168 (18.9) | |
| Missing data | 163 (4.1) | 125 (4.1) | 38 (4.2) | |
| ECOG performance status | 0.412 | |||
| 0 | 1370 (34.5) | 1069 (34.7) | 301 (33.8) | |
| 1 | 878 (22.1) | 687 (22.2) | 191 (21.4) | |
| 2 | 139 (3.5) | 101 (3.3) | 38 (4.3) | |
| 3 | 20 (0.5) | 17 (0.6) | 3 (0.3) | |
| Missing data | 1567 (39.4) | 1209 (39.2) | 358 (40.2) | |
| Histological type | <0.001 | |||
| Adenocarcinoma | 2845 (71.6) | 2389 (77.5) | 456 (51.2) | |
| Squamous cell cancer | 822 (20.7) | 467 (15.1) | 355 (39.8) | |
| Other | 307 (7.7) | 227 (7.4) | 80 (9) | |
| Tumour site | <0.001 | |||
| OGJ | 1515 (38.1) | 1257 (40.8) | 258 (29.0) | |
| Distal oesophagus | 1568 (39.4) | 1237 (40.1) | 331 (37.1) | |
| Middle third | 552 (13.9) | 331 (10.7) | 221 (24.8) | |
| Upper third | 82 (2.1) | 58 (1.9) | 24 (2.7) | |
| Missing data | 257 (6.5) | 200 (6.5) | 57 (6.4) | |
| Barrett’s metaplasia | 844 (21.2) | 710 (23.0) | 134 (15.0) | <0.001 |
| Missing data | 892 (22.4) | 673 (21.8) | 219 (24.6) | |
| cT stage | 0.104 | |||
| 0 | 42 (1.1) | 29 (0.9) | 13 (1.5) | |
| 1 | 415 (10.4) | 315 (10.2) | 100 (11.2) | |
| 2 | 713 (17.9) | 536 (17.4) | 177 (19.8) | |
| 3 | 2202 (55.5) | 1737 (56.3) | 465 (52.2) | |
| 4 | 168 (4.2) | 135 (4.4) | 33 (3.7) | |
| Missing data | 434 (10.9) | 331 (10.7) | 103 (11.6) | |
| cN stage | <0.001 | |||
| 0 | 1206 (30.3) | 890 (28.9) | 316 (35.5) | |
| 1 | 1501 (37.8) | 1185 (38.4) | 316 (35.5) | |
| 2 | 743 (18.8) | 606 (19.6) | 137 (15.4) | |
| 3 | 77 (1.9) | 58 (1.9) | 19 (2.1) | |
| Missing data | 447 (11.2) | 344 (11.1) | 103(11.6) | |
| cM1 stage | 58 (1.5) | 46 (1.5) | 12 (1.4) | 0.736 |
| Missing data | 89 (2.2) | 73 (2.4) | 16 (1.8) |
Values are n (%). ECOG, Eastern Cooperative Status Scale; ASA, American Society of Anesthesiologists; OGJ, oesophagogastric junction.
The predominant histological type was AC in both groups; however, the proportion of SCC was significantly higher among female patients (39.8% versus 15.1%, P < 0.001), who also presented with more middle-third lesions (24.8% versus 10.7%, P < 0.001) and less extensive lymphatic spread at baseline (cN0 in 35.5% female patients versus 28.9% male patients, P < 0.001), despite a similar cT stage. Higher rates of cN0 in women were confirmed in AC (39.5% versus 30.8% men, P = 0.001), but not in the SCC subtype (Table S2). R0 resection rates and mean lymph node yield were similar for all patients (Table 2). In the whole cohort, more advanced (y)pT and (y)pN stages were observed in male patients, together with a worse pathologic response to neoadjuvant treatment (Tumour Regression Grade (TRG) 4–5 in 22.3% male patients versus 18.3% female patients, P = 0.006). However, such differences in pathologic stage and tumour regression were not confirmed in a separate analysis of AC and SCC subgroups (Table S3).
Histopathologic characteristics stratified by patient sex
| All N = 3974 | Male N = 3083 | Female N = 891 | P value | |
|---|---|---|---|---|
| (y)pT stage | <0.001 | |||
| 0 | 434 (10.9) | 298 (9.7) | 136 (15.3) | |
| Tis/high-grade dysplasia | 51 (1.3) | 35 (1.1) | 16 (1.8) | |
| 1 | 825 (20.8) | 641 (20.8) | 184 (20.7) | |
| 2 | 584 (14.7) | 455 (14.8) | 129 (14.5) | |
| 3 | 1832 (46.1) | 1464 (47.5) | 368 (41.3) | |
| 4 | 189 (4.8) | 148 (4.8) | 41 (4.6) | |
| Missing data | 59 (1.5) | 42 (1.4) | 17 (1.9) | |
| (y)pN stage | <0.001 | |||
| 0 | 1869 (47.0) | 1397 (45.3) | 472 (53.0) | |
| 1 | 819 (20.6) | 653 (21.2) | 166 (18.6) | |
| 2 | 846 (21.3) | 668 (21.7) | 178 (20.0) | |
| 3 | 359 (9.0) | 393 (12.7) | 56 (6.3) | |
| Missing data | 81 (2.0) | 62 (2.0) | 19 (2.1) | |
| (y)pM1 stage | 90 (2.3) | 65 (2.1) | 25 (2.8) | 0.229 |
| Missing data | 38 (0.9) | 34 (1.1) | 4 (0.4) | |
| Differentiation | 0.005 | |||
| G0 | 440 (11.1) | 315 (10.2) | 125 (14.0) | |
| G1 | 356 (9.0) | 276 (9.0) | 80 (9.0) | |
| G2 | 1118 (28.1) | 878 (28.5) | 240 (26.9) | |
| G3 | 1091 (27.5) | 874 (28.3) | 217 (24.4) | |
| Signet-ring cell | 63 (1.6) | 53 (1.7) | 10 (1.1) | |
| Missing data | 906 (22.8) | 687 (22.3) | 219 (24.6) | |
| Lymphatic invasion (L1) | 1044 (26.3) | 841 (27.3) | 203 (22.8) | 0.005 |
| L0 | 2091 (52.6) | 1592 (51.6) | 499 (56.0) | |
| Missing data | 839 (21.1) | 650 (21.1) | 189 (21.2) | |
| Venous invasion (V1) | 1077 (27.1) | 862 (27.9) | 215 (24.1) | 0.024 |
| V0 | 2273 (57.2) | 1740 (56.4) | 533 (59.8) | |
| Missing data | 624 (15.7) | 481 (15.6) | 143 (16.0) | |
| Perineural invasion (Pn1) | 730 (18.4) | 608 (19.7) | 122 (13.7) | <0.001 |
| Pn0 | 2231 (56.1) | 1707 (55.3) | 524 (58.8) | |
| Missing data | 1013 (25.5) | 768 (24.9) | 245 (27.5) | |
| Resection margin (R) status | 0.900 | |||
| R0 | 3394 (85.4) | 2629 (85.3) | 765 (85.9) | |
| R1 | 517 (13.0) | 405 (13.1) | 112 (12.6) | |
| R2 | 17 (0.4) | 13 (0.4) | 4 (0.4) | |
| Missing data | 46 (1.2) | 36 (1.2) | 10 (1.1) | |
| Mandard regression grade* | 0.006 | |||
| TRG 1 | 331 (8.3) | 242 (7.8) | 89 (10.0) | |
| TRG 2 | 310 (7.8) | 247 (8.0) | 63 (7.1) | |
| TRG 3 | 354 (8.9) | 281 (9.1) | 73 (8.2) | |
| TRG 4 | 532 (13.4) | 429 (13.9) | 103 (11.6) | |
| TRG 5 | 318 (8.0) | 258 (8.4) | 60 (6.7) | |
| Missing data | 837 (21.1) | 661 (21.4) | 176 (19.8) | |
| Number of lymph nodes involved | 2.3(4.2) | 2.4(4.4) | 1.8(3.6) | <0.001 |
| Number of lymph nodes analysed | 26.1(14.0) | 26.2(14.1) | 25.8(13.8) | 0.445 |
Continuous variables are expressed as mean(s.d.) and categorical variables as n (%). *TRG, tumour regression grade (only available in patients that underwent neoadjuvant chemotherapy).
The total hospital stay was longer in female patients (mean(s.d.) 22.7(23) versus 20.2(20.9), P = 0.005), as was the incidence of major postoperative complications (34.9% female patients versus 30.8% male patients, P = 0.023). Major morbidity rate did not present significant differences within the two main histological groups (AC, SCC). Overall morbidity rate, the rates of specific complications such as pulmonary complications or anastomotic leakage as well as in-hospital mortality rate did not differ between male and female patients (Table S4).
Influence of patient sex on treatment modalities
Choice of treatment strategy
Overall, 58.5% of patients received neoadjuvant treatment (NAT), with similar rates between sexes (Table S5). Patient sex was not associated with access to NAT within the whole cohort (adjusted OR 1.18, 95% c.i. 0.78 to 1.43). In the AC group, male patients had increased use of NAT compared with female patients both in univariable and multivariable analysis (adjusted OR 1.28, 95% c.i. 1.01 to 1.62), which was not observed in patients with SCC (adjusted OR 1.05, 95% c.i. 0.73 to 1.52).
In the whole cohort, women more frequently underwent upfront surgery than men (24.7% versus 19.3%, P = 0.014), whereas rates of definitive chemoradiation (dCRT) and salvage surgery were similar (2% in male patients versus 1.5% in female patients). In the AC group, women presented with earlier cN disease stage and they more often received upfront surgery, whereas rates of dCRT were comparable with male patients (1% male versus 0.4% female). In the SCC group, where no baseline stage differences were observed, treatment protocol choices were similar, including dCRT rates (2.6% versus 1.7% respectively) (Table S5). Characteristics of patients treated with upfront surgery and dCRT are presented in Table S6, with no significant staging or baseline differences among men and women, apart from higher ASA scores in male patients operated on upfront.
In patients with cancer recurrence, no differences were found in the modalities used for recurrence treatment (radiation in 10.6% male and 9.9% female patients, chemotherapy in 19.1% men and 15.5% women). Patient sex was not independently associated with cancer-specific recurrence treatment in the AC (adjusted OR 1.28, 95% c.i. 0.98 to 1.68) or the SCC subgroups (adjusted OR 0.89, 95% c.i. 0.59 to 1.35).
Surgical approach
Ivor Lewis resection was the predominant approach in both groups (49.1% men versus 41.9% women, P < 0.001) (Table S5). Within the AC subtype, female patients had lower rates of Ivor Lewis resection (42.8% versus 50.4% in men, P < 0.001) despite similar tumour location; such a difference was not observed in patients with SCC (Table S5). Open surgery was more frequently performed in female patients (69.7% versus 66.3%, P = 0.016) (Table S5). Indeed, male sex was independently associated with the use of a hybrid minimally invasive approach in the whole cohort (adjusted OR 1.29, 95% c.i. 1.00 to 1.66), as well as the SCC subgroup (adjusted OR 1.93, 95% c.i. 1.08 to 3.44). No difference was observed for the totally minimally invasive approach (adjusted OR 1.02, 95% c.i. 0.80 to 1.30).
Long-term survival and recurrence patterns
In the whole cohort, median OS was 31.6 months (95% c.i. 12.8 to 58.6) in male versus 38.1 months (95% c.i. 15.2 to 60) in female patients (P < 0.001), whereas median DFS was 26.7 months (95% c.i. 10.1 to 57.5) and 36.3 months (95% c.i. 12.1 to 60 months) respectively (P < 0.001). In multivariable analysis, male sex was associated with poorer long-term OS (HR 1.24, 95% c.i. 1.07 to 1.44) and DFS (HR 1.22, 95% c.i. 1.05 to 1.43), while DSS was similar (HR 1.18, 95% c.i. 0.99 to 1.40) (Table 3).
Multivariable Cox analyses for overall, disease-free and disease-specific survival
| HR adj | 95% c.i. | P value | HR adj | 95% c.i. | P value | HR adj | 95% c.i. | P value | |
|---|---|---|---|---|---|---|---|---|---|
| Overall survival (OS) | Disease-free survival (DFS) | Disease-specific survival (DSS) | |||||||
| Age (years) | 1.01 | 1.00–1.02 | 0.002 | 0.99 | 0.99–1.00 | 0.234 | 1.00 | 0.99–1.01 | 0.696 |
| ASA class | 0.012 | 0.280 | 0.408 | ||||||
| I | 0.846 | 0.72–1.00 | 1.00 | 0.84–1.19 | 0.97 | 0.80–1.18 | |||
| II | 0.813 | 0.71–0.93 | 0.91 | 0.78–1.06 | 0.90 | 0.77–1.06 | |||
| III | Ref | Ref | Ref | Ref | Ref | Ref | |||
| Sex | 0.005 | 0.011 | 0.054 | ||||||
| Male | 1.24 | 1.07–1.44 | 1.22 | 1.05–1.43 | 1.18 | 0.99–1.40 | |||
| Female | Ref | Ref | Ref | Ref | Ref | Ref | |||
| Histologic type | 0.495 | 0.163 | 0.106 | ||||||
| AC | 1.08 | 0.92–1.28 | 1.19 | 0.99–1.42 | 1.22 | 0.99–1.49 | |||
| Other | 1.15 | 0.91–1.45 | 1.21 | 0.93–1.56 | 1.30 | 0.98–1.71 | |||
| SCC | Ref | Ref | Ref | Ref | Ref | Ref | |||
| cN stage | <0.001 | <0.001 | <0.001 | ||||||
| 0 | 0.41 | 0.28–0.61 | 0.43 | 0.29–0.65 | 0.37 | 0.24–0.57 | |||
| 1 | 0.55 | 0.38–0.80 | 0.56 | 0.38–0.84 | 0.53 | 0.35–0.79 | |||
| 2 | 0.60 | 0.41–0.89 | 0.64 | 0.42–0.95 | 0.54 | 0.35–0.82 | |||
| 3 | Ref | Ref | Ref | Ref | Ref | Ref | |||
| Treatment protocol | <0.001 | <0.001 | <0.001 | ||||||
| dCRT + salvage surgery | 0.95 | 0.67–1.33 | 0.76 | 0.51–1.13 | 0.76 | 0.49–1.18 | |||
| Upfront surgery | 0.72 | 0.61–0.86 | 0.55 | 0.45–0.67 | 0.55 | 0.44–0.68 | |||
| Surgery + adjuvant CT | 1.39 | 1.10–1.77 | 1.58 | 1.24–2.00 | 1.53 | 1.19–1.98 | |||
| nCRT + surgery | 1.09 | 0.95–1.26 | 1.08 | 0.94–1.25 | 1.06 | 0.90–1.23 | |||
| nCT + surgery | Ref | Ref | Ref | Ref | Ref | Ref | |||
| Postoperative complications* | <0.001 | <0.001 | <0.001 | ||||||
| None or minor | 0.57 | 0.50–0.64 | 0.77 | 0.68–0.88 | 0.74 | 0.64–0.86 | |||
| Major | Ref | Ref | Ref | Ref | Ref | Ref | |||
HRadj, adjusted hazard ratio; AC, adenocarcinoma; SCC, squamous cell carcinoma; (n)CT, (neoadjuvant)chemotherapy; (n/d)CRT, (neoadjuvant/definitive)chemoradiation; MIE, minimally invasive oesophagectomy; Ref, reference group. *Postoperative complications are graded according to the to the Clavien–Dindo scale16. Minor are considered as grade < IIIa and major as grade ≥ IIIa.
Within the AC subgroup, male patients had a median OS of 32.0 months (95% c.i. 12.9 to 58.8) versus 37.6 months (95% c.i. 14.8 to 60) for females (P = 0.011), whereas median OS in the SCC subgroup was 30.4 months (95% c.i. 12.2 to 56.1) in men versus 38.9 months (95% c.i. 15.8 to 60) in women (P = 0.002) (Fig. 1). Male patients with AC had poorer OS (adjusted HR 1.42, 95% c.i. 1.07 to 1.89) and DFS (adjusted HR 1.25, 95% c.i. 1.03 to 1.52); however, in the SCC group, no survival differences remained significant in multivariable analysis (Table S7).
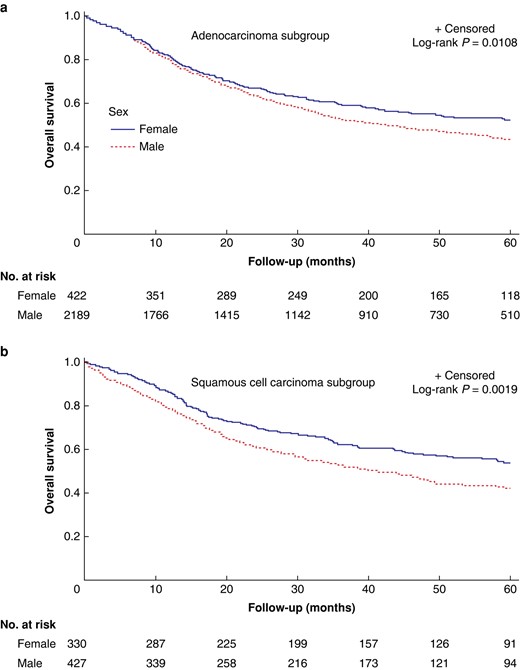
Overall survival for male versus female patients in the ENSURE study.
Recurrence patterns were similar in both sexes, with local recurrence observed in 18.3% male and 18.1% female patients, and distant recurrence in 33.1% and 26.7% respectively. Within histological subgroup analyses, no significant differences were observed in local or distant recurrence rates for patients with AC or SCC (Table S5).
HRQoL after oesophagectomy
Figure 2 illustrates the adjusted mean scores of all QLQ-30 items. In multivariable linear regression, male patients had better scores of physical functioning (mean 79.1 (95% c.i. 72.9 to 85.3) versus 73.3 (95% c.i. 66.5 to 80.1) in female patients, P = 0.017) (detailed data in Table S8). Among specific symptoms, nausea-vomiting scores were higher in women (mean 23.1 (95% c.i. 15.2 to 31.1) versus 16.1 (95% c.i. 8.9 to 23.4) in men, P = 0.013). In multivariable linear regression, male sex remained independently associated with higher mean HRQoL summary scores (77.5 (95% c.i. 72.1 to 82.9) versus 72.6 (95% c.i. 66.7 to 78.6) in females, P = 0.022, Table S9). In this model, lower ASA class was also associated with higher HRQoL scores, whereas histological type, treatment protocol and surgical approach were not significant (Table S9). Within patients with AC, men presented higher physical functioning scores (mean 80.6 (95% c.i. 74.1 to 87.2) versus 73.8 (95% c.i. 65.8 to 81.9) in women, P = 0.023), but also more financial problems (mean score 9.7 (95% c.i. 1.1 to 18.2) versus 1.9 (95% c.i. −8.8 to 12.5), P = 0.049). In the SCC subgroup, female patients had higher scores of persistent diarrhoea (22.9 (95% c.i. 12.8 to 33.0) versus 11.9 (95% c.i. 1.2 to 22.7) in male patients, P = 0.043) (Table S8).
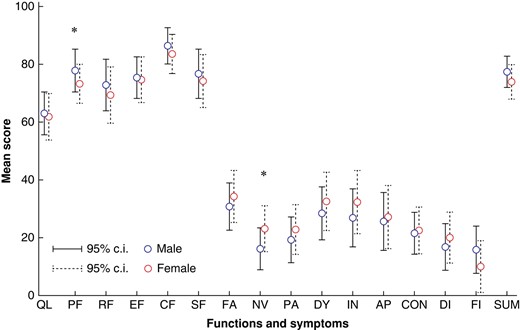
Adjusted results of health-related quality of life (HRQoL) variables for male and female patients.
Discussion
In this large series drawn from the ENSURE study database, whose goal was to determine whether sex-related differences exist in oncologic, operative and HRQoL outcomes in the curative management of OC, several key findings emerged. First, female patients had improved long-term OS and DFS after curative treatment, especially in the AC subgroup. Second, although operative complication types, frequency and postoperative mortality rate were similar, more severe complications occurred in women. Finally, in terms of HRQoL in disease-free patients, men had higher functional and overall scores but also a higher risk of financial problems, while women had higher rates of persistent nausea and vomiting as well as diarrhoea in SCC.
There is a clear male predominance in OC, particularly AC, although the physiopathology remains unclear. Female sex hormones are purported to play a protective role against the malignant transformation process of AC8,10,19. Conversely, increased rates of SCC are documented in women, although exposure to alcohol and tobacco remains lower than in men3,20–23. Human papilloma virus (HPV)-16 exposure may also be carcinogenic, but the impact of sex in this regard is unknown24. Prior mediastinal radiation (e.g. for lymphoma, breast cancer) might also contribute to sex-related differences in SCC incidence; however, such data were unavailable for our analysis. In terms of management, a sex-related treatment gap has been reported7,20, with female patients less frequently receiving neoadjuvant treatment for locally advanced OC, and less systemic chemotherapy for metastatic disease8. In the present study, such treatment allocation differences could not be confirmed, neither in the neoadjuvant setting nor in the cancer-specific treatment of recurrence.
Overall, female patients presented with earlier disease stage (cN0) upon diagnosis, consistent with previously published studies25. The key finding of this study is an improved overall and disease-free survival in female patients, after similar treatments with curative intent. Although some authors previously found no sex-related survival differences in OC23, recent Swedish registry data revealed improved 5-year survival in female patients with SCC both after either curative surgery or dCRT6,11,26, which is also in accordance with reports from Japan3,21. The present study, including patients from a variety of European and North-American centres, highlights that survival was improved for women in the AC group, even after adjusting for confounders such as cN stage, ASA class and type of treatment modality. To explain these survival differences, a difference in treatment efficacy in AC might be assumed. However, the original CROSS (Chemoradiotherapy for Oesophageal Cancer Followed by Surgery Study) trial revealed a more pronounced treatment effect of nCRT in male patients compared with female patients27. In the present analysis, the predominant SCC subtype in females is thought to account for the better histologic response to neoadjuvant treatment, as no sex-related differences in ypTNM or TRG were observed within separate histological subtypes. As the baseline differences in cN0 stage and treatment modalities were adjusted for in all multivariable analyses, inherent biologic differences may also be suggested to explain outcome differences between male and female patients with OC, as previously described in gastric7 and colon cancer9. Indeed, oestrogen receptor β (ERβ) is strongly expressed on the nucleus of oesophageal AC cells28,29. When activated it entails an arrest of the cell cycle, leading to antiproliferative (tumour suppressor)activity28. Although the interplay between circulating sex hormones and hormone receptors in OC cancer cells could provide a pathophysiological basis to explain differences in tumour progression and survival, further research is needed to delve into this hypothesis.
In the present series, women had significantly higher rates of major postoperative complications. Previously, a large American cohort displayed higher rates of mortality and failure to rescue in female compared with male patients presenting with acute surgical pathologies of similar severity30. Potential sex-related disparities at presenting symptoms, time to diagnosis and aggressive care were suggested to explain this intriguing finding. In the present study, although the higher rates of severe complications observed in females might be partly attributed to the increased rates of open and salvage surgery, some further hypotheses can be made. Baseline performance status was similar and ASA class was even lower in female patients; however, these surrogate parameters may be misleading, as they do not accurately reflect sarcopenia and physiological reserves. In a series of patients with lung cancer, Rizzo et al. described higher rates of sarcopenia and muscle wasting in female patients compared with male patients of similar BMI; in turn, sarcopenia increases the risk of postoperative complications31,32. Thus, more precise screening methods are needed to determine physical status and conditioning in patients with OC, given their prognostic value on postoperative outcomes. The longer hospital stay observed in women may also be a consequence of a more severe postoperative morbidity rate in the overall cohort, though it may also reflect the potential loss of autonomy and unavailability of caregivers for patients undergoing oesophagectomy20. In several sociocultural contexts, female caregivers may be more readily available to take charge of a convalescent spouse/family member after oesophagectomy. However, as discharge criteria may vary among participating centres in our series, precise factors influencing duration of stay cannot be analysed in further detail.
With a reduction in operative mortality rate and improved survival rates, clinical research is increasingly focused on HRQoL. Previous data from the field of rectal cancer surgery demonstrated better functional outcomes, lower pain levels and less invalidating gastrointestinal symptoms in male patients 2 years after treatment33. The present analysis is the first, to the authors' knowledge, to report long-term HRQoL differences between male and female patients with OC. Although mean differences were not large per se and thus need to be interpreted with caution, patient sex remained independently associated with HRQoL outcomes in multivariable analysis, after adjusting for ASA class, histological type, treatment protocol and surgical approach. Female patients had higher rates of persistent gastrointestinal symptoms, while male patients presented better functional and overall HRQoL scores, resulting in a quicker return to everyday activity, but interestingly, also a higher risk of financial problems. Although caution is needed to not oversimplify a family model financially dependent on men’s income, we need to consider the risk of financial toxicity induced by OC and its management, especially in young patients34. These findings merit prospective assessment, allowing to incorporate within long-term follow-up the myriad nutritional, psychosocial and financial implications on OC and its therapy, and the differential challenges that sex and age may present.
The authors acknowledge some limitations in this study. The risk of confounding when assessing the main endpoints of the study has been addressed by performing separate subgroup analyses for each histological type, and multivariable analyses to adjust for the most clinically relevant confounding variables. However, there is still a risk that non-identified confounders may introduce bias to our results, with previously published studies reporting treatment allocation differences for OC patients even among European countries35. Namely, demographic parameters such as previous mediastinal radiation, dietary habits, HPV infection or oesophageal motor disorders are not available for our patient cohort. In addition, patient choices and rationale for initial treatment allocation (for example to dCRT versus neoadjuvant CRT in SCC patients), as well as the proportion of patients not proceeding to surgery after neoadjuvant treatment, are not reflected in our results. Similarly, precise data on dCRT regimens are unavailable in our dataset. As high-dose (>55 Gy) radiation is known to increase postoperative complications after salvage oesophagectomy36, these details might have provided some further insight into the differences in postoperative morbidity rate observed in our study. A prospective cohort study including extensive demographic, patient- and treatment-related data might limit this drawback, as well as the missing data issue, inherent to the retrospective design. As the database created for the ENSURE study37 includes a large panel of prospectively collected data, we strongly believe that robust statistical methodology allows meaningful conclusions that reflect current practice and outcomes in a Western-world OC population.
In conclusion, the present study illustrates that female patients display improved overall and disease-free survival after curative treatment of OC, although long-term overall HRQoL and functional recovery was found to be better in male patients. These data should encourage large-network prospective clinical and scientific research on the impact of sex on the key outcome measures of OC in treatment and survivorship.
Collaborators
Hans Van Veer, Lieven Depypere, Willy Coosemans, Philippe Nafteux, Paul Carroll, Frances Allison, Gail Darling, John M. Findlay, Serenydd Everden, Nicholas D. Maynard, Arun Ariyarathenam, Grant Sanders, Shameen Jaunoo, Pritam Singh, Simon Parsons, John Saunders, Ravinder Vohra, Aaditya Sinha, Benjamin H.L. Tan, John G. Whiting, Piers R. Boshier, Sheraz R. Markar, Giovanni Zaninotto, George B. Hanna, Alexander W. Phillips, S. Michael Griffin, Robert C. Walker, Tim J. Underwood, Guillaume Piessen, Jorg Theisen, Hans Friess, Christiane J. Bruns, Wolfgang Schröder, Chris G. Collins, Oliver J. McAnena, Siobhan Rooney, Aoife Quinn, Conor Toale, Thomas J. Murphy, Jessie A. Elliott, Narayanasamy Ravi, Claire L. Donohoe, John V. Reynolds, Marco Scarpa, Romeo Bardini, Silvia Degasperi, Luca Saadeh, Carlo Castoro, Rita Alfieri, Eleonora Pinto, Genny Mattara, Marianne C Kalff, Suzanne S. Gisbertz, Mark I. van Berge Henegouwen, Sander J.M. van Hootegem, Sjoerd M. Lagarde, B. Feike Kingma, Lucas Goense, Jelle P. Ruurda, Richard van Hillegersberg, Raymond Kennedy, P. Declan Carey, Leanne Prodehl, Peter J. Lamb, Richard J.E. Skipworth, Mariagiulia Dal Cero, Manuel Pera, Biying Huang, Fredrik Klevebro, Magnus Nilsson, Asif Johar, Pernilla Lagergren, Gustav Linder, Magnus Sundbom, Styliani Mantziari, Markus Schäfer and Nicolas Demartines.
Funding
This work is funded by the Irish Cancer Society (Research Grant CRDF22ELL). The opinions, findings and conclusions or recommendations expressed in this material are those of the authors and do not necessarily reflect the view of the Irish Cancer Society. The funding sources did not have any role in study design; in the collection, analysis and interpretation of data; in the writing of the report; or in the decision to submit the paper for publication.
Acknowledgements
The authors would like to acknowledge the contributions of Sinead King, St. James’s Hospital, Dublin, Ireland; Hannah Adams, Gloucestershire Hospitals NHS Foundation Trust, UK; Masaru Hayami, CLINTEC, Karolinska Institutet, Stockholm, Sweden; and Sandrine Geinoz, Lausanne University Hospital, Switzerland,
Disclosure
M.I.vB.H. is a consultant for Viatris, Johnson & Johnson, Alesi Surgical, BBraun and Medtronic, and received unrestricted research grants from Stryker. All fees paid to the institution. The authors declare no other conflict of interest.
Supplementary material
Supplementary material is available at BJS Open online.
Data availability
The primary data presented in the current work are not publicly available, but can be provided upon request to the corresponding author.
Author contributions
Styliani Mantziari (Conceptualization, Formal analysis, Investigation, Methodology, Project administration, Resources, Validation, Visualization, Writing—original draft, Writing—review & editing), Jessie Elliott (Conceptualization, Data curation, Funding acquisition, Investigation, Validation, Visualization, Writing—original draft, Writing—review & editing), Sheraz Markar (Investigation, Methodology, Supervision, Validation, Visualization, Writing—original draft, Writing—review & editing), Fredrik Klevebro (Data curation, Validation, Visualization, Writing—review & editing), Lucas Goense (Data curation, Validation, Visualization, Writing—review & editing), Asif Johar (Formal analysis, Investigation, Methodology, Software, Validation, Visualization, Writing—review & editing), Pernilla Lagergren (Conceptualization, Investigation, Methodology, Validation, Visualization, Writing—original draft, Writing—review & editing), Giovanni Zaninotto (Supervision, Validation, Visualization, Writing—review & editing), Richard Van Hillegersberg (Supervision, Validation, Visualization, Writing—review & editing), Mark I. van Berge Henegouwen (Investigation, Supervision, Validation, Visualization, Writing—review & editing), Markus Schäfer (Validation, Visualization, Writing—review & editing), Magnus Nilsson (Supervision, Validation, Visualization, Writing—review & editing), George Hanna (Supervision, Validation, Visualization, Writing—review & editing) and John Reynolds (Conceptualization, Data curation, Methodology, Supervision, Validation, Visualization, Writing—original draft, Writing—review & editing).
References
Author notes
Members of the ENSURE Study Group are co-authors of this study and are listed under the heading Collaborators.
Presented in parts to the 30th European Surgical Association (ESA) Conference, Bordeaux, France, May 2023
