


Abstract
This study aimed to develop and validate a model based on the collagen signature and systemic immune-inflammation index to predict prognosis in rectal cancer patients who underwent neoadjuvant treatment.
Patients with rectal cancer who had residual disease after neoadjuvant treatment at two Chinese institutions between 2010 and 2018 were selected, one used as a training cohort and the other as a validation cohort. In total, 142 fully quantitative collagen features were extracted using multiphoton imaging, and a collagen signature was generated by least absolute shrinkage and selection operator Cox regression. Nomograms were developed by multivariable Cox regression. The performance of the nomograms was assessed via calibration, discrimination and clinical usefulness. The outcomes of interest were overall survival and disease-free survival calculated at 1, 2 and 3 years.
Of 559 eligible patients, 421 were selected (238 for the training cohort and 183 for the validation cohort). The eight-collagen-features collagen signature was built and multivariable Cox analysis demonstrated that it was an independent prognostic factor of prognosis along with the systemic immune-inflammation index, lymph node status after neoadjuvant treatment stage and tumour regression grade. Then, two nomograms that included the four predictors were computed for disease-free survival and overall survival. The nomograms showed satisfactory discrimination and calibration with a C-index of 0.792 for disease-free survival and 0.788 for overall survival in the training cohort and 0.793 for disease-free survival and 0.802 for overall survival in the validation cohort. Decision curve analysis revealed that the nomograms could add more net benefit than the traditional clinical-pathological variables.
The study found that the collagen signature, systemic immune-inflammation index and nomograms were significantly associated with prognosis.
Introduction
Colorectal cancer (CRC) is the third most prevalent cancer globally and the second leading cause of cancer-related death1. Neoadjuvant chemoradiotherapy (nCRT) has been proven to improve resectability, anal sphincter preservation, local tumour control and prognosis in locally advanced rectal cancer (LARC) patients2,3. Therefore, nCRT followed by surgery is recommended for LARC patients4. The response to nCRT reflects the survival of patients with LARC, and approximately 15–20% of patients can achieve pathological complete regression (pCR) following nCRT5,6, leading to a 5-year survival rate exceeding 90%7,8. However, there is an unmet medical requirement to determine prognostic indicators that predict patient prognosis for the majority of non-pCR patients.
Collagen plays a pivotal role in facilitating tumour cell invasion, progression and metastasis within the tumour microenvironment9,10. Several studies have emphasized the critical role of collagen in the prognostication of various malignancies11–13. Multiphoton imaging, a nonlinear optical technique, can be used to specifically visualize collagen without the need for exogenous dyes due to its physical origin14. It is an effective tool for studying collagen structure in the tumour microenvironment15,16. Furthermore, high-throughput collagen features can be derived from multiphoton images for prediction model construction17,18. Thus, collagen has the potential to predict the survival outcomes of non-pCR patients.
Another factor that may influence prognosis is the host systemic inflammatory response19–21. Haematological indicators can be used to assess the hypothesis that inflammation status is an important contributor to tumour development and progression. The systemic immune-inflammation index (SII) is a rapid, accurate, practical and affordable indicator that has been proposed to be an effective predictor of various malignancies22–24. However, studies on the value of the SII in determining the prognosis of non-pCR patients remain limited.
The purpose of this study was to investigate the prognostic value of the collagen signature and the SII for survival outcomes in rectal cancer patients who underwent neoadjuvant treatment using nomograms.
Methods
Study design
This is a retrospective study investigating rectal cancer patients who underwent neoadjuvant treatment in two Chinese institutions, one selected for the training cohort and one for the validation cohort.
The training cohort was collected from Nanfang Hospital between January 2010 and December 2018, whereas the validation cohort was collected from Chongqing University Cancer Hospital from January 2013 to December 2018. For both cohorts, the inclusion criteria were as follows: ≥18 years of age, histologically confirmed rectal cancer before nCRT, tumour distance ≤12 cm from the anal verge, cT3–4N0M0 or cTxN1–2M0 determined by pretreatment medical imaging, completion of the standardized nCRT regimen followed by radical surgery, and a tumour regression grade (TRG) greater or equal to 1. The exclusion criteria were as follows: patients with a history of cancer, multiple primary cancers, and missing values of clinical data.
All patients received standard nCRT, including radiotherapy with a total dose of 50.4 Gy in 28 fractions combined with neoadjuvant chemotherapy (FOLFOX or XELOX). A standardized follow-up protocol according to the National Comprehensive Cancer Network (NCCN) guideline was performed for all patients. Ethics approval was obtained from the institutional review boards of Nanfang Hospital and Chongqing University Cancer Hospital. The requirement for informed consent was waived because of the retrospective study.
Clinicopathological data collection
The following baseline clinicopathological data were collected: age, sex, preoperative carcinoembryonic antigen (CEA) level, SII, tumour distance from the anal verge, surgical approach, tumour differentiation, tumour stage after neoadjuvant treatment (ypT) stage, lymph node status after neoadjuvant treatment (ypN) stage, adjuvant treatment and TRG based on the modified Ryan scheme: TRG 0 refers to no residual tumour cells, TRG 1 refers to single cells or small groups of cells, TRG 2 refers to residual cancer with desmoplastic response and TRG 3 refers to minimal evidence of a tumour response25. Mean distance from the anal verge was calculated in the training cohort, and tumours categorized accordingly (above or below).
To determine the SII, 1.0 ml of the patient’s peripheral venous blood was routinely taken before surgery. The standard calculation formula for the SII was as follows: SII = platelet × neutrophil/lymphocyte count23. The SII was subsequently categorized into a high SII subgroup and a low SII subgroup according to the median value.
Pathology, multiphoton imaging and collagen feature extraction
All the formalin paraffin-embedded specimens were sliced to 5 μm thickness and stained with haematoxylin and eosin (H&E) to identify the regions of interest. Two experienced pathologists evaluated the tumour region using a microscope. If there was disagreement between the pathologists, the final decision was made by the chief of the pathology department. Then, within the tumour region, the three most representative regions were randomly selected, each with a field of view of 1000 × 1000 μm. Finally, identical areas on the additional unstained sections were utilized for multiphoton imaging.
Multiphoton images were obtained using a multiphoton imaging system with a 20× objective, as previously reported26. In brief, an upright microscope (LSM 880, Zeiss, Germany) equipped with an 810 nm mode-locked femtosecond Ti: sapphire laser (Chameleon Ultra, Coherent) was utilized to acquire high-resolution images, which included second harmonic generation and two-photon excitation fluorescence signals, and the images were compared with H&E images for histological evaluation.
Subsequently, 142 collagen features were derived from multiphoton images via MATLAB 2015b (MathWorks) (Table S1)27. The imaging and feature extraction procedures were conducted by an optical researcher who was blinded to the survival outcome.
Eight morphological features were derived, including the collagen area, fibre number, length, width, straightness, cross-link density, cross-link space and orientation. First, a Gaussian mixture model was utilized to segment the image into collagen pixels and background pixels28. Then, a network extraction algorithm was applied to process the binary collagen mask image, track each collagen fibre in the image and identify cross-linking points. Cross-linking points were defined as the points at which two or more fibres were connected29. Additionally, the orientation index was determined by the Fourier transform spectrum to reflect the arrangement of collagen30.
For the intensity characteristics, a histogram-based method was utilized. The mean value, variation, skewness, kurtosis, energy and entropy were computed from the histogram of the pixel intensity distribution generated by second harmonic generation.
The contrast, correlation, energy and homogeneity were calculated from the grey-level co-occurrence matrix with five different displacements of pixels (1, 2, 3, 4 and 5) and four different directions (0°, 45°, 90° and 135°)31. To compute the Gabor wavelet transform features, Gabor filters were used to convolve the second harmonic generation images at five different scales and six different orientations, and the mean and variance of the convolution magnitude on the image were calculated for each setting32.
Outcomes of interest
The outcomes of interest were the overall survival (OS, defined as the interval between surgery and death or the last date of follow-up) and disease-free survival (DFS, defined as the time from surgery to recurrence at any site or all-cause death). Survival was calculated at 1, 2 and 3 years.
Statistical analysis and nomograms
Independent sample t tests were used to compare differences in continuous variables. A chi-square test was used to compare the differences in categorical variables. The least absolute shrinkage and selection operator (LASSO)-Cox regression model was used to construct the collagen signature33. The prognostic value of the collagen signature was evaluated via Kaplan–Meier analysis and the log rank test. All variables (age, sex, preoperative CEA level, SII, distance from the anal verge, surgical approach, tumour differentiation, ypT stage, TRG, adjuvant treatment and collagen signature) were included in the univariate and multivariable survival analyses for DFS or OS using the Cox proportional hazards regression model, and the hazard ratio (HR) with 95% c.i. was calculated. Finally, two nomograms were developed based on multivariable Cox analysis of the training cohort (Supplementary material).
The discrimination of the nomograms was measured by Harrell’s concordance index (C-index)34 and time-dependent receiver operating characteristic (ROC) curves35. The calibration was graphically evaluated with calibration curves36. Decision curve analysis was performed to assess the clinical utility of the nomograms (Supplementary material)37. These assessments were subsequently conducted in the validation cohort.
To assess the incremental value of the collagen signature, two clinicopathological-characteristics models without the collagen signature were developed to predict DFS and OS. The net reclassification improvement and integrated reclassification improvement were calculated to quantify the improvement of the nomograms compared with the traditional models (Supplementary material)38. Furthermore, the overall model performance of the nomograms and the traditional models was evaluated through the computation of prediction errors over time39. All statistical analyses were conducted using IBM SPSS (version 25.0) and R software (version 4.0.1). A two-sided P < 0.05 was considered statistically significant.
Results
Patients and clinicopathological characteristics
Of 559 eligible patients treated at the centres during the study interval, 421 patients were selected—238 consecutive patients in the training cohort and 183 consecutive patients in the validation cohort (Fig. S1).
The median (interquartile range (i.q.r.)) age was 58.50 (51–64) years in the first cohort and 56 (48–66) years in the second cohort. The clinicopathological characteristics were similar between the two cohorts (Table 1). In the training cohort, the mean tumour distance from the anal verge was 5.2 cm; hence, the distance from the anal verge was classified as 5 cm. The median SII was 482 × 10³/μl.
Clinicopathological characteristics of the patients in the training and validation cohorts
| Variables | Training cohort (n = 238) | Validation cohort (n = 183) | P |
|---|---|---|---|
| Age (years) (median, i.q.r.) | 58.50 (51–64) | 56.00 (48–66) | 0.165 |
| Sex | |||
| Male | 139 (58.4) | 122 (66.7) | 0.083 |
| Female | 99 (41.6) | 61 (33.3) | |
| Preoperative CEA level | 0.593 | ||
| Normal | 153 (64.3) | 113 (61.7) | |
| Elevated | 85 (35.7) | 70 (38.3) | |
| SII | 0.935 | ||
| Low | 118 (49.6) | 90 (49.2) | |
| High | 120 (50.4) | 93 (50.8) | |
| Distance from the anal verge (cm) | 0.267 | ||
| <5 | 117 (49.2) | 80 (43.7) | |
| ≥5 | 121 (50.8) | 103 (56.3) | |
| Surgical approach | 0.361 | ||
| Low anterior resection | 170 (71.4) | 138 (75.4) | |
| Other procedures* | 68 (28.6) | 45 (24.6) | |
| Tumour differentiation | 0.190 | ||
| Well | 40 (16.8) | 40 (21.9) | |
| Moderate + poor | 198 (83.2) | 143 (78.1) | |
| ypT stage | 0.873 | ||
| ypT1–2 | 141 (59.2) | 107 (58.5) | |
| ypT3–4 | 97 (40.8) | 76 (41.5) | |
| ypN stage | 0.670 | ||
| ypN0 | 171 (71.8) | 128 (69.9) | |
| ypN+ | 67 (28.2) | 55 (30.1) | |
| TRG | 0.203 | ||
| TRG 1 | 91 (38.2) | 59 (32.2) | |
| TRG 2–3 | 147 (61.8) | 124 (67.8) | |
| Adjuvant treatment | 0.248 | ||
| Yes | 213 (89.5) | 157 (85.8) | |
| No | 25 (10.5) | 26 (14.2) | |
| Collagen signature (median, i.q.r.) | −0.166 (−0.388–0.119) | −0.166 (−0.336–0.196) | 0.468 |
Values in parentheses are percentages unless indicated otherwise. *Other procedures included: abdominoperineal resection, intersphincteric resection and transanal total mesorectal excision. i.q.r.,interquartile range; CEA, carcinoembryonic antigen; SII, systemic immune-inflammation index; TRG, tumour regression grade; ypN, lymph node status after neoadjuvant treatment; ypT, tumour stage after neoadjuvant treatment.
The 3-year DFS and 3-year OS rates were 64.7% and 70.2% in the training cohort (Fig. S2a). The 3-year DFS and 3-year OS rates were 68.1% and 68.9% in the validation cohort (Fig. S2b). Moreover, there was no statistically significant difference in the DFS rate between the two cohorts (P = 0.696).
Collagen signature
The construction of the collagen signature entailed the following steps: representative regions from H&E sections were selected for multiphoton imaging, and 142 collagen structural features were extracted from the multiphoton images. The collagen signature was subsequently developed based on LASSO-Cox regression (Fig. 1). The formula used to calculate the collagen signature, which included eight collagen features (Fig. S3) was established (Supplementary results). The collagen signature of each patient was obtained in the two cohorts (Fig. S4). There was no significant difference in the collagen signature between the training (median, −0.166 (i.q.r. −0.388–0.119)) and validation (median, −0.166 (i.q.r. −0.336–0.196)) cohorts (P = 0.468). The cut-off generated by the X-tile plot was 0.102 (Fig. S5). Patients were subsequently classified into a low collagen signature group (collagen signature < 0.102) and a high collagen signature group (collagen signature ≥ 0.102).
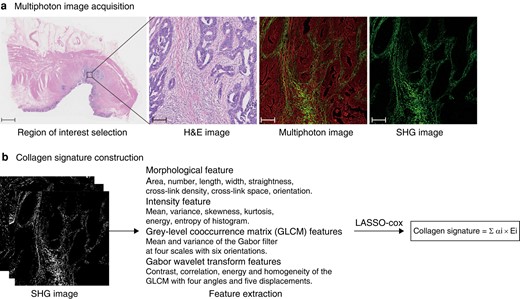
Flow chart of collagen signature construction
a H&E and multiphoton images. A representative region of interest with a field of view of 1000 × 1000 μm was selected for multiphoton imaging. Scale bars: 2000 μm (H&E), 125 μm (H&E), 125 μm (multiphoton image) and 125 μm (SHG image). b Collagen signature construction. From the SHG images, a total of 142 collagen features were extracted, then LASSO-Cox regression was used to select predictive collagen features to construct the collagen signature. The formula represented multiplying each selected collagen feature by the corresponding weighted regression coefficient and summing to obtain the collagen signature. H&E, haematoxylin and eosin; SHG, second harmonic generation; LASSO, least absolute shrinkage and selection operator.
Association of the collagen signature with prognosis
Patients with a high collagen signature presented with a poor prognosis (3-year DFS: 25.8% versus 78.4%; P < 0.001; 3-year OS: 38.7% versus 81.3%; P < 0.001) (Fig. 2a). These results were also observed in the validation cohort (Fig. 2b). The area under the time-dependent ROC curve (AUC) showed that the 1-, 2- and 3-year DFS rates of the collagen signature were 0.740, 0.776 and 0.789 (Fig. S6a). The AUC values for the 1-, 2- and 3-year OS of the collagen signature were 0.756, 0.787 and 0.761 (Fig. S6b). The collagen signature also exhibited satisfactory performance for predicting 1-, 2- and 3-year DFS (0.798, 0.791 and 0.810) (Fig. S6c) and 1-, 2- and 3-year OS (0.762, 0.842 and 0.835) in the validation cohort (Fig. S6d).
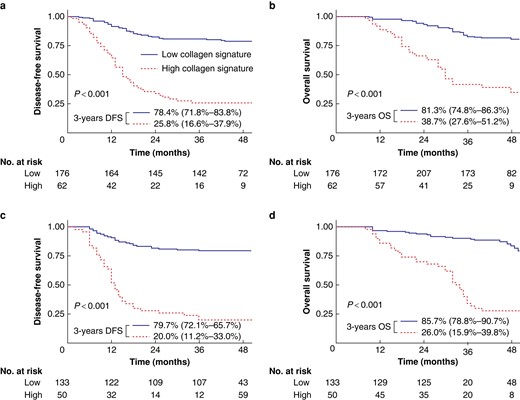
Kaplan–Meier survival analysis of the training and validation cohorts grouped by the collagen signature.
Kaplan–Meier survival analysis of the collagen signature with DFS a and OS b in the training cohort. Kaplan–Meier survival analysis of the collagen signature with DFS c and OS d in the validation cohort. DFS, disease-free survival; OS, overall survival.
Development and evaluation of the nomograms
The collagen signature, SII, ypN stage and TRG were identified as independent predictors of survival outcomes in the training cohort (Table 2). The collagen signature remained a significant prognostic indicator (DFS: HR 2.965 (95% c.i. 2.159 to 4.073), P < 0.001; OS: HR 2.852 (95% c.i. 2.004 to 4.057), P < 0.001) after stratification by clinicopathological characteristics and showed better discrimination than the other predictors, including the SII, ypN stage and TRG (Fig. S7). Alluvial diagrams illustrated the association of predictors with recurrence in the two cohorts (Fig. S8). Two nomograms were subsequently constructed for the prediction of DFS and OS (Fig. 3). The C-index values of the nomograms were 0.792 for DFS and 0.788 for OS in the training cohort. For the validation cohort, the C-index values were 0.793 for DFS and 0.802 for OS. The calibration curves of the two nomograms exhibited favourable correspondence between the survival predicted by the nomograms and the observed survival in both cohorts (Fig. S9).
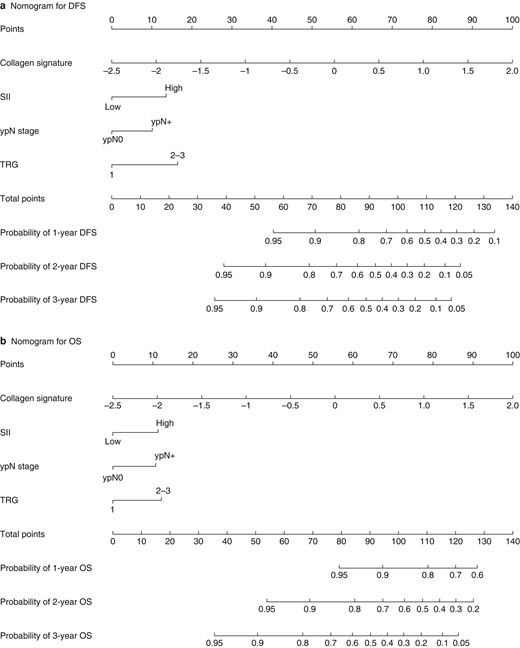
Nomograms for the prediction of DFS and OS.
a Nomogram for DFS. b Nomogram for OS. DFS, disease-free survival; OS, overall survival; SII, systemic immune-inflammation index; TRG, tumour regression grade.
Cox regression analysis of clinicopathological characteristics and collagen signature for survival in the training cohort
| Variables | Univariate analysis | P | Multivariable analysis | P |
|---|---|---|---|---|
| HR (95% c.i.) | HR (95% c.i.) | |||
| Disease-free survival | ||||
| Age (years) | 0.991 (0.969,1.012) | 0.386 | ||
| Sex (male versus female) | 1.006 (0.651,1.555) | 0.979 | ||
| Preoperative CEA level (elevated versus normal) | 1.309 (0.847,2.025) | 0.226 | ||
| SII (high versus low) | 2.408 (1.522,3.808) | <0.001 | 1.946 (1.221,3.102) | 0.005 |
| Distance from the anal verge (≥5 cm versus < 5 cm) | 0.904 (0.589,1.389) | 0.646 | ||
| Surgical approach (low anterior resection versus other procedures) | 0.922 (0.577,1.471) | 0.732 | ||
| Tumour differentiation (poor + moderate versus well) | 1.473 (0.874,2.483) | 0.146 | ||
| ypT stage (ypT3–4 versus ypT1–2) | 1.636 (1.066,2.510) | 0.024 | NA | NA |
| ypN stage (ypN + versus ypN0) | 2.229 (1.444,3.443) | <0.001 | 1.645 (1.046,2.588) | 0.031 |
| TRG (TRG 2–3 versus TRG 1) | 2.696 (1.600,4.544) | <0.001 | 2.239 (1.320,3.797) | 0.003 |
| Adjuvant treatment (yes versus no) | 0.605 (0.264,1.390) | 0.236 | ||
| Collagen signature | 3.715 (2.745,5.029) | <0.001 | 2.965 (2.159,4.073) | <0.001 |
| Overall survival | ||||
| Age (years) | 0.996 (0.794,1.020) | 0.764 | ||
| Sex (male versus female) | 1.241 (0.786,1.961) | 0.354 | ||
| Preoperative CEA level (elevated versus normal) | 1.422 (0.895,2.259) | 0.136 | ||
| SII (high versus low) | 2.167 (1.337,3.510) | 0.002 | 1.707 (1.043,2.795) | 0.033 |
| Distance from the anal verge (≥ 5 cm versus <5 cm) | 0.927 (0.587,1.465) | 0.746 | ||
| Surgical approach (low anterior resection versus other procedures) | 0.924 (0.561,1.522) | 0.757 | ||
| Tumour differentiation (poor + moderate versus well) | 1.219 (0.681,2.181) | 0.505 | ||
| ypT stage (ypT3–4 versus ypT1–2) | 1.615 (1.024,2.549) | 0.039 | NA | NA |
| ypN stage (ypN+ versus ypN0) | 2.379 (1.506,3.760) | <0.001 | 1.659 (1.024,2.688) | 0.040 |
| TRG (TRG 2–3 versus TRG 1) | 2.093 (1.241,3.530) | 0.006 | 1.780 (1.050,3.019) | 0.032 |
| Adjuvant treatment (yes versus no) | 0.720 (0.312,1.660) | 0.441 | ||
| Collagen signature | 3.524 (2.534,4.902) | <0.001 | 2.852 (2.004,4.057) | <0.001 |
HR, hazard ratio; CEA, carcinoembryonic antigen; SII, systemic immune-inflammation index; ypT, tumour stage after neoadjuvant treatment; NA, not available; ypN, lymph node status after neoadjuvant treatment; TRG, tumour regression grade.
Incremental value of the collagen signature for prognosis prediction
Two clinicopathological models based on the SII, ypN stage and TRG for the prediction of prognosis were developed (Table S2). Compared with the clinicopathological traditional models, the nomograms had higher C-index values for DFS (0.792 versus 0.694; P < 0.001) and for OS (0.788 versus 0.678; P < 0.001) in the training cohort. These results were also detected in the validation cohort (DFS: 0.793 versus 0.737, P = 0.003; OS: 0.802 versus 0.739; P < 0.001) (Table S3). The AUC values for 3-year DFS between the nomograms and traditional models were 0.862 versus 0.742 (P < 0.001), and those for 3-year OS were 0.836 versus 0.707 (P < 0.001) in the training cohort (Fig. 10a). Similarly, significantly greater AUC values (DFS: 0.851 versus 0.724, P < 0.001; OS: 0.844 versus 0.774; P < 0.001) were detected in the validation cohort (Fig. 10b). Furthermore, in the training cohort, the nomograms indicated a net reclassification improvement of 0.290 for DFS and 0.444 for OS and an integrated discrimination improvement of 0.131 for DFS and 0.143 for OS compared with the traditional models; similar results were observed in the validation cohort (Table S4 and Fig. S11). The corresponding prediction error curves showed a consistently lower prediction error for the nomograms than for the other models in the two cohorts, indicating that the nomograms had the highest prediction accuracy (Fig. S12). In addition, decision analysis curves indicated that while traditional clinicopathological models could improve patient prognosis, nomograms demonstrate even greater net benefits than traditional clinicopathological models (Fig. 4).
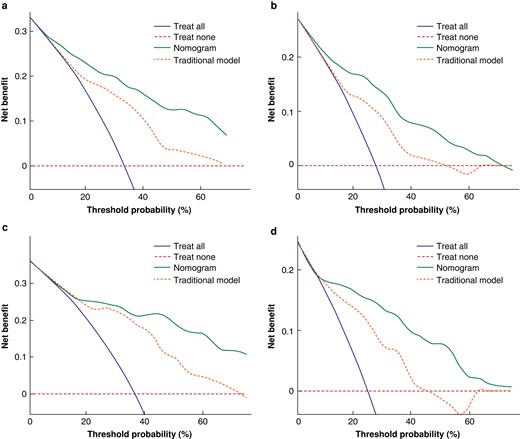
Decision curves of the nomograms and traditional models
Decision curves of the nomograms and the traditional models for predicting a DFS and b OS in the training cohort. Decision curves of the nomogram and the traditional models for predicting c DFS and d OS in the validation cohort. The y-axis represents the net benefit and the x-axis represents the different threshold probabilities. DFS, disease-free survival; OS, overall survival.
Discussion
The identification of prognostic factors for non-pCR patients to guide further treatment is still urgently needed in the clinic. This study revealed that the collagen signature, which integrates eight collagen features and the SII, was significantly associated with prognosis. Then, two nomograms were developed and validated with satisfactory performance to provide individualized predictions of prognosis in non-pCR patients.
Collagen is a crucial component of the tumour microenvironment and plays a significant role in tumour invasion, proliferation and metastasis9,10. With the gradual increase in understanding of collagen, researchers have found that the collagen structure changes dynamically rather than significantly to affect the life activities of tumour cells11,13. Previously, the quantitative analysis of collagen structure was challenging. With interdisciplinary advancements, multiphoton imaging is an emerging imaging method for visualizing collagen structure. Due to its physical origin, second harmonic generation in multiphoton imaging is used to visualize collagen in a tissue label-free manner, which can avoid structural changes in the fibre network during tissue processing. Therefore, multiphoton imaging is becoming a strong tool for studying collagen structure in various diseases14,16,40. Importantly, a stable framework was constructed to automatically extract high-throughput collagen structural features from multiphoton images18,41. This quantitative approach has proven useful in providing information about collagen features and is currently being used to construct prediction models27,42.
Combining multiple biomarkers within a single model can improve the precision of prognosis prediction15,43. Currently, multiple machine learning algorithms are being used to analyse high-throughput data. Among these algorithms, LASSO-Cox regression is widely adopted for survival regression analysis of high-throughput data44,45. It has the ability to select and rank biomarkers with strong prognostic value, reduce the interactions between each biomarker to avoid overfitting, and weight regression coefficients based on each selected collagen feature. The resulting linear formula can be used to calculate the collagen signature for predicting prognosis33,46.
In the normal extracellular matrix, collagen is usually present in an isotropic meshwork47. However, collagen can be remodelled during tumour invasion, resulting in increased cross-link density, reduced cross-link space, and a vertical orientation for promoting tumour cell invasion and migration40,48,49. In this work, the collagen signature was positively correlated with the collagen cross-link space and negatively correlated with collagen orientation40,48,49. To provide a more comprehensive description of collagen organization, structural features of collagen were measured in addition to morphological features42.
In addition to assessing the relationship between the local tumour microenvironment and prognosis, this study explored the impact of inflammation on patient survival. Mediators such as chemokines or cytokines induce an inflammatory state in vivo that promotes tumour cell proliferation and progression. In addition, the activation of oncogenes can drive cancer into an inflammatory state. As a result, inflammation and cancer are complementary and closely related19,21,23,24. Previous studies have shown that leucocyte, neutrophil, lymphocyte, platelet and C-reactive protein levels are strongly correlated with cancer-related inflammation24. The SII is an inflammatory marker that combines neutrophils, platelets and lymphocytes, which more accurately reflects the patient's inflammatory and immune status22,23. A high SII can be attributed to an increased platelet count and neutrophil count or a decreased lymphocyte count. Neutrophils secrete various cytokines that can promote tumour growth, metastasis and angiogenesis50,51. Platelets secrete platelet-derived growth factor, vascular endothelial growth factor and platelet factors, which promote angiogenesis, microvascular invasion and extracellular matrix remodelling, thereby facilitating tumour initiation and progression52. Lymphocytes can target tumour cells and induce their death. A low lymphocyte count leads to a reduced antitumour immune response, further promoting tumour initiation and progression53.
Implementing the nomograms and parameters does not entail additional costs for the centre. First, unstained sections of tumour specimens could be used for multiphoton imaging without exogenous dyes after routine pathological procedures. Second, the collagen features were automatically derived from the multiphoton image. Third, other clinicopathological predictors in the nomograms are provided in routine pathological reports. For nomogram-predicted low-risk patients, current treatment and follow-up can be continued. However, for nomogram-predicted high-risk patients, modification of the treatment regimen, such as triple-drug chemotherapy, immunotherapy or targeted therapy, can be considered. Intensifying follow-up is feasible for detecting signs of metastasis or recurrence early to initiate appropriate treatment measures for improving patient prognosis54,55.
One limitation of this study was that the cohorts used to develop and validate the models were retrospective, and there may have been potential selection biases. Therefore, the robustness of the nomograms requires further validation in prospective and multicentre clinical trials involving diverse regions and ethnicities.
In summary, the collagen signature and the SII were significantly associated with prognosis, and nomograms that integrated the collagen signature, SII, ypN stage and TRG were used to individualize the prediction of prognosis in non-pCR rectal cancer patients.
Funding
This work was supported by grants from the National Natural Science Foundation of China (82273360), the Guangdong Provincial Key Laboratory of Precision Medicine for Gastrointestinal Cancer (2020B121201004), the Guangdong Provincial Major Talents Project (No. 2019JC05Y361), the Science and Technology Planning Project of Guangzhou City (202206010085), the Clinical Research Project of Nanfang Hospital (2020CR001 and 2020CR011), the National Training Program for Undergraduate Innovation and Entrepreneurship (202212121011, S202212121104 and S202212121092), the Postdoctoral Fellowship Program of CPSF (GZC20231069), the Science and Technology Program of Guangzhou (2023A04J2393), the President Foundation of Nanfang Hospital, Southern Medical University (2022B021 and 2023B016) and the Natural Science Foundation of Chongqing (cstc2018jxjl130081).
Acknowledgements
X.Y., W.J., X.D. and B.Y. contributed equally to this article.
Disclosure
The authors declare no conflict of interest.
Supplementary material
Supplementary material is available at BJS Open online.
Data availability
The data sets generated during and/or analysed during the present study are available from the corresponding author on reasonable request.
Author contributions
Xian Yu (Conceptualization, Data curation, Formal analysis, Methodology, Software, Writing—original draft), Wei Jiang (Conceptualization, Data curation, Formal analysis, Investigation, Methodology, Software, Validation, Writing—original draft), Xiaoyu Dong (Conceptualization, Data curation, Investigation, Methodology, Writing—original draft), Botao Yan (Data curation, Formal analysis, Methodology, Writing—original draft), Shuoyu Xu (Data curation, Investigation, Methodology), Zexi Lin (Methodology, Software, Visualization), Shuangmu Zhuo (Conceptualization, Data curation, Investigation, Methodology, Visualization, Writing—review & editing), and Jun Yan (Conceptualization, Data curation, Investigation, Methodology, Project administration, Supervision, Writing—review & editing)
References
National Comprehensive Cancer Network Clinical Practice Guidelines in Oncology-Colorectal Cancer (2022 Version 3). http://www.nccn.org
