


Abstract
Childhood disadvantage is a prominent risk factor for cognitive and brain aging. Childhood disadvantage is associated with poorer episodic memory in late midlife and functional and structural brain abnormalities in the default mode network (DMN). Although age-related changes in DMN are associated with episodic memory declines in older adults, it remains unclear if childhood disadvantage has an enduring impact on this later-life brain–cognition relationship earlier in the aging process. Here, within the DMN, we examined whether its cortical microstructural integrity—an early marker of structural vulnerability that increases the risk for future cognitive decline and neurodegeneration—is associated with episodic memory in adults at ages 56–66, and whether childhood disadvantage moderates this association.
Cortical mean diffusivity (MD) obtained from diffusion magnetic resonance imaging was used to measure microstructural integrity in 350 community-dwelling men. We examined both visual and verbal episodic memory in relation to DMN MD and divided participants into disadvantaged and nondisadvantaged groups based on parental education and occupation.
Higher DMN MD was associated with poorer visual memory but not verbal memory (β = −0.11, p = .040 vs β = −0.04, p = .535). This association was moderated by childhood disadvantage and was significant only in the disadvantaged group (β = −0.26, p = .002 vs β = −0.00, p = .957).
Lower DMN cortical microstructural integrity may reflect visual memory vulnerability in cognitively normal adults earlier in the aging process. Individuals who experienced childhood disadvantage manifested greater vulnerability to cortical microstructure-related visual memory dysfunction than their nondisadvantaged counterparts who exhibited resilience in the face of low cortical microstructural integrity.
Cognitive and brain aging are known to be influenced by early-life factors such as parental socioeconomic status (SES) and general cognitive ability (GCA) (1–5). In particular, childhood socioeconomic disadvantage is considered to be a prominent risk factor for later-life cognitive decline and neurodegenerative disorders (4–6) as it is consequential to an individual’s access and exposure to a host of social and environmental factors that have enduring effects on behavioral, cognitive, and brain development (7–10). Multiple lines of evidence demonstrate that childhood socioeconomic disadvantage, often operationalized as parental SES (10–12), is associated with poorer cognitive function across multiple domains (4,13,14), including episodic memory (1,4,12). Episodic memory declines are one of the defining characteristics of normal aging and aging-related disorders such as Alzheimer’s disease (AD) (15). In younger populations, childhood socioeconomic disadvantage is associated with brain functional and structural abnormalities in the default mode network (DMN) (8,16–18), whose functional alterations are associated with age-related episodic memory declines in cognitively normal older adults (15,19–21). Key regions of the DMN (eg, precuneus, posterior cingulate) also exhibit some of the earliest AD-related pathology decades before disease manifestations (22,23), suggesting that the network may be particularly susceptible to structural abnormalities early in the aging process. However, there is currently a lack of knowledge regarding how childhood socioeconomic disadvantage may interact with DMN structural vulnerability to influence episodic memory in late midlife.
Inflection points for both cognitive and brain aging tend to occur around the age of 60 (24–26), during which healthy aging accelerates and may become pathological. Consequently, identifying sensitive markers of brain structural vulnerability that bear relevance to cognition around this time point may enable early detection and potential intervention for individuals at risk for future cognitive decline and neurodegeneration. The literature on cortical structural substrates of episodic memory has predominately focused on whole brain and medial temporal lobe/hippocampus with studies relying on conventional macrostructural measures such as cortical thickness and volume (27–29). However, there is emerging evidence indicating that alterations in cortical microstructure precede and even contribute to gradual cortical macrostructural atrophy (30,31).
Cortical mean diffusivity (MD), an index of gray matter microstructure derived from diffusion magnetic resonance imaging, has been suggested as a relatively early, sensitive, and predictive marker of progressive cognitive decline and neurodegeneration (31–33). Cortical MD assesses the average water diffusion across all directions within gray matter voxels. Increases in cortical MD occur when microstructural barriers such as cell membranes that restrict water diffusion degenerate, reflecting the reduction of microstructural integrity of neurites and cell bodies (32). Higher cortical MD has been detected in patients with aging-related disorders including mild cognitive impairment (MCI) and AD relative to cognitively normal controls (31–35). Cortical MD may also improve the prediction of progression from cognitively normal to MCI 12 years before diagnosis (33), and the prediction of number of years to symptom onset in presymptomatic autosomal-dominant AD carriers (31). In both studies, cortical MD provided additional and/or complementary information about progressive cognitive decline and neurodegeneration over and above that offered by cortical thickness. In addition, cortical MD has been shown to be partly influenced by genes that are distinct from those influencing cortical thickness (30). These results suggest that cortical MD may serve as a sensitive marker that captures unique information regarding structural vulnerability to neurodegeneration, particularly in the early stages of aging and disease processes.
Prior functional neuroimaging studies demonstrated that alterations in DMN functional dynamics are associated with age-related episodic memory declines in cognitively normal older adults (15,19–21). Moreover, macrostructural reduction in cortical thickness in key regions of the DMN is associated with poor episodic memory performance and AD-related pathology (36,37). Although these studies indicated the DMN as a key network supporting episodic memory functioning, it remains unknown whether cortical microstructure—an early marker of structural vulnerability—within the DMN is associated with episodic memory. Previous studies of cortical microstructure and cognition have only examined MD in anatomically defined regions of interest that often encompass smaller subregions with distinct functional network identity (31–35). This approach may not sufficiently characterize network-level (in this case, the DMN) microstructural vulnerability that may influence episodic memory. Thus, given the existing work on the association between DMN and episodic memory (15,19–21), we focus on understanding the role of cortical microstructural integrity for episodic memory within the DMN. Moreover, prior studies have largely overlooked different episodic memory modalities (ie, verbal, visual), making it impossible to examine whether these modalities may be differentially associated with the DMN. In fact, a twin study from our group revealed considerable nonoverlapping genetic contributions to visual and verbal memory (38). Additionally, there is evidence suggesting that the DMN plays a critical role in mentally constructing and maintaining scenes or events during episodic memory recall (39). This scene construction function of the DMN may preferentially facilitate visual memory, as it relies heavily on mental imagery and construction of stimuli during recall.
Both cross-sectional and longitudinal associations between childhood disadvantage and variations in cortical macrostructure have been shown in younger populations (8,40). Biologically, these structural differences are likely due to a host of psychological and environmental factors associated with childhood socioeconomic disadvantage. For instance, nutritional deficiencies and exposure to environmental toxins (eg, lead) are both related to poor SES (41,42) and are known to negatively affect brain structure and development (18,42). Likewise, socioeconomic disadvantage is associated with less environmental complexity and variety, which have been shown in animal studies to directly affect brain development, structure, and function (43,44). Relatedly, stress is another biological mechanism associated with poor SES-related differences in brain structure. For instance, stress during development causes a number of cellular and molecular changes in the brain as demonstrated in studies of rodents and nonhuman primates (45). However, evidence showing direct associations between childhood disadvantage and cortical morphology in late midlife and older adulthood remains scarce. To date, only 1 study showed associations between childhood disadvantage and gray matter volume of various cortical structures outside of the DMN in middle-aged and older adults (46). Similarly, studies on the association of childhood disadvantage with late midlife hippocampal volume have yielded mixed results (46,47). However, prior work in children suggested that socioeconomic disadvantage plays a moderating role in explaining brain–cognition relationships during childhood (48,49). Thus, in light of these findings, it seems more appropriate to examine childhood socioeconomic disadvantage as a moderator of later-life brain–cognition relationships.
In the present study, we examined the following research questions in 350 community-dwelling men ranging from 56 to 66 years of age. We first investigated whether the cortical microstructure of the DMN as measured by cortical MD is associated with either or both visual and verbal modalities of episodic memory in middle- and early old-aged adults. Based on prior literature showing associations of current and progressive cognitive impairment with cortical MD (31–34), as well as associations of DMN functional and structural measures with episodic memory (15,19–21), we hypothesized that participants with higher cortical MD (ie, structural vulnerability) within the DMN would have lower visual and/or verbal episodic memory performance. We then examined the moderating effect of childhood disadvantage on the putative associations of 2 modalities of episodic memory with DMN cortical microstructural integrity. We hypothesized that individuals in the disadvantaged group would exhibit stronger negative associations (ie, steeper slopes) between DMN cortical MD and visual and/or verbal episodic memory relative to their nondisadvantaged counterparts, whose memory performance may be less affected by cortical microstructural integrity of the DMN. Note that these hypotheses do not necessarily imply an exclusive relationship between the 2 modalities of episodic memory and DMN cortical MD, as opposed to MD in the rest of the cortex. Nevertheless, to test whether relationships observed between 2 modalities of episodic memory and DMN cortical MD could reflect a nonspecific relationship with cortical microstructure, we also performed control analyses in several other cortical networks that have comparable network size. Additionally, we performed control analyses in 2 other cognitive domains and examined their associations with DMN cortical MD.
Method
Participants
Participants were from the Vietnam Era Twin Study of Aging (VETSA), a multisite longitudinal study of aging beginning in middle age (50). VETSA has completed 3 waves of assessments. Here we examined the second wave when diffusion-weighted images (DWIs) were available, and the age range included participants in late midlife. The sample included community-dwelling men from across the United States who are similar to American men in their age range with respect to health, education, and lifestyle characteristics. Participants were excluded from the present analyses for seizure disorder, stroke, multiple sclerosis, HIV/AIDS, or schizophrenia, which resulted in a total of 350 participants (mean age = 61.83, standard deviation [SD] = 2.63) with neuroimaging data. The study was approved by the Institutional Review Board at the University of California, San Diego (UCSD), Boston University, and the Massachusetts General Hospital (MGH), and written informed consent was obtained from all participants. Table 1 shows the sample characteristics.
Sample Characteristics
| Disadvantaged*(N = 149) | Nondisadvantaged* (N = 192) | Full Sample (N = 350) | |
|---|---|---|---|
| Age | 61.85 (2.73) | 61.92 (2.51) | 61.83 (2.63) |
| Years of education | 13.22 (1.81) | 14.26 (2.11) | 13.78 (2.03) |
| Father SES* | 24.45 (5.16) | 41.66 (8.81) | 34.12 (11.32) |
| Father education | 8.57 (2.89) | 12.29 (2.49) | 10.67 (3.24) |
| Father occupation | 3.42 (0.90) | 5.80 (1.46) | 4.75 (1.72) |
| Mother SES* | 17.26 (11.43) | 21.74 (14.45) | 19.79 (13.40) |
| Mother education | 10.37 (2.45) | 12.04 (1.92) | 11.30 (2.32) |
| Mother occupation | 1.55 (2.09) | 1.91 (2.58) | 1.75 (2.38) |
| Young adult general cognitive ability† | 0.32 (0.77) | 0.43 (0.67) | 0.37 (0.72) |
| Young adult general cognitive ability percentile† | 59.62 (23.53) | 64.09 (21.35) | 61.63 (22.60) |
| Visual memory | -0.18 (0.98) | -0.07 (0.88) | -0.14 (0.95) |
| Verbal memory | -0.33 (1.08) | -0.17 (1.09) | -0.25 (1.09) |
| Default mode network mean diffusivity‡ | 1.00 (0.05) | 1.00 (0.05) | 1.00 (0.05) |
| Race/ethnicity | |||
| % White/non-Hispanic | 83% (124) | 95% (182) | 90% (313) |
| % Others | 17% (25) | 5% (10) | 10% (37) |
| APOE-ε4 status§ | |||
| Positive | 36 (21%) | 48 (27%) | 88 (25%) |
| Negative | 112 (79%) | 144 (73%) | 261 (75%) |
Notes: Mean (standard deviation) for all participants at each time point. APOE = apolipoprotein; SES = socioeconomic status.
*9 missing for parental education and occupation (N = 341).
†Disadvantaged: 5 missing (N = 144); nondisadvantaged: 2 missing (N = 190); full sample: 7 missing (N = 343).
‡Disadvantaged: 2 missing (N = 130).
§Disadvantaged: 1 missing (N = 148), full sample: 1 missing (N = 349).
MRI Acquisition and Processing
Images were acquired at UCSD (N = 214) and MGH (N = 136). At UCSD, T1-weighted (3D fast spoiled gradient echo, repetition time [TR]= 8.084 milliseconds, echo time [TE] = 3.164 milliseconds) and DWIs (51 diffusion directions, b value=1 000 s/mm2, TR = 9 700 milliseconds, TE = 80–84 milliseconds) were acquired on a 3T GE Discovery 750× scanner (GE Healthcare, Waukesha, WI) with an 8-channel phased-array head coil. At MGH, T1-weighted (3D magnetization-prepared rapid gradient echo, TR = 2 170 milliseconds, TE = 4.33 milliseconds) and DWIs (30 diffusion directions, b value = 1 000 s/mm2 (and 1 b = 0 image), TR = 9 500 milliseconds, TE = 94 milliseconds) were acquired with a 3T Siemens Tim Trio, (Siemens USA, Washington, DC) with a 32-channel head coil.
Image preprocessing
Images were preprocessed at the UCSD Center for Multimodal Imaging Genetics (see Imaging Processing in the Supplementary Material). Briefly, T1-weighted images were corrected for gradient nonlinearity distortions and B1 field inhomogeneity and then rigidly resampled and registered to standard space. DWIs were corrected for eddy current distortion, head motion, B0 distortions, and gradient nonlinearity distortions. The b = 0 images were registered to T1 images using mutual information and then rigidly resampled into a standard orientation relative to the atlas-registered T1, with 2-mm isotropic resolution. All images were visually inspected to exclude data with severe scanner artifacts or excessive head motion from subsequent analyses.
Boundaries between gray matter, white matter, and cerebrospinal fluid were defined and the cortical surface was then divided into 400 parcels according to the Schaefer 400, 17 networks atlas (see Imaging Processing in the Supplementary Material). Conventional diffusion tensor imaging (DTI) methods were used to model the diffusion tensor as an ellipsoid where eigenvalues λ1, λ2, and λ3 define the 3 primary axes and MD was calculated as the average diffusion in all directions for each parcel. Diffusion metrics were projected to the cortical surface. To minimize the effects of partial voluming, we calculated weighted averages of MD based on the proportion of gray matter in several sampled locations within the cortical ribbon at each vertex (see Imaging Processing in the Supplementary Material). We focused our analysis on the DMN (Supplementary Table 1 lists included regions), so MD of each parcel in the DMN was averaged to obtain a network-level MD.
Visual and Verbal Episodic Memory
Visual episodic memory
The Wechsler Memory Scale (WMS-III) Visual Reproduction (VR) subtest was used to index the visual modality of episodic memory (see Factor Score Computation for Verbal and Visual Memory in the Supplementary Material). The VR test includes copy, immediate, and delayed recall of 5 designs. Copy involves copying each design on paper. For immediate and delayed recall, each design is presented for 10 seconds and then drawn from memory for recall. Based on the scores obtained from the VR test, an exploratory factor analysis was performed to derive a visual memory factor score for each participant (see Factor Score Computation for Verbal and Visual Memory in the Supplementary Material).
Verbal episodic memory
The California Verbal Learning Test (CVLT-II) and the WMS-III Logical Memory (LM) were used to index the verbal modality of episodic memory (see Factor Score Computation for Verbal and Visual Memory in the Supplementary Material). The CVLT has 5 learning trials, each consisting of a list of 16 words, followed by an interference list and then short- and long-delay free recall of the repeated list. The WMS-III LM includes 2 brief stories that are read to the subject. There is an immediate free recall after each story and then a delayed recall. Standard administration was employed except for the WMS-III LM. In this case, the second story in the WMS-III was read only once, whereas in the standard administration, it is read twice. Derived scores for both WMS-III LM and CVLT based on our prior factor score computation using structural equation modeling models (38) were summed to obtain a verbal memory factor score for each participant (see Factor Score Computation for Verbal and Visual Memory in the Supplementary Material).
Childhood Disadvantage Status
Using the Hollingshead and Redlich scales (11), parental occupation was coded on a 0–9 scale (0 = homemaker/unemployed/retired; 1 = unskilled laborer; 9 = major professionals), and parental education was recoded to a 1–7 scale (1 = none to seventh grade to 7 = graduate professional training). An SES composite score for each parent was calculated as: (occupation score × 5) + (education score × 3). Stepparent(s)’ occupation and education were used whenever biological parent(s)’ information was missing. We dichotomized childhood disadvantage as follows: participants with father SES <32 were considered disadvantaged, which reflects a combination of less than high school education and semiskilled manual occupation or lower (11).
Young Adult General Cognitive Ability
Participants were on average 20 years of age when they completed the Armed Forces Qualification Test (AFQT). The AFQT is a standardized, validated 100-item multiple-choice paper-and-pencil test of GCA (1). It includes 4 components: vocabulary, arithmetic, spatial processing, and knowledge and reasoning about tools. AFQT percentile scores were probit transformed and z-scored for analysis. This test is highly correlated with other tests of GCA such as the Wechsler Adult Intelligence Scale (r = 0.84) (1).
Statistical Analyses
Statistical analyses were performed using R version 4.1.2. Linear mixed models were performed using the lme4 package. Summaries of linear mixed models were obtained using the jtools package and p values were calculated using Satterthwaite degrees of freedom approximation. Data were visually inspected for normality and outliers. Age, race/ethnicity, young adult GCA, and APOE-ε4 carrier status (ε4+ vs ε4−) were included as covariates in linear mixed models unless otherwise noted. Inclusion of young adult GCA aimed to account for the effect of longstanding individual differences in cognitive ability on late midlife episodic memory, allowing for a more stringent estimation of the association of DMN cortical MD with episodic memory. In supplemental analyses, years of education was included as a covariate rather than young adult GCA, because many studies do not have earlier GCA. Verbal and visual memory factor scores were the dependent variables. Higher scores indicate better memory performance. MD of the DMN was the independent variable and was adjusted for scanner difference and standardized prior to linear mixed modeling. Twin pair family ID was included as a random intercept to account for correlated outcomes within pairs. For comparison purposes, we also performed the same analyses in the somatomotor, frontoparietal control, and salience/ventral attention networks (Supplementary Tables 2–4 list all parcels), which have comparable network size to that of the DMN and can serve as negative control networks.
Results
Sample Characteristics
Descriptive statistics illustrated an expected positive association between age and DMN MD (r = 0.25, p < .0001). DMN MD was not associated with either young adult GCA or years of education (Supplementary Table 5). We conducted 2-sample t tests to examine potential group differences between the disadvantaged and nondisadvantaged groups. The disadvantaged group had significantly lower years of education (t = −4.78, p < .001) than the nondisadvantaged group. However, the 2 groups did not significantly differ in visual memory (t = −1.16, p = .248), verbal memory (t = −1.35, p = .178), young adult GCA (t = −1.36, p = .176) or DMN MD (t = −0.88, p = .381). Based on the young adult GCA scores, which are highly correlated with the WAIS intelligence quotient (IQ) scores (r = 0.84) (1,51), the full study sample had an estimated equivalent IQ score of 104.4, with the disadvantaged group having an equivalent IQ score of 103.7 and the nondisadvantaged group having an equivalent IQ score of 105.4.
Default Mode Network and Memory
After controlling for covariates, we detected a significant main effect of DMN (Figure 1) MD, which was negatively associated with visual memory (β = −0.11, p = .040, 95% confidence interval [CI]: −0.21, −0.01), but not verbal memory (β = −0.04, p = .535, 95% CI: −0.15, 0.08; (Table 2). Greater MD was associated with worse visual memory. When we controlled for education instead of young adult GCA, the main effect of DMN MD was significant for visual memory (β = −0.13, p = .014, 95% CI: −0.23, −0.03) and remained nonsignificant for verbal memory (β = −0.04, p = .518, 95% CI: −0.15, 0.08) (Supplementary Table 6).
Default Mode Network Mean Diffusivity Associations With Visual and Verbal Memory: Linear Mixed-Effects Models
| Effects | Visual | Verbal | ||||
|---|---|---|---|---|---|---|
| N = 340 | N = 340 | |||||
| Estimate (SE) | p Value | 95% CI [Upper, Lower] | Estimate (SE) | p Value | 95% CI [Upper, Lower] | |
| Intercept | −0.43 (0.20) | .032 | [−0.83, −0.04] | −0.72 (0.24) | .003 | [−1.20, −0.24] |
| Age | −0.16 (0.05) | .005 | [−0.26, −0.05] | −0.19 (0.07) | .004 | [−0.32, −0.06] |
| Ethnicity (White/non-White) | 0.45 (0.19) | .017 | [0.08, 0.81] | 0.42 (0.23) | .065 | [−0.03, 0.87] |
| Young adult general cognitive ability | 0.24 (0.05) | <.0001 | [0.13, 0.34] | 0.34 (0.06) | <.0001 | [0.22, 0.45] |
| APOE genotype | −0.15 (0.12) | .191 | [−0.38, 0.08] | 0.14 (0.14) | .326 | [−0.14, 0.41] |
| Default mode network mean diffusivity | −0.11 (0.05) | .040 | [−0.21, −0.01] | −0.04 (0.06) | .535 | [−0.15, 0.08] |
Notes: Significant primary effect of interest is shown in bold. APOE = apolipoprotein; CI = confidence interval; SE = standard error.
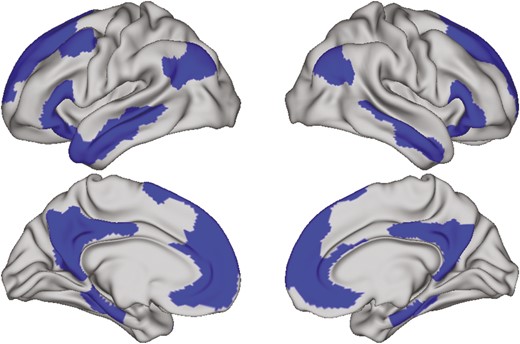
Default mode network defined by Schaefer 400, 17 networks parcellation scheme.
For our control analyses, we did not observe any association with either modality of episodic memory in the 3 networks that were examined (somatomotor: β = −0.04, p = .422; frontoparietal: β= −0.08, p = .116; salience/ventral attention: β= −0.09, p = .072) (Supplementary Tables 7–9). Likewise, running control analyses with 2 other cognitive domains, we did not observe any association between DMN MD and executive function (β = −0.02, p = .640) or DMN MD and verbal fluency (β = −0.04, p = .422; Supplementary Table 10). To examine if cortical MD may be more sensitive than the cortical thickness in detecting early structural-related differences in memory performance, we examined whether DMN cortical thickness is associated with episodic memory. We did not observe any significant association of DMN cortical thickness with either memory modality (visual: β = 0.08, p = .129; verbal: β = 0.03, p = .545; Supplementary Table 11).
Moderation by Childhood Disadvantage Status
We observed a significant DMN MD × childhood disadvantage interaction on visual memory (β = −0.25, p = .014, 95% CI: −0.45, −0.05; Table 3). Specifically, there was a significant negative association between MD and visual memory in the disadvantaged group (β = −0.26, p = .002, 95% CI: −0.42, −0.10), but not in the nondisadvantaged group (β = −0.00, p = .957, 95% CI: −0.13, 0.12; Figure 2). When controlling for education instead of young adult GCA, these interactions and main effects were numerically stronger (Table 3). Finally, there was no interaction between MD and verbal memory (Supplementary Table 12). Similarly, we did not observe any interaction between DMN cortical thickness and childhood disadvantage for either memory modality (visual: β= 0.02, p = .812; verbal: β = 0.04, p = .758; Supplementary Table 13).
Default Mode Network Mean Diffusivity × Childhood Disadvantage Status on Visual Memory: Linear Mixed-Effects Models
| Effects | Covarying for Young Adult GCA | Covarying for Education | ||||
|---|---|---|---|---|---|---|
| N = 331 | N = 338 | |||||
| Estimate (SE) | p Value | 95% CI [Upper, Lower] | Estimate (SE) | p Value | 95% CI [Upper, Lower] | |
| Intercept | −0.39 (0.21) | .067 | [−0.81, 0.03] | −0.61 (0.20) | .003 | [−0.99, −0.23] |
| Age | −0.14 (0.05) | .011 | [−0.24, −0.03] | −0.14 (0.05) | .012 | [−0.24, −0.03] |
| Ethnicity (White/non-White) | 0.49 (0.19) | .010 | [0.12, 0.86] | 0.74 (0.18) | <.0001 | [0.39, 1.09] |
| GCA or education | 0.22 (0.05) | <.0001 | [0.12, 0.32] | 0.12 (0.05) | .022 | [0.02, 0.22] |
| APOE genotype | −0.21 (0.12) | .075 | [−0.43, 0.02] | −0.24 (0.12) | .036 | [−0.47, −0.02] |
| DMN | −0.00 (0.10) | .957 | [−0.13, 0.12] | −0.00 (0.06) | .985 | [−0.46, −0.14] |
| Childhood disadvantage status | −0.06 (0.10) | .585 | [−0.26, 0.15] | −0.00 (0.11) | .977 | [−0.21, 0.21] |
| DMN × Childhood disadvantage status | −0.25 (0.10) | .014 | [−0.45, −0.05] | −0.30 (0.10) | .003 | [−0.50, −0.10] |
Notes: APOE = apolipoprotein; CI = confidence interval; DMN = default mode network; GCA = general cognitive ability; SE = standard error. The primary effects of interest are shown in bold.
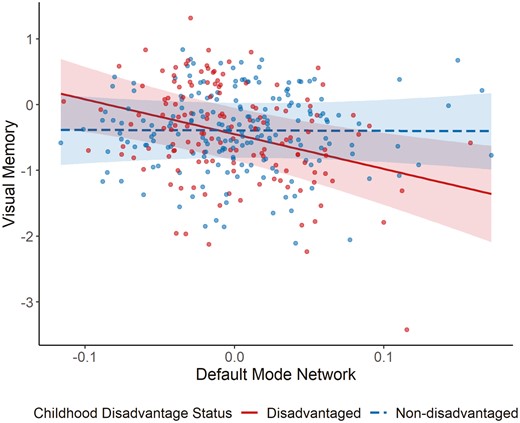
Default mode network mean diffusivity × childhood disadvantage status for visual memory. The interaction effect is plotted (adjusted for the effects of covariates) with childhood disadvantage status for each group plotted in different colors and line types.
To further explore the influence of adult SES on later-life brain–cognition relationships, we computed adult SES based on adult occupation and education using the same Hollingshead and Redlich formula (52). We found no significant DMN MD × adult SES interaction on either visual (β = 0.08, p = .122) or verbal memory (β = 0.01, p = .886; Supplementary Table 14). Moreover, when controlling for adult SES, we still observed a significant DMN MD × childhood disadvantage interaction on visual memory (β = −0.25, p = .015), but not verbal memory (β = −0.06, p = .644; Supplementary Table 15).
Discussion
Childhood exposure to socioeconomic disadvantage is negatively associated with later–life cognitive and brain aging. However, less is known about the role of childhood disadvantage on brain–cognition relationships later in life. Here we focused on middle- and early old-aged men. The mean age of our study sample (62 years) is near a key inflection point for cognitive and brain aging (24–26) and thus may be an optimal time for early prevention and intervention to slow cognitive decline and neurodegeneration. Leveraging cortical MD as an early marker of structural vulnerability in cortical microstructure, we showed that lower DMN microstructural integrity may be indicative of vulnerability to visual memory dysfunction and macrostructural atrophy in cognitively normal middle- and early old-aged adults. Most importantly, we found that childhood disadvantage moderates this association, such that poor visual memory was associated with low DMN cortical microstructural integrity only in individuals from disadvantaged SES backgrounds, whereas their nondisadvantaged counterparts exhibited cognitive resilience in the face of lower microstructural integrity within the DMN (cf (53)). Cognitive resilience refers to “the ability to maintain cognitive performance in the face of adverse brain-related change, measured pathology, or other risk factors for cognitive decline” (53). In this case, nondisadvantaged individuals were able to maintain visual memory performance despite having lower DMN microstructural integrity as their disadvantaged counterparts, who exhibited poorer memory performance and were not cognitively resilient against lower microstructural integrity. Additionally, we further showed that adult SES did not moderate this association and that the moderation effect of childhood disadvantage remained significant even after accounting for adult SES. These results suggest that childhood socioeconomic disadvantage appears to have an enduring influence over later-life brain–cognition relationship regardless of an individual’s SES in adulthood. Finally, the lack of association in other networks with either modality of episodic memory suggests that the observed pattern of effects is stronger in the DMN than in other networks and is not simply a reflection of brain cortical microstructural integrity.
There are a few possibilities for the observed association of DMN MD with only visual memory but not verbal memory. First, an illuminating perspective by Hassabis and Maguire (39) argued that the engagement of DMN during episodic memory recall is accounted for by scene construction, which refers to the process of “mentally generating and maintaining a complex and coherent scene or event.” Consistent with this perspective, the role of spatial navigation and imagery is critical for scene construction during episodic memory recall of past events (39). It follows then that cortical microstructure breakdown within the DMN might manifest as poor performance in the VR task that heavily relies on visual construction and imagery of stimuli, as well as the relative spatial relationship among elements of the stimuli during recall. Conversely, the process of scene construction may be less critical for verbal memory measured by both the CVLT and LM tasks, as these tasks do not necessarily require vivid mental spatial imagery and visual reconstruction of stimuli during recall. Therefore, the role of DMN in scene construction may disproportionately affect visual modality of episodic memory, making it particularly sensitive to cortical microstructural breakdown. Another possibility could be that visual cognitive abilities may be more age-sensitive and manifest aging-related vulnerability earlier than verbal cognitive abilities (54,55). Some early evidence suggested that visual–spatial cognition seems to be more affected by aging than verbal cognition (54,55) and poor performance on visual memory but not verbal memory predicted risks for AD years before diagnosis (56). In our sample, we did observe a significantly positive age-related association only with visual but not verbal memory (Supplementary Table 5). Thus, it is possible that cortical MD, an early indicator of microstructural neurodegeneration, may be sensitive to visual memory that also tends to manifest dysfunction early in the aging process.
Forms of childhood disadvantage are known to increase early-life exposure to stress and disrupt the hypothalamic–pituitary–adrenal (HPA) axis associated with stress reactivity (57). In middle-aged men, our group previously demonstrated that childhood disadvantage is associated with elevated cortisol levels in midlife (11) and that elevated midlife cortisol levels are associated with poor visual but not verbal memory (58). In particular, the association with visual memory was the strongest of all the different cognitive domains (eg, executive functions, processing speed) examined. Relatedly, the maturation of DMN during childhood is negatively impacted by early-life exposure to environmental adversities including stress (16,17). In light of these findings, it is possible, though speculative, that visual but not verbal memory in midlife may be particularly sensitive to long-term dysregulated HPA axis (eg, elevated cortisol levels) resulting from childhood disadvantage, which may also contribute to aberrant DMN development early in life (16,17). However, we do not have a direct measure of childhood stress to examine this hypothesis. Future work would benefit from considering HPA axis and childhood stress exposure as putative mechanisms through which childhood disadvantage affects brain and cognition later in life.
Prior work from our group suggested that childhood disadvantage indirectly exerts its influence over later-life cognition through young adult GCA (4), which was separately shown to explain a considerable amount of variance in later-life cognition (1). Thus, one possible mechanism by which nondisadvantaged individuals exhibited intact visual memory even with lower cortical microstructural integrity may be that their high young adult GCA reflects cognitive reserve/resources available early in life, which promotes some form of resilience against later-life cognitive decline and neurodegeneration (53). Nonetheless, we cannot be certain if the apparently reduced susceptibility of individuals from nondisadvantaged backgrounds to visual memory dysfunction is due to greater resilience against brain aging or to longstanding differences related to optimal earlier brain development in these nondisadvantaged individuals. Relatedly, it should be noted that the fact that both main and interaction effects remained significant after controlling for young adult GCA suggests that the unique contribution of DMN cortical MD to visual memory performance in late midlife is unlikely to be due to longstanding individual differences in overall cognitive ability.
Finally, there are several limitations to this study. Our sample included all men who were mostly non-Hispanic White, which means results may not generalize to women or different racial/ethnic groups. Second, our childhood disadvantage measure was created based on retrospective report of parental education and occupation, which might be subject to recall bias. However, our sample involved twins, and most of these reports were collected from two members of the same family, which partly mitigates the issue of recall bias. Third, we did not examine whether subnetworks of the DMN may be differentially associated with visual and verbal memory as we did not have strong a priori hypotheses. Nonetheless, it is possible that there may be fine-grained specificity in these subnetworks that could be examined by future work. Finally, due to the lack of a direct measure of childhood stress exposure, we were unable to examine whether our disadvantaged group had higher levels of childhood stress, which could be a putative mechanism that negatively affects DMN development and cognition later in life.
Overall, lower cortical microstructural integrity within the DMN is associated with poorer visual memory in cognitively normal late middle-aged men. This highlights the utility of cortical MD as a potential sensitive structural metric that may reflect susceptibility to progressive memory decline and neurodegeneration early in the aging process. Indeed, for our comparative analysis, cortical thickness, a macrostructural metric that tends to manifest changes later than microstructural changes, did not exhibit any association with visual memory in this late middle-aged cohort. Moreover, the impact of cortical MD on visual memory is moderated by childhood disadvantage and is only pronounced in individuals from families with low parental education and occupation. Therefore, interventions targeting childhood socioeconomic disadvantage may be beneficial for later-life cognitive and brain aging, as it may facilitate both cognitive and brain development and subsequent cognitive resilience against brain aging and pathology in old age. Our findings serve as a first step toward understanding the cognitive relevance of network-level cortical microstructure in late middle-aged adults. It would be interesting for future research to expand investigations of cortical microstructure into other specialized functional networks and ascertain their implications for different cognitive functions.
Funding
This work was supported by the National Institute on Aging at the National Institutes of Health (R01 AG050595 to W.S.K., C.E.F., M.J.L.; R01 AG022381 to W.S.K.; R01 AG064955 to W.S.K.; R01 AG037985 to C.E.F.; R01 AG018384 to M.J.L. P01 AG055367 to C.E.F.; and K01 AG063805 to J.A.E.).
Conflict of Interest
A.M.D. is a founder and holds equity in CorTechs Laboratories, Inc. and also serves on its Scientific Advisory Board. He is a member of the Scientific Advisory Board of Human Longevity, Inc. and receives funding through research agreements with General Electric Healthcare and Medtronic, Inc. The terms of this arrangement have been reviewed and approved by the University of California, San Diego, in accordance with its conflict of interest policies. All other authors have nothing to disclose.
Acknowledgments
We would also like to acknowledge the continued cooperation and participation of the members of the VETR and their families. The U.S. Department of Veterans Affairs, Department of Defense; National Personnel Records Center, National Archives and Records Administration; National Opinion Research Center; National Research Council, National Academy of Sciences; and the Institute for Survey Research, Temple University provided invaluable assistance in the creation of the Vietnam Era Twin Registry (VETR). The Cooperative Studies Program of the U.S. Department of Veterans Affairs provided financial support for development and maintenance of the VETR. The content is the sole responsibility of the authors and does not necessarily represent official views of the NIA, NIH, or VA.
References
Author notes
Joint senior authors.

