


Abstract
There is a scarcity of studies examining the longitudinal relationship between dynapenic abdominal obesity (DAO; ie, impairment in muscle strength and high waist circumference) and future fall risk. Therefore, we aimed to investigate the prospective association between DAO at baseline and falls occurring during 2 years of follow-up in a nationally representative sample of middle-aged and older individuals from Ireland.
Data from 2 consecutive waves of the Irish Longitudinal Study on Ageing survey were analyzed. Dynapenia was defined as handgrip strength of <26 kg for men and <16 kg for women. Abdominal obesity was defined as a waist circumference of >88 cm for women and >102 cm for men. DAO was assessed at Wave 1 (2009–2011) and was defined as having both dynapenia and abdominal obesity. Falls occurring between Wave 1 and Wave 2 (2012–2013) were self-reported. Multivariable logistic regression analysis was conducted.
Data on 5 275 individuals aged ≥50 years were analyzed (mean [standard deviation {SD}] age 63.2 [8.9] years; 48.8% males). After adjustment for potential confounders, compared to no dynapenia and no abdominal obesity at baseline, DAO was significantly associated with 1.47 (95% confidence interval [CI]: 1.14–1.89) times higher odds for falls at 2-year follow-up. Dynapenia alone (odds ratio [OR] = 1.08; 95% CI: 0.84–1.40) and abdominal obesity alone (OR = 1.09; 95% CI: 0.91–1.29) were not significantly associated with falls at follow-up.
DAO increased the risk for falls among middle-aged and older adults in Ireland. Interventions to prevent or reverse DAO may be beneficial for fall reduction.
Each year an estimated 684 000 individuals die from falls globally, and adults over 60 years of age suffer the greatest number of injurious falls (1). Importantly, falls are the second leading cause of unintentional injurious deaths globally, and 37 million falls that are severe enough to require medical attention occur each year (1). Moreover, falls are associated with lower levels of quality of life (2) and mental health complications such as depression (3). Moreover, falls can leave an older individual with a disability severe enough to deprive independence (4). Importantly, falls among older adults are costly, for example, in the United States, approximately $50 billion is spent on medical costs related to nonfatal fall injuries annually, while $754 million is spent in relation to fatal falls (5). Given this background, it is important to identify risk factors of falls among older adults to inform targeted preventive strategies.
Although a plethora of risk factors for falls have been identified to date (eg, impaired balance and gait, polypharmacy, history of previous falls, age, female gender, visual impairments, and attention and executive dysfunction) (6,7), one potentially important but understudied risk factor is dynapenic abdominal obesity (DAO; ie, impairment in muscle strength and high waist circumference) (8). DAO may increase the risk of falls via decreased postural stability caused by abdominal fat accumulation. Moreover, the impaired muscular system in DAO may lead to difficulties responding to postural correction with sufficient strength and speed, subsequently resulting in falls (9). However, to date, only a few studies exist on this topic. Specifically, in 1 longitudinal study with 14 years of follow-up including 4 987 individuals aged 60 years and over from the United Kingdom (English Longitudinal Study on Ageing), compared to no dynapenia and no abdominal obesity, dynapenia alone, abdominal obesity alone, and DAO were associated with 1.181 (95% confidence intervals [CI]: 1.002–1.392), 1.033 (95% CI: 0.930–1.147), and 1.195 (95% CI: 1.006–1.421) times higher risk for falls (9). Next, in a more recent longitudinal study using the same data set but with a shorter follow-up period (ie, 2 years; n = 4 239, age 60–87 years) and with a more limited number of covariates used for adjustment (ie, only sex and age), the corresponding figures were 1.4 (95% CI: 1.1–1.9), 1.3 (95% CI: 1.1–1.5), and 1.7 (95% CI: 1.3–2.2) (10). In another small longitudinal study (n = 201 older females) from Brazil with 18 months of follow-up, it was found that DAO (vs. no dynapenia and no abdominal obesity) was associated with a significant 3.6 (95% CI: 1.3–9.8) times higher risk for falls (11). In this study, the corresponding estimates for dynapenia only and abdominal obesity-only groups were 2.3 (95% CI: 0.9–6.1) and 1.4 (95% CI: 0.4–4.8), respectively. Finally, 1 cross-sectional study from Brazil including people aged ≥60 years found that compared to no dynapenia and no abdominal obesity, the relative risk ratio (95% CI) for dynapenia alone, abdominal obesity alone, and DAO were 1.80 (1.02–3.19), 1.90 (1.02–3.55), and 2.06 (1.04–4.10), respectively (12). To the best of the authors’ knowledge, no other studies exist on this topic. Clearly more longitudinal research is needed in different populations to confirm or refute the findings of the 3 previous longitudinal studies on this topic, of which one is severely limited in terms of generalizability given that it only included women and had a small sample size.
Importantly, although there are studies on sarcopenic obesity and falls, sarcopenia is a distinct concept as it consists of loss of skeletal muscle mass, which often does not concur with muscle strength (13,14). Furthermore, skeletal muscle mass has less prognostic value than muscle strength in predicting worsening disability and health outcomes (14,15). On the other hand, among adiposity indexes, waist circumference (ie, a marker of central obesity) is most strongly associated with fall-related outcome among older adults (16). These findings point to the possibility of a particularly high risk for falls among people with both dynapenia and abdominal obesity.
Given this background, the present study aimed to investigate the association between DAO and falls in a representative sample of 5 275 individuals aged ≥50 years from Ireland with 2 years of follow-ups.
Method
The Survey
We analyzed data from 2 consecutive waves of the Irish Longitudinal Study on Ageing (TILDA) survey. Full details of the survey, including its sampling methods, have been described in detail elsewhere (17–19). Briefly, this was a community-based survey of middle-aged and older adults residing in Ireland conducted by Trinity College, Dublin. The first wave (Wave 1) or the baseline survey was conducted between October 2009 and February 2011, and the second wave (Wave 2) was undertaken between April 2012 and January 2013. The target sample consisted of all individuals living in private households aged 50 and over in Ireland. Clustered random sampling was used to obtain nationally representative samples. The first wave excluded institutionalized individuals, anyone with known dementia, or anyone unable to personally provide written informed consent to participate because of severe cognitive impairment. Trained personnel conducted interviews with the use of computer assisted personal interviewing (CAPI). For sensitive questions (eg, alcohol consumption), participants were asked to fill in a self-completion questionnaire, which was returned after the interview. The response rate of Wave 1 was 62% and that of Wave 2 was 86%. All respondents who completed the CAPI interview were invited to participate in a health assessment in 1 of 2 dedicated health centers in Dublin or Cork, the 2 largest cities in Ireland. Respondents who were unable and/or unwilling to attend a health assessment center were given the option of a shorter, home-based assessment. Trained research nurses carried out all of the health assessments and the same procedures were followed in the health center and the home. A total of 5 036 participants opted for a health center assessment and 861 underwent a home-based assessment. Sampling weights were generated with respect to age, sex, and educational attainment in the Quarterly National Household Survey 2010. Ethical approval for TILDA was obtained by the Faculty of Health Sciences Ethics Committee of Trinity College, Dublin. Written informed consent was obtained from all participants.
Falls Occurring After Wave 1
Information on falls that occurred after the baseline survey was obtained at Wave 2 with the question “Have you fallen since the last interview?” with “Yes” and “No” answer options. Those who answered affirmatively were also asked how many times they had fallen since the last interview, and 2 or more falls were considered multiple falls. Furthermore, another question asked whether there was an injury serious enough to need medical treatment. Those who answered affirmatively were considered to have had an injurious fall.
Dynapenia, Abdominal Obesity, and Dynapenic Abdominal Obesity at Baseline
Grip strength was measured with a Baseline (Fabrication Enterprises Inc., White Plains, NY) hydraulic hand dynamometer. Respondents with swelling, inflammation, severe pain, or recent injury to their hand/wrist, and those with surgery to their hand/wrist in the last 6 months were excluded. Dynapenia was defined as <26 kg for men and <16 kg for women (20), using the average value of the 2 handgrip measurements of the dominant hand. For waist circumference, the waist was defined as the point midway between the iliac crest and the costal margin (lower rib). The tape was kept horizontal and the measurement to the nearest millimeter was taken. Abdominal obesity was defined as a waist circumference of >88 cm for women and >102 cm for men (21). Participants were divided into 4 groups according to dynapenia and abdominal obesity status: no dynapenia and no abdominal obesity, dynapenia alone, abdominal obesity alone, and dynapenia and abdominal obesity (ie, DAO).
Control Variables
The selection of the control variables was based on past literature (9,12,22) and included sex, age, education, marital status (married/cohabiting, never married, and separated/divorced/widowed), alcohol consumption (nondrinkers, light/moderate drinkers, and heavy drinkers) (23), physical activity, number of chronic physical conditions, polypharmacy, cognitive impairment, depression, and previous falls. Education was classified as: primary (some primary/not complete and primary or equivalent); secondary (intermediate/junior/group certificate or equivalent and leaving certificate or equivalent); and tertiary (diploma/certificate, primary degree, and postgraduate/higher degree). Physical activity was assessed with the short form of the International Physical Activity Questionnaires (IPAQ) (24), and participants were classified as having low, moderate, or high levels of physical activity based on established criteria. Chronic physical conditions were based on self-reported doctor’s diagnosis of the following 14 conditions: asthma, arthritis, cancer, chronic lung disease, cirrhosis, diabetes, eye disease, heart disease, high cholesterol, hypertension, osteoporosis, stomach ulcer, stroke, and varicose ulcer. The number of chronic conditions was summed and categorized as 0, 1, and ≥2 conditions. Cognitive impairment was assessed by the Mini-Mental State Examination (25). We used a cut-point of <23 to define cognitive impairment as, this cut-off has been validated as being optimal for screening for dementia in Irish community-based samples (26). Polypharmacy was defined as taking ≥5 medications (27). The scale used for depressive symptoms was the 20-item Center for Epidemiologic Studies Depression (CES-D) (28), which assesses symptoms experienced in the 7 days preceding the survey. A positive screen for depression was defined as a cut-off score ≥16. This cut-off point has been associated with 100% sensitivity and 88% specificity for major depression in community-dwelling older adults (29). Previous falls referred to having fallen in the past 12 months. The control variables were assessed in Wave 1. The sample weighting and the complex study design including clustering within households were taken into account to obtain nationally representative estimates using the Stata svy command.
Statistical Analysis
The analysis was conducted using Stata version 14.2 (StataCorp LLC, College Station, TX). A total of 8 504 people aged ≥50 years (n = 8 175) and their spouses or partners younger than 50 years (n = 329) participated in Wave 1. Of these 8 504 people, 7 207 were followed at Wave 2. Our analytical sample consisted of (a) participants aged ≥50 years at Wave 1 who had information on handgrip strength and waist circumference at Wave 1; and (b) those who provided data on falls at Wave 2. Thus, the final sample consisted of 5 275 individuals. The difference in sample characteristics between the dynapenia/abdominal obesity groups at baseline was tested by Chi-squared tests and 1-way analysis of variance (ANOVA) for categorical and continuous variables, respectively. Multivariable logistic regression analysis was conducted to assess the association between the 4-category variable on dynapenia, abdominal obesity, or both (exposure) and falls (including multiple falls and injurious falls) at follow-up (outcome), with no dynapenia and no abdominal obesity being the reference category, while adjusting for sex, age, education, marital status, alcohol consumption, physical activity, number of chronic conditions, polypharmacy, cognitive impairment, depression, and previous falls. In order to assess whether the magnitude of the association differs by sex, or age groups (ie, 50–64 years and ≥65 years), we conducted interaction analysis by including the product term of the variable on dynapenia/abdominal obesity status and sex or age group. Since preliminary analysis showed that there is no significant interaction, analyses were not stratified by sex or age groups. We also assessed whether there is significant interaction in the association between dynapenia and abdominal obesity by constructing a model that includes these 2 variables and the product term of dynapenia × abdominal obesity. Furthermore, another model including handgrip strength and waist circumference as continuous variables with their interaction term was also constructed to assess whether there is significant interaction between these 2 measures. Results are expressed as odds ratios (ORs) and their 95% CIs. A p value <.05 was considered to be statistically significant.
Results
The analytical sample consisted of 5 275 individuals aged ≥50 years. The prevalence of falls at follow-up was 22.1% (multiple falls 8.9% and injurious falls 9.6%), while the prevalence of dynapenia only, abdominal obesity only, and DAO was 9.8%, 39.7%, and 11.6%, respectively. The sample characteristics are shown in Table 1. The mean (standard deviation [SD]) age was 63.2 (8.9) years and 48.8% were males. Those with DAO had the highest prevalence of female sex, lower education, marital status of separated/divorced/widowed, nondrinking, low physical activity, multiple chronic physical conditions, polypharmacy, cognitive impairment, depression, and previous falls, compared to no dynapenia and no abdominal obesity, dynapenia alone, and abdominal obesity alone. The prevalence of falls at follow-up was highest among those with DAO at baseline (Figure 1). For example, this prevalence was only 18.6% among those without dynapenia or abdominal obesity but this increased to 33.0% among those with DAO. After adjustment for potential confounders, compared to no dynapenia and no abdominal obesity at baseline, DAO was significantly associated with 1.47 (95% CI: 1.14–1.89) times higher odds for falls at a 2-year follow-up. Dynapenia alone (OR = 1.08; 95% CI: 0.84–1.40) and abdominal obesity alone (OR = 1.09; 95% CI: 0.91–1.29) were not significantly associated with falls at follow-up (Table 2). When the reference category was changed to dynapenia alone or abdominal obesity alone, the OR (95% CI) of DAO was 1.36 (1.00–1.84; p = .054) and 1.35 (1.06–1.71; p = .014), respectively. Interaction analysis showed that there is no multiplicative interaction between dynapenia and abdominal obesity. This was also the case when handgrip strength and waist circumference were included in the model as continuous variables (ie, no significant interaction). The results for multiple falls and injurious falls were similar with only DAO (not dynapenia only or abdominal obesity only) being significantly associated with multiple falls (OR = 1.80; 95% CI: 1.24–2.60) and injurious falls (OR = 1.46; 95% CI: 1.03–2.06; Table 3).
Sample Characteristics (Overall and by Dynapenia/Abdominal Obesity Status)
| Characteristic | Overall | D(−) AO (−) | D(+) AO (−) | D(−) AO (+) | D(+) AO (+) | p Value* | |
|---|---|---|---|---|---|---|---|
| Sex | Female | 51.2 | 44.9 | 56.9 | 52.8 | 62.0 | <.001 |
| Male | 48.8 | 55.1 | 43.1 | 47.2 | 38.0 | ||
| Age (y) | Mean (SD) | 63.2 (8.9) | 60.7 (8.2) | 67.8 (9.0) | 62.6 (8.3) | 69.7 (8.7) | <.001 |
| Education | Primary | 36.1 | 27.1 | 44.2 | 37.6 | 54.9 | <.001 |
| Secondary | 44.3 | 48.7 | 41.8 | 43.7 | 33.6 | ||
| Tertiary | 19.6 | 24.3 | 14.0 | 18.7 | 11.5 | ||
| Marital status | Married cohabiting | 71.4 | 74.8 | 65.4 | 74.2 | 55.3 | <.001 |
| Never married | 8.1 | 8.7 | 8.5 | 7.2 | 8.6 | ||
| Separated/divorced/widowed | 20.6 | 16.5 | 26.2 | 18.6 | 36.0 | ||
| Alcohol consumption | Nondrinking | 28.5 | 22.7 | 36.3 | 27.9 | 44.2 | <.001 |
| Light/moderate drinking | 43.8 | 46.7 | 43.3 | 42.9 | 37.8 | ||
| Heavy drinking | 27.7 | 30.6 | 20.4 | 29.2 | 18.0 | ||
| Physical activity | Low | 30.2 | 22.7 | 31.4 | 31.6 | 49.8 | <.001 |
| Moderate | 34.4 | 34.3 | 42.1 | 34.2 | 28.9 | ||
| High | 35.4 | 43.0 | 26.4 | 34.2 | 21.3 | ||
| No. of chronic | 0 | 19.4 | 26.8 | 15.9 | 16.3 | 8.6 | <.001 |
| physical condition | 1 | 26.1 | 30.8 | 24.6 | 24.5 | 16.9 | |
| ≥2 | 54.5 | 42.4 | 59.5 | 59.2 | 74.6 | ||
| Polypharmacy | No | 78.7 | 88.8 | 69.6 | 76.7 | 59.0 | <.001 |
| Yes | 21.3 | 11.2 | 30.4 | 23.3 | 41.0 | ||
| Cognitive impairment | No | 97.2 | 98.7 | 95.3 | 97.7 | 91.5 | <.001 |
| Yes | 2.8 | 1.3 | 4.7 | 2.3 | 8.5 | ||
| Depression | No | 91.0 | 92.8 | 90.0 | 90.8 | 86.1 | <.001 |
| Yes | 9.0 | 7.2 | 10.0 | 9.2 | 13.9 | ||
| Previous falls | No | 80.4 | 82.4 | 77.2 | 81.3 | 73.5 | <.001 |
| Yes | 19.6 | 17.6 | 22.8 | 18.7 | 26.5 |
Notes: Data are % unless otherwise stated. All data were obtained at Wave 1. ANOVA = analysis of variance; AO = abdominal obesity; D = dynapenia; SD = standard deviation.
*p Value was estimated by chi-squared test and one-way ANOVA for categorical and continuous variables, respectively.
Prospective Association Between Dynapenia, Abdominal Obesity, or Both at Baseline and Falls at Follow-Up Estimated by Multivariable Logistic Regression
| Characteristic | OR | 95% CI | p Value | |
|---|---|---|---|---|
| Dynapenia/ | D (−) AO (−) | 1.00 | ||
| Abdominal obesity | D (+) AO (−) | 1.08 | [0.84, 1.40] | .543 |
| Status | D (−) AO (+) | 1.09 | [0.91, 1.29] | .343 |
| D (+) AO (+) | 1.47 | [1.14, 1.89] | .003 | |
| Sex | Female | 1.00 | ||
| Male | 0.83 | [0.71, 0.97] | .017 | |
| Age (y) | 1.02 | [1.01, 1.03] | <.001 | |
| Education | Primary | 1.00 | ||
| Secondary | 1.18 | [0.97, 1.42] | .095 | |
| Tertiary | 1.31 | [1.08, 1.58] | .006 | |
| Marital status | Married cohabiting | 1.00 | ||
| Never married | 1.26 | [0.97, 1.65] | .085 | |
| Separated/divorced/widowed | 1.20 | [0.99, 1.46] | .060 | |
| Alcohol consumption | Nondrinking | 1.00 | ||
| Light/moderate drinking | 1.03 | [0.84, 1.27] | .792 | |
| Heavy drinking | 1.15 | [0.92, 1.44] | .226 | |
| Physical activity | Low | 1.00 | ||
| Moderate | 0.95 | [0.79, 1.14] | .601 | |
| High | 0.99 | [0.81, 1.21] | .935 | |
| No. of chronic physical condition | 0 | 1.00 | ||
| 1 | 0.89 | [0.71, 1.12] | .329 | |
| ≥2 | 1.28 | [1.03, 1.59] | .026 | |
| Polypharmacy | No | 1.00 | ||
| Yes | 1.09 | [0.89, 1.33] | .415 | |
| Cognitive impairment | No | 1.00 | ||
| Yes | 0.98 | [0.59, 1.63] | .931 | |
| Depression | No | 1.00 | ||
| Yes | 1.81 | [1.42, 2.31] | <.001 | |
| Previous falls | No | 1.00 | ||
| Yes | 3.10 | [2.64, 3.64] | <.001 |
Notes: Model is mutually adjusted for all variables in the Table. Falls (outcome) were those which were assessed at Wave 2 and referred to those that occurred since Wave 1. AO = abdominal obesity; CI = confidence interval; D = dynapenia; OR = odds ratio.
Prospective Association Between Dynapenia, Abdominal Obesity, or Both at Baseline and Multiple Falls or Injurious Falls at Follow-Up Estimated by Multivariable Logistic Regression
| Multiple Falls | Injurious Falls | |||||
|---|---|---|---|---|---|---|
| Characteristic | OR | 95% CI | p Value | OR | 95% CI | p Value |
| D (−) AO (−) | 1.00 | 1.00 | ||||
| D (+) AO (−) | 1.31 | [0.90, 1.91] | .153 | 1.06 | [0.74, 1.53] | .733 |
| D (−) AO (+) | 1.23 | [0.95, 1.59] | .112 | 0.98 | [0.77, 1.26] | .892 |
| D (+) AO (+) | 1.80 | [1.24, 2.60] | .002 | 1.46 | [1.03, 2.06] | .033 |
Notes: Models are adjusted for sex, age, education, marital status, alcohol consumption, physical activity, number of chronic physical conditions, polypharmacy, cognitive impairment, depression, and previous falls. Multiple or injurious falls (outcomes) were those which were assessed at Wave 2 and referred to those that occurred since Wave 1. AO = abdominal obesity; CI = confidence interval; D = dynapenia; OR = odds ratio.
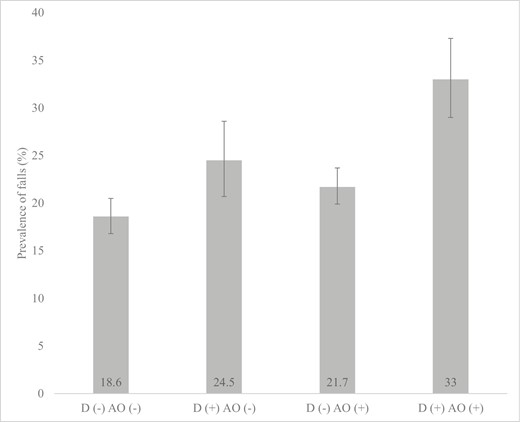
Prevalence of falls at follow-up by dynapenia and abdominal obesity status at baseline. AO = abdominal obesity; D = dynapenia. Falls were those which were assessed at Wave 2 and referred to those that occurred since Wave 1. Bars denote 95% confidence intervals.
Discussion
In this large representative sample of Irish adults aged ≥50 years, after adjustment for multiple confounders, compared to no dynapenia and no abdominal obesity at baseline, DAO was significantly associated with 1.47 (95% CI: 1.14–1.89) times higher odds for falls at a 2-year follow-up. However, dynapenia alone or abdominal obesity alone was not significantly associated with higher odds of falls. The absence of a significant multiplicative interaction between dynapenia and abdominal obesity suggests that these 2 variables additively influence the risk for falls. Furthermore, there was no significant interaction between waist circumference and handgrip strength when these 2 variables were included in the model as continuous variables, which further suggests that the association is likely additive. Similar results were found for multiple falls and injurious falls. Furthermore, significant interactions by age groups and sex were not found.
The finding that DAO is prospectively associated with a particularly high risk for falls is in line with the 3 previous longitudinal studies on this topic (9–11) and adds to this existing literature, which is limited by data derived from only 1 data set from the United Kingdom or a small sample from Brazil only including women, by demonstrating that the association holds in a large representative sample of older Irish adults. Furthermore, our study results also concur with previous findings that dynapenia alone or abdominal obesity alone are either not significantly associated with falls or that their association is weaker compared to DAO. This reinforces the notion that the coexistence of both dynapenia and abdominal obesity is likely to be particularly important in the context of fall risk.
There are several plausible pathways that may explain why DAO is associated with a greater risk of falling among middle-aged and older adults. First, the impaired muscular system in DAO may lead to difficulties responding to postural correction with sufficient strength and speed, subsequently resulting in falls (9,30). Importantly, it has been demonstrated that older individuals exhibit the limited ability of the muscles to react to changing balance threats when compared to young adults, and that unstable older adults present this to a greater extent than younger adults (31,32). Next, as previously discussed, DAO may increase the risk of falls owing to decreased postural stability caused by abdominal fat accumulation. Indeed, in those with abdominal obesity, it is possible that there is a greater proportion of body mass further away from the ankle axis of rotation, requiring a larger ankle torque to counter the greater gravitational torque (33). It is thus possible that both low muscle strength and central obesity interact and negatively affect postural control, and this may underlie the particularly high risk for falls in people with DAO.
Findings from the present study and that of previous research (9,11) suggest that the implementation of interventions to prevent or reverse DAO may subsequently reduce fall risk among the older population. In this sense, it may be prudent to implement interventions to improve or maintain muscle strength and reduce excess central adiposity. Such interventions could focus on the promotion of physical activity, strength training, and improvements in nutrition (34–36). For example, although not restricted to individuals with obesity, the exercise is medicine global initiative is designed to support health care professionals in prescribing exercise for patients by training providers to assess patient physical activity levels, imparting behavioral counseling to increase activity using evidence-based change models, and referring patients to resources to facilitate physical activity. Finally, screening for DAO in both community and clinical settings may help identify those who are at particularly high risk of falls. Importantly, both handgrip strength and waist circumference are practical and simplistic measures to implement in both community and clinical settings as only a dynamometer or tape measure (highly available and low-cost tools) is needed.
The large representative sample of Irish adults aged ≥50 years and the prospective study design are clear strengths of the present study. However, findings must be interpreted in light of several limitations. First, several variables used in the analysis including falls were self-reported, potentially introducing recall and social desirability into the findings. Second, those who were not followed at Wave 2 were more likely to be older and less healthy in terms of mental and physical health (details are shown in Supplementary Table 1 of the Appendix). Thus, it is possible for some level of attrition bias to exist. Third, the age of the cohort was relatively young (ie, ≥50 years), despite falls being primarily a problem of older adults. However, we found no significant interaction in the association between DAO and falls in middle-aged and older age groups. Furthermore, muscle strength was only assessed with handgrip strength. Although handgrip strength is a widely used indicator of muscle strength in large-scale surveys, other measures such as lower extremity strength could potentially perform better in identifying dynapenia. However, this is usually difficult to measure in community-based surveys, and most previous epidemiological studies on DAO have used low handgrip strength as an indicator of dynapenia (11,37). Next, dynapenia and abdominal obesity status or other control variables can have changed during the 2-year follow-up. Finally, although we controlled for key confounding variables, there is a possibility of residual confounding because of unmeasured factors (eg, peripheral sensation and housing conditions).
In conclusion, in the present study including a large representative sample of middle-aged and older adults from Ireland with 2 years of follow-up, it was observed that DAO increased the risk of falls. Interventions to prevent or reverse DAO may be beneficial for fall reduction.
Funding
G.F.L.S is funded by the European Union—Next Generation EU.
Conflict of Interest
None declared.
Data Availability
Researchers interested in using Irish Longitudinal Study on Ageing (TILDA) data may access the data for free from the following sites: Irish Social Science Data Archive (ISSDA) at University College Dublin http://www.ucd.ie/issda/data/tilda/; Interuniversity Consortium for Political and Social Research (ICPSR) at the University of Michigan (Kenny RA. The TILDA, 2009–11. ICPSR34315-v1. Ann Arbor, MI Interuniv Consort Polit Soc Res. 2014:7). Data used in this study was accessed via the Irish Social Science Data Archive – www.ucd.ie/issda, and consist of TILDA (2019) The Irish Longitudinal study on Ageing (TILDA) Wave 1, 2009–11. Version 1.8. Irish Social Science Data Archive. SN:0053-01 – www.ucd.ie/issda/data/tilda/wave1 and TILDA (2019) The Irish Longitudinal study on Ageing (TILDA) Wave 2, 2012–13. Version 2.3. Irish Social Science Data Archive. SN:0053-02 – www.ucd.ie/issda/data/tilda/wave2.

