


Abstract
Age-associated changes in DNA methylation have been implicated as 1 mechanism to explain the development of frailty; however, previous cross-sectional studies of epigenetic age acceleration (eAA) and frailty have had inconsistent findings. Few longitudinal studies have considered the association of eAA with change in frailty. We sought to determine the association between eAA and change in frailty in the MOBILIZE Boston cohort. Participants were assessed at 2 visits 12–18 months apart. Intrinsic, extrinsic, GrimAge, and PhenoAge eAA were assessed from whole-blood DNA methylation at baseline using the Infinium 450k array. Frailty was assessed by a continuous frailty score based on the frailty phenotype and by frailty index (FI). Analysis was by correlation and linear regression with adjustment for age, sex, smoking status, and body mass index. Three hundred and ninety-five participants with a frailty score and 431 with an FI had epigenetic and follow-up frailty measures. Mean (standard deviation) ages were 77.8 (5.49) and 77.9 (5.47) for the frailty score and the FI cohorts respectively, and 232 (58.7%) and 257 (59.6%) were female. All participants with epigenetic data identified as White. Baseline frailty score was not correlated with intrinsic or extrinsic eAA, but was correlated with PhenoAge and, even after adjustment for covariates, GrimAge. Baseline FI was correlated with extrinsic, GrimAge, and PhenoAge eAA with and without adjustment. No eAA measure was associated with change in frailty, with or without adjustment. Our results suggest that no eAA measure was associated with change in frailty. Further studies should consider longer periods of follow-up and repeated eAA measurement.
There have been multiple efforts to capture the aging process or a biological age that is independent of chronological age. Epigenetic age based on patterns of DNA methylation is 1 such measure, which has been associated with multiple adverse health outcomes (1–3). Frailty has sometimes served a dual purpose in this regard: it is defined as a syndrome of loss of recovery to physiologic stress (4). However, it has been treated in the literature as a phenotype-based biological age (5–7).
There is obvious reason for interest in the links between 2 different measures of biological age. As one relies on presumed “upstream” epigenetic factors and the other on “downstream” phenotypes, their links may also help illuminate the biological pathways that affect the aging process and the onset of geriatric syndromes (8). Previous cross-sectional studies have examined the association between epigenetic age acceleration (eAA) and frailty (9,10). However, longitudinal studies of the relationship between these 2 types of measures have not been done. We hypothesized that eAA would be associated with greater severity of frailty, and also with worsening of frailty over time in a well-characterized cohort study of older adults.
Method
Cohort
Data were obtained from the MOBILIZE Boston study (11,12). This study recruited older adults in the Boston area in order to study novel risk factors for falls. Participants attended a baseline visit which included a demographic, functional, and disease survey, physical examination with anthropometry, and phlebotomy. A second visit, which included survey and physical exam elements, was conducted at 18 months.
Continuous Frailty Phenotype
We used a continuous version of the Fried Frailty Phenotype (hereafter frailty score) to allow for detection of change in an 18-month follow-up period. The phenotype score was created by confirmatory factor analysis (CFA), treating frailty as a single latent factor with 5 indicators. We operationalized the frailty phenotype in the MOBILIZE Boston cohort based on how this has been done previously, without cut points for continuous variables (13). “Shrinking” was taken as a yes response to the question, “In the last year, have you lost more than 10 pounds unintentionally, that is, not due to dieting or exercise?” “Slowing” was the faster of two 4-m gait speeds, adjusted for height separately for each sex. “Weakness” was taken as time to complete 1 trial of 5 chair stands, treated as chair stands per second and adjusted for body mass index (BMI) separately for each sex. “Fatigue” was treated as the response to the Center for Epidemiological Studies—Depression scale, Hopkins Revision question, “Over the past week or so, did you feel like you could not get going?” Reported symptom frequency of never or less than 1 day was coded as 0, frequency of 1–2 days was coded as 1.5, 3–4 days was coded as 3.5, 5–7 days and every day were coded as 6. Low physical activity was taken as the participant’s score from the Physical Activity Scale for the Elderly (14). Values were then standardized to conduct CFA.
CFA was performed using baseline data from all participants with complete data using the R package lavaan, producing the normally distributed continuous frailty score with a mean around 0. This factor analysis was then used to calculate frailty scores at baseline and at follow-up.
Frailty Index
We used a previously validated frailty index (FI) to assess frailty by deficit accumulation (15–17). Modifications were made based on the availability of measures in the MOBILIZE Boston cohort at both baseline and follow-up. Details on the components of the FI and modifications made are detailed in Supplementary Table 4. After unassessed items were removed, the index comprised of 35 items covering comorbidities and polypharmacy, function, cognitive testing, physical performance, and anthropometry. Items were scored as 0 or 1 for present or absent except for the 3 performance measures, which were scored as per the original instrument (17). The sum of all of these scores was then divided by 35 to produce the index value. Individuals with more than 4 (~10%) items missing were given a missing value for the FI.
Change in frailty was defined as the difference of follow-up from baseline frailty, such that negative values indicated decreasing frailty and positive values increasing frailty. Change in frailty for both the frailty score and FI was approximately normally distributed. Baseline frailty and change in frailty were both analyzed as continuous measures; categories (eg, robust, prefrail, and nonfrail) were not used.
DNA Methylation
DNA was extracted from whole-blood leukocytes obtained at the baseline study visit. Methylation was assessed using the Illumina Infinium 450k beadchip array. Samples with mean probe intensity less than 10.5 were removed. Raw data were processed with background subtraction and color correction in R using minfi to produce betas. Epigenetic age and age acceleration were calculated using the online Horvath calculator (18). Individuals with DNA discordance between reported and methylation-predicted sex were then removed. We considered 4 different epigenetic age measures to calculate eAA; intrinsic epigenetic age (IEAA), extrinsic epigenetic age (EEAA), PhenoAge, and GrimAge (2,3,18,19). Intrinsic epigenetic age, which uses data from multiple tissues, potentially measures a common aging process throughout the body (1). Extrinsic epigenetic age was derived from whole-blood leukocytes and may reflect the composition of immune cells of the individual being assessed (1). PhenoAge and GrimAge both come from a second generation of epigenetic ages that fit epigenetic data to health and mortality measures in addition to chronological age (2,3).
Analytical Approach
Associations between the 4 measures of eAA and frailty score were assessed by correlation (Pearson’s r) and multiple linear regression. Model covariates included age, sex, smoking status, BMI, and baseline frailty. All analyses were conducted in R version 4.0.2.
Results
Sample Characteristics
Sample characteristics are summarized in Table 1. Seven hundred and fourteen individuals had sufficient data to fit the CFA for the frailty score. Of these, 441 had epigenetic data available to estimate a DNA methylation age, and 395 also had data to calculate the frailty score at their follow-up assessment. For the FI, 763 participants were able to have a baseline FI assessed, 473 of whom had epigenetic data available and 431 had data for a follow-up FI. A total of 545 participants had raw DNA methylation data available, 10 of which were removed due to low probe intensity and 6 were removed due to mismatch between predicted and reported sex.
Sample Characteristics From MOBILIZE Boston Cohort Used to Develop Frailty Score and Frailty Index, Baseline Values for Those With Methylation Data, and Baseline Values for Those With Methylation Data and Follow-up Data
| Continuous Frailty Score | Frailty Index | |||||
|---|---|---|---|---|---|---|
| Variable | Baseline | With Methylation Data | With Methylation and Follow-up Data | Baseline | With Methylation Data | With Methylation and Follow-up Data |
| N = 714 | N = 441 | N = 395 | N = 763 | N = 473 | N = 431 | |
| Age (years) | 78.0 (5.46) | 78.0 (5.51) | 77.8 (5.49) | 78.1 (5.44) | 78.1 (5.48) | 77.9 (5.47) |
| Female gender | 452 (63.3%) | 262 (59.4%) | 232 (58.7%) | 487 (63.8%) | 286 (60.5%) | 257 (59.6%) |
| Race | ||||||
| White | 548 (76.8%) | 441 (100%) | 395 (100%) | 592 (77.6%) | 473 (100%) | 431 (100%) |
| African American | 120 (16.8%) | 0 (0%) | 0 (0%) | 123 (16.1%) | 0 (0%) | 0 (0%) |
| All others | 46 (6.4%) | 0 (0%) | 0 (0%) | 48 (6.3%) | 0 (0%) | 0 (0%) |
| Hispanic | 16 (2.2%) | 6 (1.4%) | 6 (1.5%) | 17 (2.2%) | 6 (1.3%) | 6 (1.4%) |
| Smoking status | ||||||
| Never smoker | 312 (43.8%) | 184 (41.7%) | 164 (41.5%) | 335 (44.0%) | 197 (41.7%) | 179 (41.6%) |
| Former smoker | 367 (51.4%) | 239 (54.2%) | 216 (54.7%) | 390 (51.2%) | 256 (54.2%) | 235 (54.7%) |
| Current smoker | 34 (4.8%) | 17 (3.9%) | 14 (3.5%) | 37 (4.9%) | 19 (4.0%) | 16 (3.7%) |
| BMI (kg/m2) | 27.3 (5.17) | 26.9 (4.60) | 26.8 (4.63) | 27.3 (5.13) | 27.0 (4.57) | 26.9 (4.57) |
| Height (cm) | 164 (9.8) | 164 (9.9) | 164 (9.9) | 164 (9.8) | 164 (9.8) | 164 (9.9) |
| eAA—mean (SD)* | ||||||
| IEAA | — | −0.10 (5.23) | −0.11 (5.27) | — | −0.14 (5.30) | −0.19 (5.29) |
| EEAA | — | −0.16 (6.57) | −0.13 (6.67) | — | −0.18 (6.56) | −0.18 (6.59) |
| GrimAge | — | −0.08 (4.52) | −0.10 (4.56) | — | −0.14 (4.54) | −0.17 (4.57) |
| PhenoAge | — | −0.06 (6.77) | −0.18 (6.86) | — | −0.11 (6.72) | −0.26 (6.76) |
| Frailty index† | −0.01 (0.87) | −0.14 (0.84) | −0.18 (0.82) | 0.19 (0.13–0.28) | 0.18 (0.12–0.26) | 0.18 (0.12–0.26) |
Notes: BMI = body mass index; IQR = interquartile range; SD = standard deviation.
*eAA = epigenetic age acceleration; EEAA = extrinsic epigenetic age acceleration; IEAA = intrinsic epigenetic age acceleration.
†Continuous frailty phenotype is given as mean (SD), while frailty index is given as median (IQR).
Other than differences in race, groups that had data on frailty and/or DNA methylation were broadly similar to those who had only frailty data. Comparing across measures of frailty, most characteristics were broadly similar. However, eAA tended to be greater for those assessed by frailty score than those assessed by FI. Epigenetic data were only available on participants who self-identified as White. Thus, while 22%–23% of the cohort used to fit the CFA or had a baseline FI value were non-White, all participants in the analytic cohorts were White.
Frailty Score Characteristics
Supplementary Tables 1 and 2 give the covariance matrix for the variables used to produce the frailty score and the results of CFA, respectively. These show generally good model fit to data; the χ 2 did show a difference between fitted and observed values, which may be the result of large sample size relative to the number of indicators. Cronbach’s α was 0.57 with standardized data. The distribution of the frailty score is given in Table 1 and the distributions of its items are given in Supplementary Table 3. The mean (standard deviation [SD]) of the score on the sample used to fit the CFA was −0.013 (0.865) and in analytical sample at baseline was −0.14 (0.84).
Supplementary Figure 1 shows the association between baseline and follow-up frailty score. Baseline and follow-up frailty scores were highly correlated, with r (95% confidence interval, p value) of 0.76 (0.72 to 0.80, p < 2.2 × 10⁻¹⁶). Baseline frailty score and change in frailty score were inversely correlated, with r of −0.38 (−0.46 to −0.29, p = 4.98 × 10⁻¹⁵). The mean (SD) change in frailty score was 0.12 (0.56), which is roughly one-eighth of the SD of baseline frailty score. One hundred and sixty-two participants saw a decline in their frailty score over the study period, with the remaining 233 seeing an increase. The change in frailty score was statistically significantly different from 0 by t test (t = 4.20, p value 3.3 × 10⁻⁵).
FI Characteristics
Table 1 gives the distribution of the FI in terms of median (interquartile range [IQR]) as it follows a beta distribution. The median (IQR) in the sample used to assess change in frailty was 0.18 (0.12 to 0.26). Supplementary Table 4 gives the frequency of each deficit in the sample or, for the 3 continuous performance measures which were scored, the mean and SD of the score. Some items were highly prevalent: more than 90% of participants had sensory impairment at baseline even though this only covered vision and touch. By contrast, only 2% of participants reported unintentional weight loss over the past year.
Supplementary Figure 2 shows the association between baseline and follow-up FI. As with the frailty score, we see that baseline and follow-up FI were correlated (r = 0.81 [0.78 to 0.84], p < 2.2 × 10⁻¹⁶), while baseline FI and change in FI were inversely correlated (r = −0.29 [−0.38 to −0.20], p = 5.5 × 10⁻¹⁰). The mean (SD) change in FI was 0.02 (0.06), which was statistically significantly different from 0 by t test (t = 5.84, p value 1.0 × 10⁻⁸). One hundred and forty-two participants saw a decline in frailty score over the study period.
Baseline Frailty and eAA
Associations between baseline frailty and eAA are given in Supplementary Table 5 and Supplementary Figure 3. Correlations between eAA and baseline frailty were less than 0.2 for all eAA measures. For frailty score, all correlations were around or less than 0.1 except for GrimAge, which was 0.171. Correlation was statistically significant for GrimAge and PhenoAge but not IEAA nor EEAA. This pattern largely held in multiple linear regression: after adjustment, IEAA and EEAA had nonsignificant associations with baseline frailty, PhenoAge’s association likewise neared, but did not meet, statistical significance (p = .051), while GrimAge was significantly associated with baseline frailty (4.2 × 10⁻⁵).
By contrast, baseline FI correlations with eAA were consistently around 0.17 except for IEAA, which was 0.030. Likewise, all correlations were statistically significant except for that with IEAA. This pattern held in multiple regression, with all eAA measures except for IEAA having statistically significant associations with baseline frailty after adjustment.
To further explore GrimAge’s relationships, which had statistically significant associations with both measures of baseline frailty, we looked at age-adjusted measures of the 8 epigenetically estimated serum markers and smoking used to construct GrimAge. Results are shown in Supplementary Table 6. While most components were associated with baseline frailty, smoking measured in pack-years was not associated with baseline frailty score nor FI, while leptin was not associated with baseline frailty score.
Change in Frailty and eAA
Results for the associations between eAA and the change in frailty are shown in Table 2 and Figure 1. For correlations between eAA and change in frailty, none of the correlations were statistically significant for any measure of eAA with either change in frailty score or change in FI. When adjusted for potential confounders, this pattern remained across all measures of eAA for both measures of frailty.
Correlations and Multiple Regression Coefficients† Between eAA Change in Frailty
| Change in Frailty Score | Change in Frailty Index | |||||
|---|---|---|---|---|---|---|
| Correlation | r2 | 95% CI | p Value | r2 | 95% CI | p Value |
| IEAA | −0.013 | −0.112 to 0.086 | .793 | 0.029 | −0.065 to 0.123 | .546 |
| EEAA | 0.026 | −0.073 to 0.124 | .612 | −0.017 | −0.111 to 0.078 | .729 |
| GrimAge | −0.065 | −0.163 to 0.034 | .195 | 0.034 | −0.060 to 0.128 | .479 |
| PhenoAge | −0.045 | −0.143 to 0.054 | .368 | −0.039 | −0.133 to 0.055 | .415 |
| Regression | Coefficient | 95% CI | p Value | Coefficient | 95% CI | p Value |
| IEAA | 0 | −0.010 to 0.009 | .946 | 0.001 | −0.001 to 0.002 | .368 |
| EEAA | 0.005 | −0.003 to 0.013 | .211 | −0 | −0.001 to 0.001 | .702 |
| GrimAge | 0.001 | −0.013 to 0.014 | .924 | 0.001 | −0 to 0.003 | .126 |
| PhenoAge | −0.001 | −0.008 to 0.007 | .882 | −0 | −0.001 to 0.001 | .476 |
Notes: BMI = body mass index; CI = confidence interval; eAA = epigenetic age acceleration; EEAA = extrinsic epigenetic age acceleration; IEAA = intrinsic epigenetic age acceleration.
†Multiple regressions include adjustment for age, sex, current and former smoking, BMI, and (change in frailty only) baseline frailty.
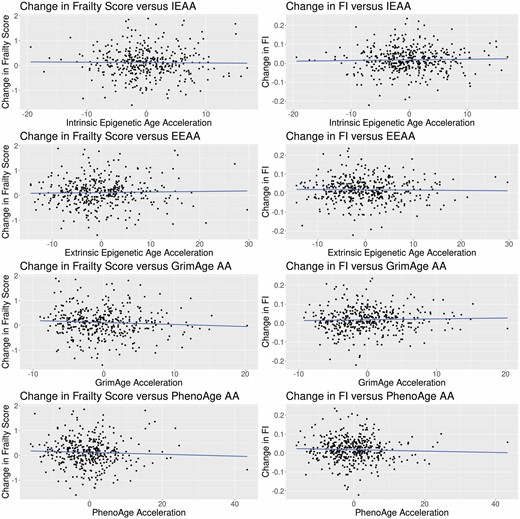
Scatterplots of change in frailty versus epigenetic age acceleration. AA = age acceleration; EEAA = extrinsic epigenetic age acceleration; FI = frailty index; IEAA = intrinsic epigenetic age acceleration.
Discussion
We found associations between eAA and baseline frailty for some eAA measures, and no association between eAA and change in frailty. The lack of association between eAA and change in frailty might have been due to the short time period between measures or may signify that frailty does not progress based on age-related DNA methylation. There may also be biological aging not captured by a relative measure such as eAA. That is, among the older adults in the MOBILIZE Boston cohort, biological aging may be advanced enough—regardless of how it has progressed relative to chronological age—that progression of frailty is independent of eAA.
Another possibility is that, instead of aging biology preceding frailty, there may be reverse causation whereby changes in frailty or other phenotypes lead to changes in DNA methylation. This is consistent with our knowledge that epigenetic markers are influenced by the environment, including health of the individual. Serial measures of DNA methylation will be required to disentangle the possibility of reverse causation, and longer periods of follow-up may be necessary to demonstrate the effects of DNA methylation on changes in the frailty phenotype.
Our results finding an association between PhenoAge and GrimAge eAA with frailty were consistent using both phenotypic and deficit accumulation frailty models (10). The finding of variable associations between IEAA and EEAA and frailty is in line with existing literature. A recent systematic review found 3 studies of the association between IEAA or EEAA and different measures of frailty (9). One found association between IEAA and an FI only after adjustment for age, while another found that such adjustment abolished the association between IEAA and an FI (5,20). A third found that EEAA, but not IEAA, was associated with the frailty phenotype (21). This may be explained by differences in the frailty measures used: a dichotomous measure, such as the frailty phenotype as it is typically used, may be less sensitive than a continuous measure such as an FI. How eAA was calculated, as the difference between epigenetic and chronological age or the residual from regression of epigenetic age on chronological age, may also explain these findings. The stronger associations with baseline frailty for GrimAge and PhenoAge may be related to their incorporation of a greater number of epigenetic loci and their calibration to health conditions or plasma markers and smoking rather than age.
Our study has certain strengths. We used a well-characterized cohort with reliable measures of physical function and activity. We also had a reasonable sample size of older adults with measurement at 2 time points and used 2 continuous measures of frailty representing different models to improve statistical power. Limitations include relatively short follow-up of 18 months, a relatively modest number of individuals who are more frail in the epigenetic sample, and possible regression to the mean with respect to trends in frailty over time. Null findings for change in frailty were unlikely to have been limited by power, given the consistency of our results across 2 measures of frailty, 4 measures of eAA, and both with and without adjustment for covariates. Noise in the assessment of DNA methylation may affect estimates of epigenetic age. The relatively low Cronbach’s α for the frailty phenotype is consistent with other studies; validity in view of its association with outcomes is well-established (22,23).
In conclusion, we found no association between multiple measures of eAA and change in frailty, using both the frailty phenotype and deficit accumulation models. Further, we found inconsistent associations between eAA and frailty, in line with current literature. Further work should consider longer periods of follow-up and the assessment of eAA at multiple time points. Importantly, further work should consider the possibility of reverse causation and explore phenotypic change as a possible cause of eAA.
Acknowledgments
We would like to thank Nicole Gladish, BSc, at the University of British Columbia for her advice on working with raw DNA methylation data.
Funding
This work was supported by the National Institute on Aging: Research Nursing Home Program Project #P01AG004390 and #K24AG070106. T.G.T. is supported by the Boston Pepper Center Grant P30AG031679. Collection of DNA methylation data was supported by National Institutes of Health grant R01ES021733-05. The funding sources had no role in the design and conduct of the study; collection, management, analysis, and interpretation of the data; preparation, review, or approval of the manuscript; and decision to submit the manuscript for publication. The views expressed are those of the authors and do not represent the views of Veterans Affairs or the U.S. Government.
Conflict of Interest
None declared.

