


Abstract
Educational inequalities in all-cause mortality have been observed for decades. However, the underlying biological mechanisms are not well known. We aimed to assess the role of DNA methylation changes in blood captured by epigenetic clocks in explaining these inequalities. Data were from 8 prospective population-based cohort studies, representing 13 021 participants. First, educational inequalities and their portion explained by Horvath DNAmAge, Hannum DNAmAge, DNAmPhenoAge, and DNAmGrimAge epigenetic clocks were assessed in each cohort via counterfactual-based mediation models, on both absolute (hazard difference) and relative (hazard ratio) scales, and by sex. Second, estimates from each cohort were pooled through a random effect meta-analysis model. Men with low education had excess mortality from all causes of 57 deaths per 10 000 person-years (95% confidence interval [CI]: 38, 76) compared with their more advantaged counterparts. For women, the excess mortality was 4 deaths per 10 000 person-years (95% CI: −11, 19). On the relative scale, educational inequalities corresponded to hazard ratios of 1.33 (95% CI: 1.12, 1.57) for men and 1.15 (95% CI: 0.96, 1.37) for women. DNAmGrimAge accounted for the largest proportion, approximately 50%, of the educational inequalities for men, while the proportion was negligible for women. Most of this mediation was explained by differential effects of unhealthy lifestyles and morbidities of the World Health Organization (WHO) risk factors for premature mortality. These results support DNA methylation-based epigenetic aging as a signature of educational inequalities in life expectancy emphasizing the need for policies to address the unequal social distribution of these WHO risk factors.
Inequalities in mortality by educational attainment have been observed for decades in developed countries (1) and, in some countries, these inequalities are widening (2). The putative causal effect of education on mortality has been corroborated by studies of compulsory schooling laws (3,4), experimental, and twin studies (4,5). Notably, the review by Galama et al (4). points to consistent sex differences, whereby men experience larger inequalities than women. Three broad theoretical frameworks have been suggested to assess potential mechanisms underlying the effect of education on health and ultimately mortality. The Fundamental Cause Theory (6) indicates the role of access to material and nonmaterial resources encompassing income, social connections, and lifestyle, while the Human Capital Theory (7) identifies the skills and abilities yielding increased economic productivity, while the Signaling Perspective (8) emphasizes the social returns of credentials earned by educational attainment. Many of the ensuing mechanisms have been assessed in empirical studies, including unfavorable working conditions and economic hardship, decreased psychosocial resources, unhealthy lifestyle, and chronic health conditions (4,9–13). Ultimately, these intermediate mechanisms affect various biological processes related to health and survival, which have been conceptualized by the framework of biological embedding or social-to-biological transition (14,15). Among the proposed biological mechanisms, heightened systemic inflammation (16–18), dysregulation of physiological systems summarized by allostatic load (19), and elevated epigenetic aging of immune cells (20–22) have been consistently observed in individuals with lower education in multiple populations. Notably, biomarkers of epigenetic aging from blood-derived DNA methylation (DNAm) profiles have been consistently associated with lifestyle-related behaviors, morbidities, such as diabetes, hypertension, and cancer, and are predictors of mortality (23–26).
Although plausible from previous observations, the mediating role of epigenetic aging in explaining educational inequalities in mortality has been rarely investigated. One study, of older women in the United States, found that only a small portion of educational inequalities in mortality was explained by epigenetic aging measured through the DNAmPhenoAge biomarker (27). However, other epigenetic biomarkers and the path-specific contribution of epigenetic aging independent of unhealthy lifestyles and morbidities (LM) have not been examined. Thus, the independent mediating role of epigenetic aging in social inequality–associated mortality has not been fully investigated.
In this study, we assessed the mediating role of blood DNAm-based epigenetic aging between education and all-cause mortality in multiple populations and by sex. Data spanning the social, biological, and mortality end-point layers were derived from 8 population-based cohort studies across 7 countries, totaling 13 021 participants, followed on average for 9 years from an average baseline age of 64. We measured epigenetic age from blood DNAm, known as epigenetic clocks. We considered 4 epigenetic clock biomarkers, namely Horvath’s and Hannum’s DNAmAge, Levine’s DNAmPhenoAge, and Lu’s DNAmGrimAge (28), as they have been commonly studied in the literature, are associated with both education and all-cause mortality in several populations, and capture different aspects of the epigenetic aging processes (28). Whether an individual experienced elevated or mitigated epigenetic aging was estimated by computing the residuals from a regression of the epigenetic clock on chronological age. Thereafter, we refer to these values as Horvath DNAmAA, Hannum DNAmAA, DNAmPhenoAA, and DNAmGrimAA, respectively. We calculated the portion of educational inequalities in all-cause mortality explained by epigenetic aging biomarkers via a 2-step analytic approach: (i) a counterfactual-based mediation method in each cohort (29), (ii) a random-effect meta-analysis to pool estimates across cohorts.
Secondly, in this study, we assessed the potential path-specific contribution of epigenetic aging independent of unhealthy lifestyle factors (current smoking, low physical activity, high alcohol intake, and high body mass index [BMI]) and related morbidities (type 2 diabetes and hypertension). We considered these risk factors as additional mediators as they are on the causal path from educational attainment to all-cause mortality (9–12,30) and are targets of policies to reduce the premature mortality burden (30).
Method
Study Participants’ Selection
A total of 18 cohorts were included in LIFEPATH, an international consortium aiming to disentangle the biological pathways underlying social inequalities in health (31); only adult cohorts were retained for the present study. Of these, we further selected those with available DNAm and subsequent mortality follow-up. Based on these criteria, we included participants from 3 cohorts, namely European Investigation into Cancer and Nutrition-Italy (EPIC-IT) (N = 1 545 in Italy), Melbourne Collaborative Cohort Study (MCCS) (N = 2 816 in Australia), and The Irish Longitudinal Study on Ageing (TILDA) (N = 490 in Ireland). We also gathered data from 5 additional adult cohorts, namely epidemiological investigations of the chances of preventing, recognizing early, and optimally treating chronic diseases in an elderly population (ESTHER) (N = 1 864 in Germany), Cooperative Health Research in the Augsburg Region (KORA) (N = 1 727 in Germany), Multi-Ethnic Study of Atherosclerosis (MESA) (N = 1 264 in the United States of America), Northern Ireland Cohort for the Longitudinal Study of Ageing (NICOLA) (N = 1 981 in Northern Ireland, United Kingdom), and the Rotterdam Study (RS) (N = 1 420 in The Netherlands). Participants were all subsamples of the corresponding cohorts because of available DNAm. A description of these cohorts and the sampling design are presented as Supplementary Material.
Mediation Models, Exposure, Mediators, and Outcome
The proposed mediation structures underlying our study are shown in Figure 1. We designed our mediation modeling to evaluate path-specific mechanisms of educational inequalities in all-cause mortality (outcome). We focused on inequalities driven by educational attainment (exposure). The first model, depicted in Figure 1A, dissected the educational inequalities (total effect of the exposure) into a nontransmitted (direct) effect and a transmitted (indirect) effect by blood DNAm-based markers of epigenetic aging (mediator). In the second model, depicted in Figure 1B, the indirect effect via epigenetic aging biomarkers was disaggregated into a pathway through unhealthy LM, and a pathway independent from the latter. This model assumed that epigenetic aging is downstream of LM mediators as supported by a recent Mendelian randomization (MR) study (32). By comparing the mediated effect via LM and the joint mediated effect via LM and epigenetic aging, we assessed whether epigenetic aging provides additional mediation compared with LM only, or whether the effect of education on all-cause mortality propagates through a pathway affecting epigenetic aging independently of unhealthy LM.
![Mediation models. For the sake of simplicity, we do not include confounders (age and sex). The highest educational attainment represents the exposure and all-cause mortality of the outcome. (A) Adulthood DNA methylation-based epigenetic aging in blood was the investigated mediator. (B) Adulthood unhealthy lifestyle (low physical activity, high alcohol intake, current smoking, and high body mass index [BMI]), morbidities (diabetes and hypertension), and epigenetic aging in blood were the mediators. Unhealthy lifestyle and morbidities (LM) were considered mediators en bloc (considered all at the same time). In the hypothesized mediation model, unhealthy LM influences epigenetic aging (not vice versa).](https://oup.silverchair-cdn.com/oup/backfile/Content_public/Journal/biomedgerontology/77/9/10.1093_gerona_glac041/4/m_glac041_fig1.jpeg?Expires=1749907272&Signature=aSoKpEMJtarD~CdgTv5lZH1YlJnOzSgv0eZV6KJF5upEhO9tlZaCgO9UNWIxzl9MzhRpQdYadbw2qMZdXdpnVWtb9kB6L-BNaEXCZEdrXjTjrHp6LuzXHP78zqQMUtziCZgJ7GUJLrmGnE0NPpSGm573oRZnqvk8jf93HO9gwMu2G3INt2APmOW00HbrEyf0B0GbGdDnQCE7xF-IQvWDXR1wSzw2X9bh4ClTDkVd5H1zgUGf9WPl~Gwr5GTjLHJn50CIxAEuSRrXANId~JCPqFiCdr1uDRY5dWMDU5xZpAYItJwVC3vP~Wi2peWiWhUvO5fRNBhPLfZMAtyDwB8WrQ__&Key-Pair-Id=APKAIE5G5CRDK6RD3PGA)
Mediation models. For the sake of simplicity, we do not include confounders (age and sex). The highest educational attainment represents the exposure and all-cause mortality of the outcome. (A) Adulthood DNA methylation-based epigenetic aging in blood was the investigated mediator. (B) Adulthood unhealthy lifestyle (low physical activity, high alcohol intake, current smoking, and high body mass index [BMI]), morbidities (diabetes and hypertension), and epigenetic aging in blood were the mediators. Unhealthy lifestyle and morbidities (LM) were considered mediators en bloc (considered all at the same time). In the hypothesized mediation model, unhealthy LM influences epigenetic aging (not vice versa).
Educational attainment was measured using the participants’ self-reported highest educational attainment. Answers were categorized as “low education” for any degree lower than upper secondary school and “high education” for attained upper secondary school or above following previous work from the Lifepath group (31). In Supplementary Table 1, for each cohort study, we report the questionnaire labels and their corresponding categorization.
Epigenetic aging in blood, unhealthy LM were included as mediators and measured at the same time, which we set as the baseline for mortality follow-up. In Supplementary Table 2, we report the years of measurement of exposure and mediators for each cohort. The proportion of leukocytes was estimated for each participant according to Houseman’s method (33) and was used in sensitivity analyses as an additional mediator.
Unhealthy lifestyle comprised self-reported current smoking, high alcohol consumption, low level of leisure-time physical activity, and high BMI categorized into 2- or 3-level variables (see Supplementary Material). Morbidities comprised hypertension (either self-reported or measured) and diabetes (either self-reported or measured). As highest education is generally attained in young adulthood whereas study participants were in their mid or late adulthood at baseline (see Supplementary Table 2), the potential for reverse causality was minimized.
Potential confounders were age at baseline (continuous), sex, and childhood socioeconomic conditions (available only in a subset of cohorts and included in a sensitivity analysis). In MESA, race/ethnicity was added as a potential confounder. Additionally, sex was modeled as an effect modifier, as previous studies have shown sex differences in educational inequalities in mortality (4,12,27). The outcome was age to death from any cause, with age as the underlying timescale.
Detailed information about education, lifestyle, morbidities, DNAm, and mortality-related variables in each cohort are reported in Supplementary Material.
Statistical Framework and Analysis
We implemented a 2-step approach, whereby in the first stage parameters of interest were estimated in each cohort study, and in the second stage the ensuing estimates were pooled through a random effect meta-analysis model to consider potential heterogeneities across cohort studies.
In each cohort study, we implemented the counterfactual change of educational attainment from high to low, to estimate the portion of educational inequalities in all-cause mortality explained by the chosen mediator(s). Within this framework, the educational inequalities in all-cause mortality correspond to the total effect of educational attainment, which can be broken down into the direct effect—the portion of the inequalities not explained by a mediator, and the indirect effect—the portion of the inequalities explained by a mediator (29). To estimate the effects of interest in our study—total and indirect—we used the inverse odds ratio weighting (IORW) method (29,34). Under certain identifying conditions (see Supplementary Material), IORW enables estimation of indirect and joint indirect effects (eg, effect of exposure on outcomes mediated by a bloc of mediators). The latter does not depend on a specific causal order among the mediators (35), which is useful in our study because specifying an order among unhealthy lifestyle and/or morbidities would require further modeling assumptions. Additionally, contrary to linear path analysis, the IORW method allows estimation of a more general class of mediation models including those with mediators and/or outcomes measured on a noncontinuous scale (as in our study) and incorporates the potential interaction between exposure and mediator(s). The latter is useful as education and unhealthy lifestyle may interact in affecting mortality (36). Mathematical details of the implemented IORW are described in Supplementary Material.
We assessed effects on both the absolute scale (hazard difference) and the relative scale (hazard ratio). Both measures are useful in understanding and describing inequalities (37).
For analyses related to the model in Figure 1A, a chosen epigenetic aging biomarker was the only mediator, while for analyses related to the model in Figure 1B, 7 mediators were considered. As we were interested in the portion of the total effect explained by epigenetic aging independent of unhealthy LM, we broke down the joint indirect effect by the block of 7 mediators into 2 path-specific indirect effects (38). Specifically, we broke down the joint indirect effect by LM and epigenetic aging into the indirect effect by the block of mediators LM, capturing both pathways education → LM → mortality and education → LM → epigenetic aging → mortality, and the indirect effect by epigenetic aging but not LM (see Figure 1B). We implemented a sequential mediation analysis to estimate the latter indirect effect as the difference between 2 joint indirect effects, the first being a joint indirect effect by all 7 mediators and the second being a joint indirect effect by LM only.
All analyses were conducted on complete data. For the analyses based on the model shown in Figure 1A, we excluded 86 (0.7%) participants with missing information on education or vital status, while for the analyses based on the model shown in Figure 1B, we excluded 771 (5.9%) participants for missing information on education, vital status, and unhealthy LM.
Effects on the hazard difference/ratio scale were estimated by implementing a semiparametric additive/multiplicative hazard model (see Supplementary Material for more details about the implementation of the IORW method). In sensitivity analyses, we evaluated potential deviations from the assumption of constant hazard differences and ratios.
For each cohort, we generated 5 000 bootstrap draws with replacement to derive standard errors for the total and indirect effects.
Finally, we pooled these effects’ estimates via the Hartung–Knapp inverse variance-weighted random effect meta-analysis model. Potential variability across cohorts was assessed through the intercohort variance τ2 and the proportion of intercohort variance due to heterogeneity I2, which lies between 0 and 100 with higher values corresponding to higher heterogeneity (see Supplementary Material).
To assess the sensitivity of our findings to possible violations of the assumptions underlying the identification of the indirect effects, we estimated the indirect effect by epigenetic aging biomarkers (Figure 1A) (i) when including childhood socioeconomic conditions as a potential confounder of the exposure–outcome, exposure–mediator, and mediator–outcome associations; (ii) for various values of a bias function encoding unmeasured, potentially exposure-induced, confounding of the mediator–outcome association (34); and (iii) when incorporating a nondifferential measurement error of 3 years in epigenetic aging biomarkers. To assess the sensitivity of our findings to deviations from the assumption of constant hazard differences/ratios on age, we estimated the effects by incrementally right censoring survival age (ie, simulating the end of follow-up) at 70, 75, 80, and 85 years. Finally, to assess the path-specific mediation by epigenetic aging biomarkers and not leukocyte composition in blood, we ran a sequential mediation analysis based on the model in Supplementary Figure 6. In Supplementary Material, we provide detailed information about sensitivity analyses and childhood socioeconomic conditions.
Results
Characteristics of the Populations
In Table 1, we describe summary statistics for EPIC-IT, ESTHER, KORA, MCCS, MESA, NICOLA, RS, and TILDA, separately for men and women. There were more men in MCCS (61%) and more women in EPIC-IT (60%), whereas in the other 6 cohorts there was a similar proportion of men and women. The average age at baseline ranged from 53 years in EPIC-IT to 70 years in MESA. In all cohorts, except MESA, TILDA, RS (in men), and NICOLA (in women), there were more individuals with low educational attainment than high. The average follow-up time ranged from 5 years in NICOLA to 15 years in EPIC-IT. Age-standardized mortality rates were higher for men than women, except in EPIC-IT where they were similar. For women, they ranged from 52 deaths per 10 000 person-years in NICOLA to 262 in ESTHER, while for men mortality rates ranged from 100 in NICOLA to 400 in ESTHER. Higher mortality rates were associated with higher prevalence of low educated men and women (Spearman correlation of 0.55 and 0.76, respectively), and not to a median year of birth.
Characteristics of Participants (N = 13 021)
| Study | Participants N (%) | Age at Baseline Mean (SD) | High/Low Education N (%) | Death N (%) | Follow-up Years Mean (SD) | Mortality Rate |
|---|---|---|---|---|---|---|
| EPIC-IT | ||||||
| Men | 607 (40) | 53.7 (6.7) | 231 (38)/376 (62) | 135 (22) | 14.9 (4.4) | 151.2 |
| Women | 917 (60) | 52.9 (7.6) | 255 (28)/662 (72) | 147 (16) | 15.3 (3.5) | 160.6 |
| ESTHER | ||||||
| Men | 870 (48) | 62.7 (6.6) | 129 (15)/741 (85) | 410 (47) | 12.4 (4.9) | 400.5 |
| Women | 944 (52) | 62.2 (6.7) | 53 (6)/891 (94) | 318 (34) | 13.8 (4.1) | 263.3 |
| KORA | ||||||
| Men | 840 (49) | 61.3 (8.9) | 210 (25)/627 (75) | 90 (11) | 8.4 (1.7) | 119.6 |
| Women | 882 (51) | 60.7 (8.8) | 127 (14)/755 (86) | 56 (6) | 8.7 (1.2) | 89.3 |
| MCCS | ||||||
| Men | 1719 (61) | 69.2 (7.8) | 619 (36)/1100 (64) | 756 (44) | 12.6 (5.9) | 248.9 |
| Women | 1093 (39) | 67.7 (8.7) | 314 (29)/779 (71) | 333 (30) | 13.9 (5.6) | 171.6 |
| MESA | ||||||
| Men | 612 (49) | 69.7 (9.3) | 528 (86)/84 (14) | 79 (13) | 6.4 (1.4) | 95.6 |
| Women | 648 (51) | 69.5 (9.4) | 546 (84)/102 (16) | 58 (9) | 6.5 (1.2) | 65.7 |
| NICOLA | ||||||
| Men | 963 (49) | 65.7 (9.4) | 460 (48)/503 (52) | 65 (7) | 4.9 (0.9) | 99.8 |
| Women | 1017 (51) | 63.5 (9.3) | 555 (55)/462 (45) | 31 (3) | 5.1 (0.7) | 52.0 |
| RS | ||||||
| Men | 622 (44) | 63.6 (8.1) | 418 (67)/205 (33) | 79 (13) | 5.9 (2.2) | 231.5 |
| Women | 798 (56) | 64.0 (8.0) | 314 (39)/484 (61) | 48 (6) | 5.8 (2.0) | 100.9 |
| TILDA | ||||||
| Men | 244 (50) | 61.9 (8.1) | 148 (61)/96 (39) | 24 (10) | 7.2 (2.0) | 145.3 |
| Women | 245 (50) | 62.1 (8.4) | 141 (58)/104 (42) | 11 (5) | 7.2 (1.9) | 68.2 |
Notes: For each cohort study, values for men and women are reported on top and bottom rows, respectively. Mean (standard deviation, SD) age at baseline and length of follow-up are reported in years. Mortality rates per 10 000 person-years are standardized using total person-years by 5-year strata of age at baseline. Characteristics are for participants with complete data on education and mortality.
EPIC-IT = European Investigation into Cancer and Nutrition-Italy; ESTHER = Epidemiological investigations of the chances of preventing, recognizing early and optimally treating chronic diseases in an elderly population; KORA = Cooperative Health Research in the Augsburg Region; MCCS = Melbourne Collaborative Cohort Study; MESA = Multi-Ethnic Study of Atherosclerosis; NICOLA = Northern Ireland Cohort for the Longitudinal Study of Ageing; RS = Rotterdam Study; TILDA = The Irish Longitudinal Study on Ageing.
Educational Inequalities in All-cause Mortality Explained by Epigenetic Aging Biomarkers
Results for educational inequalities are described using 2 different scales: (i) an absolute scale via excess deaths per 10 000 person-years from having low education and (ii) a relative scale via hazard ratios for low versus high education.
Men with a low educational attainment had an excess mortality from all causes of 57 deaths per 10 000 person-years (95% confidence interval [CI]: 38, 76) compared with having high educational attainment (Figure 2). Women with a low educational attainment had an excess mortality from all causes of 4 deaths per 10 000 person-years (95% CI: −11, 19) compared with having high educational attainment. Compared with the mortality rates for women across the populations (see Table 1), this inequality was small. On the relative scale, total effects corresponded to hazard ratios of 1.33 (95% CI: 1.12, 1.57) and 1.15 (95% CI: 0.96, 1.37), for men and women, respectively (Figure 3).
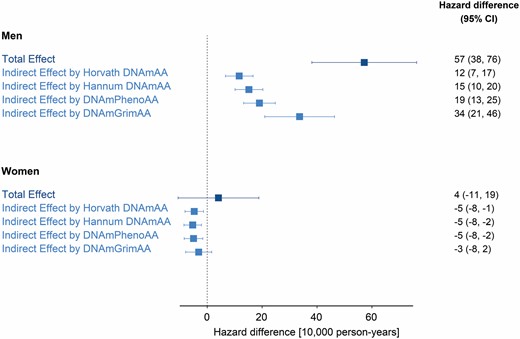
Educational inequalities and mediation by epigenetic aging biomarkers on the absolute scale. Hazard difference per 10 000 person-years and 95% confidence intervals (CI) are for the total effect of low (vs high) educational attainment on all-cause mortality, and for indirect effect by epigenetic aging biomarkers (Horvath DNAmAA, Hannum DNAmAA, DNAmPhenoAA, and DNAmGrimAA). All effects are pooled estimates of a single cohort’s hazard differences (absolute scale) through an inverse variance-weighted meta-analysis model. The total number of participants/deaths across cohorts was 6 477/1 638 for men and 6 544/1 002 for women.
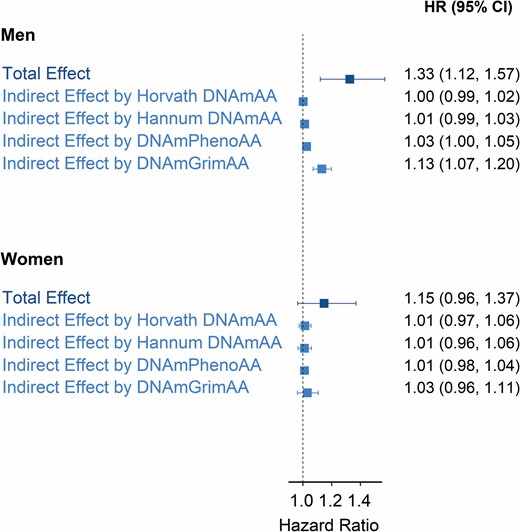
Educational inequalities and mediation by epigenetic aging biomarkers on the relative scale. Hazard ratios (HRs) and 95% confidence intervals (CI) are for the total effect of low (vs high) educational attainment on all-cause mortality, and for indirect effects by epigenetic aging biomarkers (Horvath DNAmAA, Hannum DNAmAA, DNAmPhenoAA, and DNAmGrimAA). All effects are pooled estimates of a single cohort’s HRs (relative scale) through an inverse variance-weighted meta-analysis model. The total number of participants/deaths across cohorts was 6 477/1 638 for men and 6 544/1 002 for women.
For men, the portion of the inequalities (total effect described above) explained by epigenetic aging (indirect effect) was equivalent to 12 excess deaths per 10 000 person-years (95% CI: 7, 17) for Horvath DNAmAA, 15 (95% CI: 10, 20) for Hannum DNAmAA, 19 (95% CI: 13, 25) for DNAmPhenoAA, and 34 (95% CI: 21, 46) for DNAmGrimAA (Figure 2). The latter corresponded to 60% of the educational inequalities in mortality (ratio between indirect and total effect). Hazard ratios for indirect effects were small for all but DNAmGrimAA, which corresponded to 1.13 (95% CI: 1.07, 1.20) (Figure 3). This corresponded to 43% of the educational inequalities in mortality on the relative scale.
For women, the portion of the inequalities explained by epigenetic aging biomarkers corresponded to small negative hazard differences and small positive hazard ratios (Figures 2 and 3).
Heterogeneity across cohort-specific estimates was low across total and indirect effects. Specifically, the τ2 was 0 and the I2 statistics was 0% in most cases (forest plots in Supplementary Material).
Educational Inequalities in All-cause Mortality Explained by Unhealthy Lifestyle, Morbidities, and Epigenetic Aging Biomarkers
For men, the joint indirect effect explained by unhealthy LM and epigenetic aging biomarkers en bloc (considered all at the same time) was equivalent to 25 excess deaths per 10 000 person-years (95% CI: 12, 39) for Horvath DNAmAA, 27 (95% CI: 15, 40) for Hannum DNAmAA, 31 (95% CI: 17, 44) for DNAmPhenoAA, and 35 (95% CI: 20, 50) for DNAmGrimAA (Table 2). On the relative scale, the correspondent hazard ratios were 1.10 (95% CI: 1.04, 1.16) for Horvath DNAmAA, 1.11 (95% CI: 1.05, 1.17) for Hannum DNAmAA, 1.13 (95% CI: 1.07, 1.19) for DNAmPhenoAA, and 1.15 (95% CI: 1.09, 1.21) for DNAmGrimAA (Table 2). Following the model in Figure 1B and the sequential mediation approach described in Methods, the estimated path-specific indirect effect by epigenetic aging but not unhealthy LM was small for all epigenetic aging biomarkers (Table 2), with DNAmGrimAA having the largest path-specific effect of 8.8 excess deaths per 10 000 person-years (95% CI: −4.2, 21.7) and a hazard ratio of 1.04 (95% CI: 0.97, 1.12).
Mediation by Unhealthy Lifestyle, Morbidities, and Epigenetic Aging in Men
| Effects | Hazard Difference (95% CI) | Hazard Ratio (95% CI) |
|---|---|---|
| Total effect | 55 (35, 74) | 1.32 (1.11, 1.56) |
| Indirect effect by LM | 26 (14, 37) | 1.10 (1.05, 1.16) |
| Indirect effect by LM + Horvath DNAmAA | 25 (12, 39) | 1.10 (1.04, 1.16) |
| Indirect effect by Horvath DNAmAA but not LM | −0.8 (−13.6, 11.9) | 1.00 (0.93, 1.07) |
| Indirect effect by LM + Hannum DNAmAA | 27 (15, 40) | 1.11 (1.05, 1.17) |
| Indirect effect by Hannum DNAmAA but not LM | 1.5 (−11.2, 14.3) | 1.01 (0.94, 1.08) |
| Indirect effect by LM + DNAmPhenoAA | 31 (17, 44) | 1.13 (1.07, 1.19) |
| Indirect effect by DNAmPhenoAA but not LM | 4.7 (−8.3, 17.6) | 1.02 (0.95, 1.10) |
| Indirect effect by LM + DNAmGrimAA | 35 (20, 50) | 1.15 (1.09, 1.21) |
| Indirect effect by DNAmGrimAA but not LM | 8.8 (−4.2, 21.7) | 1.04 (0.97, 1.12) |
Absolute (hazard difference per 10 000 person-years) and relative (hazard ratio) size of total effect of low (vs high) educational attainment on all-cause mortality, and for indirect effects by unhealthy lifestyle and morbidities (LM) and epigenetic aging biomarkers (Horvath DNAmAA, Hannum DNAmAA, DNAmPhenoAA, and DNAmGrimAA). All effects are pooled estimates of a single cohort’s effects through an inverse variance-weighted meta-analysis model. The total number of participants/deaths across cohorts was 6 156/1 586.
For women, the proportion of the inequalities explained by unhealthy LM and epigenetic aging biomarkers was small (see Supplementary Table 3), with the largest hazard ratio being 1.06 (95% CI: 0.96, 1.17) for DNAmGrimAA. For this reason, we did not run the sequential mediation analysis on the data for women.
Sensitivity Analyses
Total and indirect effect estimates were similar when including childhood socioeconomic conditions as a potential confounder of education-mortality, education-epigenetic aging, and epigenetic aging–mortality relationships (Supplementary Table 4). When assessing the potential bias due to unmeasured confounding (possibly exposure-induced) of the mediator-outcome association, the indirect effect accounted for by epigenetic aging biomarkers varied by small amounts around the estimates reported in the main analysis (Supplementary Figure 1 for DNAmGrimAA, other biomarkers not shown). This suggested modest bias from unmeasured confounding on the estimated indirect effect by epigenetic aging biomarkers.
By incorporating a nondifferential measurement error of 3 years in epigenetic aging biomarkers, the estimated indirect effects for all epigenetic aging biomarkers were similar to, and for DNAmGrimAA slightly larger than, those reported from main analyses (Supplementary Figures 2 and 3). This suggested no overestimation of indirect effects reported from main analyses due to potential measurement error of epigenetic aging.
When assessing potential age-dependent hazard differences/ratios by repeating the analyses with survival ages right-censored at 70, 75, 80, and 85 years, educational inequalities in mortality for men on the absolute scale widened (Supplementary Figure 4) while they were reduced on the relative scale (Supplementary Figure 5), particularly between ages 70 and 80 years. The indirect effect explained by DNAmGrimAA was substantial at all ages examined. For the other biomarkers, the indirect effect was small up to age 70 years and slightly increased at later ages. The total and indirect effects for women were small at all ages on the absolute scale, while on the relative scale they were small by 75 years and increased afterward (especially for the total effect and the indirect effect by DNAmGrimAA). Overall, this was consistent with the findings from the main analyses that educational inequalities in mortality were larger for men than for women on both scales, that DNAmGrimAA explained a substantial portion of those inequalities for men and a small portion on the relative scale for women.
In the sequential mediation analysis to assess the path-specific effect not mediated by leukocyte composition in the blood (Supplementary Figure 6), for men the indirect effect explained by leukocyte composition in blood was 13 excess deaths per 10 000 person-years (95% CI: 6, 20), increasing to 36 (95% CI: 22, 50) when both leukocyte composition in blood and DNAmGrimAA were the mediators (Supplementary Table 5). The path-specific indirect effect by DNAmGrimAA but not leukocyte composition was quantified as 21 deaths per 10 000 person-years (95% CI: 8, 33). For epigenetic aging based on the other biomarkers, this increment was small. This suggested that the epigenetic aging biomarker DNAmGrimAA captured the differential effect of DNAm levels beyond leukocyte composition in blood.
Discussion
We quantified the contribution of blood DNAm-based epigenetic aging biomarkers in explaining educational inequalities in all-cause mortality using data from 8 population-based cohort studies across 7 high-income countries with a total of 13 021 participants. We found educational inequalities in mortality were larger for men than for women. For men, epigenetic aging as measured by the DNAmGrimAA biomarker explained a substantial portion of educational inequalities in mortality on both the hazard difference and ratio scales. The other biomarkers explained a smaller portion and were potentially confounded by leukocyte composition in blood. Additionally, we found that this mediation by epigenetic aging biomarkers was mostly explained by differential effects of an unhealthy lifestyle (current smoking, high alcohol intake and BMI, and low physical activity) and morbidities (hypertension and diabetes). For women, educational inequalities in mortality were small on the hazard difference scale and mediation by epigenetic aging biomarkers were small on the hazard ratio scale.
This is the first study to examine the mediating role of biomarkers of epigenetic aging in leukocytes underlying educational inequalities in mortality, by integrating social and lifestyle exposures, DNAm profiling from blood, and survival follow-up in men and women from several populations across Europe, the United States, and Australia. The observed substantive educational inequalities in all-cause mortality for men, while smaller for women, were in line with previous reports (4,12). Among the possible explanations for sex differences are that men with less education are more likely to engage in unhealthy lifestyle behaviors than less educated women (39), or that men with less education are more likely to be unemployed than their female counterparts (40). Additionally, in a sensitivity analysis, we found that educational inequalities in mortality widened as a function of age, in line with a previous large European study of 371 295 participants (41).
For men, the portion of educational inequalities in all-cause mortality explained by epigenetic aging was substantial, particularly for the biomarker DNAmGrimAA, on both the absolute and relative scales, and across survival ages from 70 years onwards. Additionally, in sensitivity analysis, we found that only DNAmGrimAA captured changes in DNAm patterns independently of changes in blood cell composition when mediating the effect of education on mortality. Our finding is consistent with a recent MR study reporting evidence of a causal association between higher educational attainment and reduced DNAmGrimAA (32), and with observational studies showing that DNAmGrimAA outperforms other epigenetic aging biomarkers in predicting mortality and age-related clinical phenotypes (23,42). We nevertheless acknowledge that there is limited MR evidence of a causal link between DNAmGrimAA and mortality (32). However, these MR analyses may lack validity as they used weak genetic instruments and were not implemented for men and women separately.
In addition, we found that the potential path-specific contribution of epigenetic aging to the mortality excess rate, independent of unhealthy LM, was small. This result supported the likelihood that the examined epigenetic aging biomarkers captured most of the biological embedding of unfavorable exposures (unhealthy lifestyles and/or morbidities) attendant on lower education, eventually leading to an increased mortality rate. As unhealthy LM are the target of policies promoted by the World Health Organization (WHO) to reduce the burden of premature mortality, our finding strengthens the case for those policies and suggests they could additionally mitigate social inequalities in epigenetic aging, and eventually mortality (12). The small residual path-specific effect associated with epigenetic aging only, especially for biomarker DNAmGrimAA, might be attributed to unmeasured mediators such as those related to employment conditions or psychosocial resources, or to unmeasured unhealthy lifestyle factors such as poor quality diet. However, as lifestyle behaviors are known to cluster (43), our assessment of the joint mediation by four other unhealthy lifestyle factors potentially encompasses mediation by poor diet. Additionally, as DNAmGrimAA was calibrated on smoking pack-years (23) among other phenotypes, the residual path-specific effect could be due to the inability of the smoking intermediate variable examined to capture mediation by smoking intensity. Finally, because the estimate for DNAmGrimAA had limited precision with confidence intervals ranging from −4 to 19 excess deaths per 10 000 person-years and from 0.98 to 1.13 (hazard ratio), future studies with larger sample sizes and more detailed lifestyle-related mediators are required to validate our results.
For women, the portion of educational inequalities in all-cause mortality explained by epigenetic aging biomarkers was small and negative on the absolute scale, and small and positive on the relative scale. These contrasting results could be related to statistical constraints with disaggregating a small hazard difference into direct and indirect portions and the available sample size. On the other hand, as educational inequalities on the hazard ratio scale were not small, the negligible mediation on the relative scale may either suggest that educational inequalities in mortality in women get embedded mostly through alternative biological mechanisms, not involving changes in epigenetic aging based on DNAm in the blood (44), or point to unaccounted potential heterogeneity by age at menopause, which has been shown to affect epigenetic aging biomarkers (45). Alternatively, it may suggest that the epigenetic clock biomarkers should be calibrated separately for men and women to improve the estimation of individual epigenetic age considering sex differences in aging (46).
Our work has limitations. Our findings may not be generalized to non-White populations as most participants were White and may suffer from differential mortality attrition as participants were 64 years old on average. We did not assess the potential moderating effect of the country as we had mostly one cohort per country in our meta-analysis. Future studies running a different statistical multicohort approach or gathering a larger number of cohorts per country are needed to address this (47). The mediators—DNAm, lifestyle, and morbidities—were measured at a single time point, providing only a snapshot of the aging process. Measuring a mediator only once may bias its contribution (48), so there is a need for future research to assess repeated measurements of DNAm in large samples of population-based cohorts. Finally, although education is usually completed years before the occurrence of chronic diseases and morbidities, the lack of longitudinal data from early life does not allow us to exclude reverse causality.
Unmeasured confounding may have biased our estimates. However, we implemented several sensitivity analyses for potentially unmeasured confounding that supported our main findings. Additionally, we implemented a sensitivity analysis to accommodate potential measurement errors affecting epigenetic aging biomarkers, and this analysis supported our main findings.
We modeled educational attainment with 2 levels, potentially limiting our ability to capture the entire education-related social stratification process, which may underestimate the effects on all-cause mortality. We postulated a hypothetical intervention on educational attainment to assess educational inequalities in mortality. However, we did not define how such an intervention could be implemented for policies. Aiming to raise educational attainment by increasing compulsory schooling or subsidizing secondary school may still have imperfect compliance and unpredictable effects on mortality. Therefore, our results cannot be interpreted as causal effect estimates of specific interventions aiming to reduce mortality by increasing educational attainment. Despite this, the effect estimates in the present study were robust and support DNAm-based biomarkers of epigenetic aging in leukocytes as surrogate endpoints to assess social inequalities in life expectancy. We acknowledge that our results provide suggestive empirical evidence but do not provide definitive evidence, as with observational data we could not ascertain whether the differential changes in DNAm captured by the biomarkers had an active or passive role in driving mortality (18). Future experimental and longitudinal studies in both animals and humans are needed to enable more robust causal claims about the role of DNAm in immune cells (49).
A major strength of this study was the use of a counterfactual mediation framework addressing issues that may ensue from traditional linear methods as the difference or product mediation methods. Specifically, IORW provides unbiased estimates when mediators are categorical, when there is an interaction between exposure and mediator(s), or when parameters are noncollapsible as for the Cox survival model. Additionally, IORW offers a sensitivity analysis to assess the impact of potentially unmeasured confounding of the mediator-outcome relationship (34). Lastly, IORW is parsimonious as it does not require the specification of a model for the joint conditional density of mediators when estimating indirect effects by a block of mediators. Notably, we evaluated mediators en bloc to assess the potential path-specific contribution of epigenetic aging independent of unhealthy LM. This joint mediation is advantageous as (i) there is no need for additional modeling assumptions to specify a causal order among mediators, specifically a directionality between and within unhealthy lifestyle factors and/or morbidities; and (ii) is robust to unmeasured potential confounding of mediator–mediator relationships (35).
Additional strengths were the inclusion of multiple populations to make empirical evidence stronger, and the 2-step approach for estimating effects in each cohort first, and then pooling these via a random effect meta-analysis. This approach allowed the effect of potential confounders to be different in each cohort, without the need of parametrizing it (47). Additionally, this approach was useful to consider potential intercohort differences determined by geography, period, or other. Indeed, various community-level characteristics may have affected mortality rates and education levels, and ultimately the effects of interest (50). However, our results presented a negligible degree of heterogeneity, suggesting that country and cohort differences in mortality rate and birth years did not affect our findings. Finally, we estimated the effects of education on all-cause mortality on both absolute and relative scales, thereby providing a complete description of inequalities.
In conclusion, we have provided empirical evidence about the substantial role of blood DNAm-based epigenetic aging biomarkers in explaining educational inequalities in all-cause mortality for men. Whether epigenetic aging acts as a biomarker of longevity or as a causal molecular mechanism of healthy aging remains an open question. Importantly, our results further suggested that differential effects of unhealthy LM determine this epigenetic embedding of unfavorable educational exposures ultimately leading to increased mortality rates. It would be a step too far to suggest that designing policies only around such downstream pathways would be the most effective way to reduce social inequalities in premature mortality and population health when in reality whole systems/whole population life-course approaches will be required (30,31).
Acknowledgments
The LIFEPATH Consortium (in alphabetical order): Harri Alenius, Mauricio Avendano, Henrique Barros, Murielle Bochud, Cristian Carmeli, Luca Carra, Raphaele Castagne, Marc Chadeau-Hyam, Francoise Clavel-Chapelon, Giuseppe Costa, Emilie Courtin, Michaela Dijmarescu, Cyrille Delpierre, Angelo D’Errico, Pierre-Antoine Dugué, Paul Elliott, Silvia Fraga, Valerie Gares, Graham Giles, Marcel Goldberg, Dario Greco, Allison Hodge, Michelle Kelly-Irving, Piia Karisola, Mika Kivimaki, Vittorio Krogh, Thierry Lang, Richard Layte, Benoit Lepage, Frances Macguire, Johan Mackenbach, Michael Marmot, Cathal McCrory, Roger L. Milne, Peter Muennig, Wilma Nusselder, Salvatore Panico, Dusan Petrovic, Silvia Polidoro, Martin Preisig, Olli Raitakari, Ana Isabel Ribeiro, Fulvio Ricceri, Oliver Robinson, Jose Rubio Valverde, Carlotta Sacerdote, Vincenzo Salerno, Roberto Satolli, Gianluca Severi, Terrence Simmons, Silvia Stringhini, Rosario Tumino, Anne-Clare Vergnaud, Paolo Vineis, Peter Vollenweider, and Marie Zins. Extended acknowledgments for each cohort are reported in Supplementary Material.
Funding
This work was supported by the European Commission [Grant Horizon 2020 number 633666]. G.F. is supported by Programma Operativo Nazionale (PON), Ricerca e Innovazione 2014-2020, Attrazione e Mobilità Internazionale (AIM) code AIM1874325-2. M.G.S. is supported by ‘Fondo di Ateneo per la ricerca 2019’, University of Sassari, Italy.
Conflict of Interest
None declared.
Author Contributions
P.V. conceived the project and with C.C. designed the study. C.M.C., Y.Z., P-A.D., S.R., W.N.Z., G.J.M., R.T., S.G., F.R., S.Po., H.B., M.W., P.R.M-G., A.P., G.G.G., Y.L., F.K., I.S.Y., B.M., A.J.M., J.vM., T.V., and R.A.K. contributed reagents, materials, or analysis tools. C.C., G.F., S.Pe., and C.O.-R. ran the data analysis. C.C. was chiefly responsible for the conduct and accuracy of the work. C.C. and G.F. drafted the manuscript and all authors contributed to critically reviewing and revising the draft. All authors read and approved the final manuscript before submission.
References
Author notes
Equal contribution as first authors
Equal contribution as senior authors.

