


Abstract
Adverse drug events (ADEs) are common in clinical practice and can cause significant harm to patients and increase resource use. Natural language processing (NLP) has been applied to automate ADE detection, but NLP systems become less adaptable when drug entities are missing or multiple medications are specified in clinical narratives. Additionally, no Chinese-language NLP system has been developed for ADE detection due to the complexity of Chinese semantics, despite ˃10 million cases of drug-related adverse events occurring annually in China. To address these challenges, we propose DKADE, a deep learning and knowledge graph-based framework for identifying ADEs. DKADE infers missing drug entities and evaluates their correlations with ADEs by combining medication orders and existing drug knowledge. Moreover, DKADE can automatically screen for new adverse drug reactions. Experimental results show that DKADE achieves an overall F1-score value of 91.13%. Furthermore, the adaptability of DKADE is validated using real-world external clinical data. In summary, DKADE is a powerful tool for studying drug safety and automating adverse event monitoring.
INTRODUCTION
Adverse drug events (ADEs) are defined as injuries caused by drug-related medical interventions, which may lead to prolonged hospital stays and increased medical costs [1–4]. They currently rank as the fourth major cause of death in the United States, leading to ⁓135 000 fatalities every year and imposing an economic burden that exceeds 136 billion US dollars [5–7]. ADEs are mostly preventable, and the knowledge gained from previous ADEs is of high value [8]. However, since ˂10% of ADEs are reported to drug regulatory agencies, many hidden ADEs remain to be identified, reported and investigated [9–12]. Electronic health records (EHRs) contain considerable ADE-related information, but it is often difficult and time-consuming to manually review and collect information from unstructured narrative text data [13–15]. With the advancement of artificial intelligence technology, the automatic detection of ADEs through processing clinical narratives using natural language processing (NLP) systems has significant practical implications [16–21].
Compared to English NLP research, Chinese NLP research began rather late and there is a lack of open resources for training [22]. The identification of ADEs from Chinese EHRs is a challenging task due to the intricate nature of text segmentation. Prior research has primarily concentrated on entity recognition in adverse event reports, leaving rare studies on the identification of ADEs from complex EHR texts [23, 24]. However, in 2022 alone, a staggering 2.02 million reports of ADEs were received in China. This is in line with the significant upward trend of reported ADEs in the country over the past decade (Supplementary Figure S1). Given this, exploring an NLP system for Chinese EHRs is urgently needed.
Recent studies have made significant progress in developing NLP methods to extract ADEs from EHRs. Currently, research in the field of ADE detection using NLP has shifted from simple entity recognition to end-to-end studies that encompass both entity recognition and relation classification (RC). Compared to traditional machine learning, deep learning has shown promising results and prospects. For instance, Yang et al. developed MADEx, a system for clinical Name Entity Recognition (NER) and relation extraction using deep learning methods such as Long Short-Term Memory (LSTM) and Support Vector Machines. MADEx achieved F1-score of 0.82 for clinical NER [25]. Wei et al. utilized a clinical corpus from the MIMIC-III database and developed a system with two components: a NER and a RC component. Their deep learning-based approach achieved an F1 score of 89.05% for end-to-end evaluation [26]. The studies above suggest that the current clinical NLP technique framework can accurately and automatically extract information and identify drug-adverse event relationships when ADEs and drug-related information are fully described in clinical notes. However, drug entities are frequently absent from descriptions of ADE-related clinical notes. For example, relationships between medications and adverse reaction entities cannot be built by current NLP systems when ‘the patient’s dizziness was considered to be induced by drugs’. In addition, current NLP systems cannot distinguish whether relationships between identified ADEs and drugs are known or not. In postmarketing drug surveillance, new ADEs are of major concern. Due to the above deficiencies, the value of current NLP systems in drug administration and ADE research is limited.
A knowledge graph is a structure that describes the relationships between knowledge and model entities using a graph model, which consists of nodes and edges and is represented as a triple [27]. Medical knowledge graphs currently have various applications such as semantic search, knowledge question-answering and clinical decision support [28–31]. In the context of identifying ADEs in EHR texts, knowledge graphs can be utilized to infer and complement related medicines in ADEs with and to determine whether the identified ADEs are known or not. This highlights the potential of incorporating knowledge graphs in ADE identification for pharmacovigilance and drug safety surveillance.
In this study, a novel framework named Deep Learning and Knowledge Graph for Adverse Drug Event Identification (DKADE) is proposed, which combines deep learning and knowledge graph techniques to identify ADEs and related medications from Chinese EHRs. Large amounts of Chinese corpus were manually annotated for model training. The input information for DKADE consists of clinical course notes, medication orders and a drug knowledge graph. The DKADE framework outputs identified ADEs and their corresponding relationships.
The main contributions of the method/framework proposed in this study are described as follows.
(i) A novel framework is presented for identifying ADEs and related medications from Chinese clinical notes.
(ii) The relationships between drugs and ADEs are effectively complemented by a knowledge graph combined with doctors’ orders.
(iii) The known and unknown relationships between the drugs and ADEs are distinguished by effective inference using the knowledge graph.
(iv) The framework has good scalability and universality, and the method in the current framework has good identification performance, thereby suggesting the effectiveness of the framework.
MATERIALS AND METHODS
Data source and annotation
The experimental data used in this study were collected from real-world clinical data from two tertiary medical institutions in Hunan Province; the data included mainly clinical course notes and clinical medication orders. Each clinical course note contained mainly information on a clinician’s ward round records and described whether the patient had or was suspected of having ADEs and related medications; e.g. a clinical note may have stated that ‘the patient’s diarrhea was considered to be caused by the side effects of chemotherapy drugs’. In this study, 3527 clinical course notes were collected from tertiary medical institution A for the purpose of annotating, analyzing and validating the proposed DKADE framework. Our dataset contained the records of 2000 patients from 2009 to 2019 who reported ADEs to the Adverse Drug Reaction (ADR) monitoring center of Hunan Province to ensure that a sufficient positive sample was obtained. To further verify the adaptability of DKADE, 1000 clinical course notes were also collected from another tertiary medical institution, B.
By analyzing the descriptive paradigm of ADEs in the course notes, 21 regular expressions were formulated to extract 5014 description records of suspected ADEs and related medications from all clinical notes, and some regular expressions are listed in Table 1. Then, we annotated (as ‘YES’ or ‘NO’) according to whether an ADE was described. Various annotated examples are shown in Table 2. These records included 3127 manually annotated ADEs and 1887 non-ADEs. Second, a total of 65 637 named entities of drugs and their attributes, ADEs, indications and other signs and symptoms in the course notes were annotated. Then, all the annotated entity information was aligned to standardized terms. Finally, 5629 relationships between drugs and ADEs were annotated. A team of 10 trained research assistants annotated these data. Each clinical note was independently annotated by two annotators (i.e. double annotation). Differences were resolved by a third and senior annotator. The annotation work was conducted using the novel platform for text annotation and service [32].
An expression library for extracting descriptions of suspected ADEs
 |
|
An expression library for extracting descriptions of suspected ADEs
|
|
Examples of annotated corpora for identifying ADEs
 |
|
Examples of annotated corpora for identifying ADEs
|
|
Construction of the drug knowledge graph
As the core input element of DKADE, the drug knowledge graph is mainly used to infer and complement the missing drugs in ADE-related descriptions and to distinguish whether the identified relationships between drugs and ADEs are known. In this study, a drug knowledge graph library was constructed using ontology technology, with an emphasis on the semantic relationships between drugs and other adverse reaction entities. The overall construction process is shown in Figure 1.
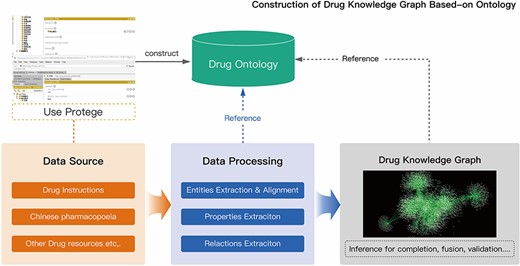
Construction process of the drug knowledge graph.
As Figure 1 shows, the drug knowledge graph was constructed from the drug instructions and pharmacopeia. In this study, an ontology model of the drug knowledge graph was established using Protégé combined with data sources. In the ontology model, six main classes of concepts (DRUG, SYMPTOM, SIGN, DISEASE, LABRESULT and EXAMRESULT) and two main semantic relationships (subClassOf and ADE) were defined. The data were extracted from various data sources by using entity extraction, relationship extraction, and attribute extraction and semiautomatically constructed into the data layer of the drug knowledge graph. Following the construction, the drug knowledge was further fused and verified using the inference technique. The knowledge graph of ADEs is represented as a triple, namely, <S, P, O>. For example, in the ADE knowledge entries, S, P and O represent the drug entities, the adverse reaction relations and the adverse reaction entities (SYMPTOM, SIGN, DISEASE, LABRESULT and EXAMRESULT), respectively. Detailed sample information is available on GitHub (https://github.com/wuxuehong214/DKADE/wiki).
DKADE framework
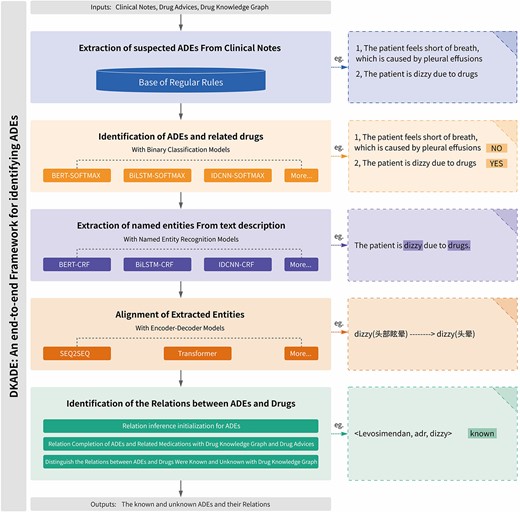
To achieve end-to-end mission objectives, DKADE is comprised of five modules, as depicted in Figure 2. Firstly, suspected ADE descriptions were detected using an extensible regular expression. Secondly, we applied a binary classification model to determine whether these indeed described ADEs. This module integrated multiple deep learning-based binary classification algorithms, such as Bidirectional Encoder Representations from Transformers with SOFTMAX (BERT-SOFTMAX), Bidirectional Long Short-term Memory with SOFTMAX (BiLSTM-SOFTMAX) and Iterated Dilated Convolutional Neural Network with SOFTMAX (IDCNN-SOFTMAX). Thirdly, the drug and adverse reaction information entities (DRUG, SYMPTOM, SIGN, DISEASE, LABRESULT and EXAMRESULT) were extracted from the descriptions of ADEs by using sequence-based NER. Multiple NER algorithms, such as Bidirectional Encoder Representations from Transformers with Conditional Random Fields (BERT-CRF), Bidirectional Long Short-term Memory with Conditional Random Fields (BiLSTM-CRF) and Iterated Dilated Convolutional Neural Network with Conditional Random Fields (IDCNN-CRF), were integrated into this module. Fourthly, considering the colloquial and abbreviated descriptions of entity information in clinical medical records, two codec-based deep learning algorithms, namely, sequence to sequence (SEQ2SEQ) and the Transformer, were integrated into DKADE so that the entity information could be further aligned to standard terms and be consistent with the entity information in the drug knowledge graph. Finally, DKADE, combined with the extracted entity information, was used to infer and complement the relationships of ADEs, and whether the ADEs were known or not was further determined as the final output. The drug knowledge graph is mainly used in this module. Our deep learning models for classification, entity recognition and entity alignment were developed using Python programming language and implemented using the TensorFlow framework. A detailed description of DKADE is presented in the following sections.
Framework for identifying ADEs and related medications.
Extraction of suspected ADEs
By analyzing many clinical course notes, rules can be found in the descriptive grammar of ADEs and related medications. Therefore, an extensible regular expression library was built in this study and used to extract the descriptions of suspected ADEs and related medications from the course notes. Some regular expressions are listed in Table 1.
The regular expression library was constructed to quickly locate suspected ADEs. Since the regular expression library used in this study was extensible, the corresponding expressions could be quickly defined and supplemented with the descriptive grammar of clinical data, thereby covering almost all descriptions of ADEs and related medications. Of course, various problems were still encountered. For example, the descriptions of suspected ADEs identified by different expressions overlapped. In this study, the overlapping description sequences were preferentially merged using a union operation. Many statements satisfying regular expressions could be extracted from the course notes, but not all of them were description facts concerning ADEs. For example, the statement ‘the patient’s shortness of breath was considered to be caused by pleural effusion’ satisfied the regular expression in Table 1, but it did not refer to an ADE. Therefore, the suspected ADEs extracted were distinguished and identified in the next step.
Identification of ADEs
Whether a given descriptive statement describes an ADE can be effectively determined through annotation combined with a deep learning algorithm for binary classification (‘Yes’ and ‘No’). DKADE offers multiple deep learning algorithms for binary classification: BiLSTM-SOFTMAX, BERT-SOFTMAX and IDCNN-SOFTMAX, which can be selected for training and identification [33–35]. Regarding the binary classification models, all the algorithms were trained for 500 epochs with a learning rate of 0.01. The batch size for BiLSTM-SOFTMAX was 64, and the maximum sequence length (max_length) was 512. For IDCNN-SOFTMAX, the batch size was 128 and the max_length was 512. For BERT-SOFTMAX, the batch size was 32 and the max_length was 256. A detailed sample of annotated corpora for binary classification is provided on GitHub (https://github.com/wuxuehong214/DKADE/wiki).
As the examples of annotated corpora in Table 2 demonstrate, the descriptions of suspected ADEs extracted using regular expressions included non-ADEs, which were identified and annotated by the binary classification algorithm model. ADEs annotated as ‘No’ were discarded, while those annotated as ‘Yes’ were further analyzed in DKADE.
Recognition of named entities
After the ADEs were identified, information on drug and ADE entities was further extracted to construct the ADE relations. In this study, six classes of entity information were extracted (SYMPTOM, SIGN, LABRESULT, EXAMRESULT, DISEASE and DRUG). The entity information in the ADE descriptions was annotated by using begin-inside-outside-end sequence labeling, followed by training and identification by deep learning algorithms for NER. DKADE offers several deep learning NER algorithms, including BERT-CRF, IDCNN-CRF and BiLSTM-CRF [36–38]. For the named entity recognition models, all the algorithms were trained for 100 epochs with a learning rate of 0.01. The batch size for BiLSTM-CRF was 32, and the max_length was 512. For IDCNN-CRF, the batch size was 64, and the max_length was 512. For BERT-CRF, the batch size was 16, and the max_length was 256. A detailed sample of annotated corpora for NER training is shown on GitHub (https://github.com/wuxuehong214/DKADE/wiki).
Alignment of recognized entities
Entities extracted from original clinical course notes often have colloquial, incorrectly written ( ), simplified or abbreviated names. Such nonstandardized entity information fails to effectively support the later inference and extraction of ADEs. Therefore, DKADE utilizes an entity alignment process so that the extracted entity information can be aligned to standardized terms. In DKADE, a codec-based deep learning algorithm model is used for the entity alignment task; this model provides two algorithms (Transformer and SEQ2SEQ) [39, 40]. In the entity alignment models, all the algorithms were trained for 1000 epochs with a learning rate of 0.1. The batch size for SEQ2SEQ was 64, and max_length was 300. For Transformer, the batch size was 16, and max_length was 300. A detailed sample of annotated corpora for entity alignment training is presented on GitHub (https://github.com/wuxuehong214/DKADE/wiki).
Identification of relationships between ADEs and medicines
After the information on drugs and adverse reaction entities is extracted from the given description of an ADE, an ‘adverse reaction’ relationship is built by default by DKADE between the drug entity in ADEs and the adverse reaction entity to initially infer the ADE relations. However, in actual clinical course notes, clinicians often describe ADEs in the following ways: (i) The drug entity is often missing from the related descriptions of ADEs. For example, ‘the patient’s dizziness was considered to be caused by the drug’. In other words, only the adverse reaction entity ‘dizziness’ can be found in the related description of the ADE process, whereas the drug entity is missing; hence, the relationship between the drug and adverse reaction entities fails to be built. By incorporating the drug knowledge graph, the drug causing the ADE is inferred by comparing the degree of agreement between the common ADE of each drug in the prescribed prescription and the described ADE. If there is no adverse reaction relationship between the drug entity and the specified adverse reaction entity in the medication order, by default, DKADE builds adverse reaction relationships between all drugs in the medication order and the specified adverse reaction entity as potential adverse reaction relations. (ii) When describing the process of ADEs, clinicians often abstractly describe drug entities, that is, the drugs are not specified. For example, ‘the patient’s thrombocytopenia was considered to be myelosuppression caused by chemotherapy drugs’, in which ‘chemotherapy drugs’ are a class of abstract drug entities, rather than specified chemotherapy drugs. However, by incorporating the parent–child semantic relationship (subClassOf) of drugs into the drug knowledge graph, DKADE analyzes the drugs belonging to ‘chemotherapy drugs’ from the medication order and builds adverse reaction relationships between the identified drugs and the adverse reaction entities.
After the relationships between ADEs and drugs are inferred and complemented, DKADE further distinguishes whether these ADE relationships are known by incorporating the ADE knowledge into the drug knowledge graph. The relationships between ADEs and drugs are regarded as known if they can be matched in the drug knowledge graph; otherwise, the relationships between ADEs and medications are unknown, and the ADEs are regarded as potential new ADRs to the medications.
Experiment and evaluation methods
To analyze and verify the effectiveness of DKADE, the algorithms in each flow were first compared and analyzed. In the binary classification subtask, the BiLSTM-SOFTMAX, IDCNN-SOFTMAX and BERT-SOFTMAX methods were compared. In the entity recognition subtasks, the BiLSTM-CRF, IDCNN-CRF and BERT-CRF methods were compared. In the entity alignment subtask, the Transformer and SEQ2SEQ methods were compared. Then, we combined the algorithms for each subtask in tandem to analyze and verify the overall end-to-end recognition performance. In the core processing flow of DKADE, there are three serial deep learning algorithm models; therefore, 18 model combinations were obtained. With ensemble learning, we constructed a 19th model, V-V-V. Specifically, the final output result for the binary classification subtask was obtained by combining the output results of BiLSTM-SOFTMAX, IDCNN-SOFTMAX and BERT-SOFTMAX methods through majority voting. For the entity recognition subtasks, the output results of BiLSTM-CRF, IDCNN-CRF and BERT-CRF methods were combined using majority voting. In the entity alignment subtasks, the final entity alignment result was obtained using the results of either the Transformer or SEQ2SEQ algorithm if only one of the two algorithms could be associated with the reference knowledge graph. If both algorithms could be associated with the reference knowledge graph but their results were inconsistent, then the results from both algorithms were used. To verify and analyze the effectiveness and value of the drug knowledge graph in DKADE, we removed the drug knowledge graph-related analysis process from DKADE to obtain the V-V-V′ model and compared it with the V-V-V model. Additionally, the analytical model was applied to institution B to analyze the adaptability of DKADE after model migration among different medical institutions.
In this study, the experimental results were analyzed and evaluated using precision, recall and the overall F1 score. The annotated dataset was divided into a training set and a test set with a ratio of 8:2. With the test set as the reference standard, the model was trained on the dataset, and its performance was analyzed through multiple cross-validations.
RESULTS AND DISCUSSION
Constructed drug knowledge graph
In this study, the drug knowledge graph database was constructed by manually and automatically extracting data from drug instruction reports, pharmacopeia textbooks and other drug-related resources. Specifically, the model layer of the knowledge graph included six main classes of core concepts and two main semantic relations. In the data layer of the knowledge graph, the number of knowledge triples was 528 507 and the number of entities was 19 416.
As Figure 3 shows, 4082 drug entities were constructed, and the subClassOf relationship was built between drug entities to identify the parent–child relationship between drug entities. To describe the findings related to ADEs, we established an ADE relationship between drug entities and other entities associated with adverse reactions. Specifically, we identified 2372 symptom entities, 3814 sign entities, 2720 lab result entities, 3381 exam result entities and 3047 disease entities.
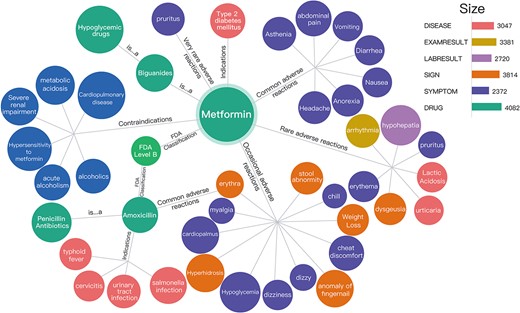
Visual preview of the drug knowledge graph. The subClassOf relationship was built between the drug entity metformin and hypoglycemic drugs, that is, metformin is a hypoglycemic drug. In addition, the common adverse reactions of metformin might include asthenia, abdominal pain, vomiting and diarrhea.
As shown in Figure 3, the subClassOf relationship was built between the drug entity metformin and hypoglycemic drugs, that is, metformin is a hypoglycemic drug. In addition, the common adverse reactions of metformin might include asthenia, abdominal pain, vomiting and diarrhea.
ADE and related medication identification results obtained by DKADE
The corpora of descriptions of ADEs and non-ADEs extracted from the regular expression library were trained and verified using three binary classification algorithms provided by DKADE: BiLSTM-SOFTMAX, IDCNN-SOFTMAX and BERT-SOFTMAX. The results of the comparative analysis are shown in Table 3. The F1 score of the BERT-SOFTMAX model was 96.56% for identification from descriptions of suspected ADEs; this value was slightly higher than those obtained by the other two models, suggesting better overall identification performance. Thus, the BERT-SOFTMAX model can effectively distinguish whether a given description describes an ADE.
Comparison of binary classification models
| Model | Performance | ||
|---|---|---|---|
| Precision (%) | Recall (%) | F1 score (%) | |
| BiLSTM-SOFTMAX | 91.55 ± 0.32 | 96.29 ± 0.21 | 93.86 ± 0.34 |
| IDCNN-SOFTMAX | 92.54 ± 0.28 | 95.65 ± 0.17 | 94.07 ± 0.26 |
| BERT-SOFTMAX | 95.87 ± 0.21 | 97.25 ± 0.13 | 96.56 ± 0.18 |
| Model | Performance | ||
|---|---|---|---|
| Precision (%) | Recall (%) | F1 score (%) | |
| BiLSTM-SOFTMAX | 91.55 ± 0.32 | 96.29 ± 0.21 | 93.86 ± 0.34 |
| IDCNN-SOFTMAX | 92.54 ± 0.28 | 95.65 ± 0.17 | 94.07 ± 0.26 |
| BERT-SOFTMAX | 95.87 ± 0.21 | 97.25 ± 0.13 | 96.56 ± 0.18 |
Extracting accurate information on drug and adverse reaction entities from clinical texts describing the processes of ADEs is crucial for extracting ADE relations. In this study, model training and comparison were also performed for the three NER algorithms provided by DKADE, namely, BiLSTM-CRF, IDCNN-CRF and BERT-CRF. As shown in Table 4, BERT-CRF exhibited better entity recognition performance in the current scenario, with an overall F1 score of 94.61%, which was higher than those of IDCNN-CRF and BiLSTM-CRF.
Comparison of NER models
| Model | Performance | ||
|---|---|---|---|
| Precision (%) | Recall (%) | F1 score (%) | |
| BiLSTM-CRF | 92.10 ± 0.25 | 88.55 ± 0.33 | 90.92 ± 0.34 |
| IDCNN-CRF | 92.65 ± 0.14 | 91.89 ± 0.29 | 92.27 ± 0.19 |
| BERT-CRF | 93.73 ± 0.21 | 95.51 ± 0.23 | 94.61 ± 0.27 |
| Model | Performance | ||
|---|---|---|---|
| Precision (%) | Recall (%) | F1 score (%) | |
| BiLSTM-CRF | 92.10 ± 0.25 | 88.55 ± 0.33 | 90.92 ± 0.34 |
| IDCNN-CRF | 92.65 ± 0.14 | 91.89 ± 0.29 | 92.27 ± 0.19 |
| BERT-CRF | 93.73 ± 0.21 | 95.51 ± 0.23 | 94.61 ± 0.27 |
Since the entities identified from the clinical course notes had colloquial, simplified or abbreviated names, the SEQ2SEQ and Transformer algorithms provided by DKADE were used for standardized entity alignment; that is, the entities were converted into standardized terms. Table 5 shows that the overall F1 score of the Transformer based on the attention mechanism reached 92.43% in the entity alignment task. The Transformer outperformed SEQ2SEQ.
Comparison of entity alignment models
| Model | Performance | ||
|---|---|---|---|
| Precision (%) | Recall (%) | F1 score (%) | |
| SEQ2SEQ | 89.80 ± 0.31 | 89.80 ± 0.31 | 89.80 ± 0.31 |
| Transformer | 92.43 ± 0.25 | 92.43 ± 0.25 | 92.43 ± 0.25 |
| Model | Performance | ||
|---|---|---|---|
| Precision (%) | Recall (%) | F1 score (%) | |
| SEQ2SEQ | 89.80 ± 0.31 | 89.80 ± 0.31 | 89.80 ± 0.31 |
| Transformer | 92.43 ± 0.25 | 92.43 ± 0.25 | 92.43 ± 0.25 |
The overall objective of DKADE is to identify ADEs and their relationships from given course notes, that is, to complete an end-to-end task. To analyze the end-to-end identification performance, the optimal model in each process is considered by default, and a whole-process pipeline is constructed. The results are shown in Table 6, in which, for example, Bi-BE-S indicates the use of BiLSTM-SOFTMAX as the binary classification model, BERT-CRF as the entity recognition model, and SEQ2SEQ as the entity alignment model in DKADE. V-V-V indicates that the voting mechanism was enabled in each algorithm flow. The experimental results demonstrated that the overall F1 score of the V-V-V model reached 91.13%, which was higher than the F1 scores obtained by other models. However, the precision of the V-V-V model was not the highest, possibly because more recognition results were obtained by the model due to the voting mechanism. Moreover, with more recognition results obtained, the recall of the model was also better than those of other models.
Comparison of end-to-end identification effect
| Modela | Performance | ||
|---|---|---|---|
| Precision (%) | Recall (%) | F1 score (%) | |
| Bi-Bi-S | 91.15 ± 0.21 | 79.04 ± 0.43 | 85.92 ± 0.18 |
| Bi-I-S | 91.29 ± 0.29 | 78.36 ± 0.32 | 86.19 ± 0.34 |
| Bi-BE-S | 91.69 ± 0.24 | 79.75 ± 0.29 | 86.18 ± 0.42 |
| Bi-Bi-T | 91.81 ± 0.16 | 80.26 ± 0.51 | 85.65 ± 0.31 |
| Bi-I-T | 92.91 ± 0.33 | 83.07 ± 0.38 | 87.71 ± 0.28 |
| Bi-BE-T | 92.31 ± 0.22 | 81.68 ± 0.30 | 86.67 ± 0.32 |
| I-Bi-S | 91.23 ± 0.32 | 78.86 ± 0.33 | 85.11 ± 0.29 |
| I-I-S | 91.40 ± 0.19 | 84.70 ± 0.42 | 89.52 ± 0.51 |
| I-BE-S | 89.64 ± 0.28 | 75.82 ± 0.22 | 82.16 ± 0.27 |
| I-Bi-T | 92.28 ± 0.30 | 81.49 ± 0.21 | 87.86 ± 0.25 |
| I-I-T | 91.87 ± 0.26 | 83.09 ± 0.37 | 87.26 ± 0.17 |
| I-BE-T | 92.28 ± 0.41 | 86.91 ± 0.33 | 90.26 ± 0.26 |
| BE-Bi-S | 91.19 ± 0.22 | 81.22 ± 0.11 | 86.83 ± 0.15 |
| BE-I-S | 92.28 ± 0.18 | 81.54 ± 0.51 | 86.58 ± 0.26 |
| BE-BE-S | 92.02 ± 0.36 | 85.84 ± 0.62 | 89.75 ± 0.41 |
| BE-Bi-T | 92.41 ± 0.31 | 79.16 ± 0.37 | 85.27 ± 0.33 |
| BE-I-T | 92.13 ± 0.28 | 83.21 ± 0.28 | 87.87 ± 0.19 |
| BE-BE-T | 93.76 ± 0.27 | 85.50 ± 0.18 | 89.44 ± 0.22 |
| V-V-Vb | 93.14 ± 0.18 | 89.20 ± 0.40 | 91.13 ± 0.21 |
aBi, BE, I, T and S represented BiLSTM, BERT, the IDCNN, the Transformer and SEQ2SEQ, respectively.
bThe first V indicates voting for the binary classification model (that is, the recognition results that are the same between two of the three models shall prevail); the second V indicates voting for the entity recognition model (that is, the intersection of the entity recognition results of the three models is taken and deduplicated); the third V indicates voting for the entity alignment model (that is, the intersection of the alignment results of the two models is taken and deduplicated).
Contribution of the drug knowledge graph
A major contribution of DKADE is that it integrates a drug knowledge graph, which, based on the descriptive features of Chinese clinical course notes, can effectively help infer and complement ADE relationships and distinguish whether the ADEs are known or not. To verify and analyze the effectiveness and value of the drug knowledge graph in DKADE, the drug knowledge graph-related analysis process was removed from DKADE, and the V-V-V′ model was obtained.
As presented in Table 7, the F1 score of the model reduced to 86.08% upon removal of the drug knowledge graph for inference analysis. Additionally, we performed an analysis of the AUC and ROC for the V-V-V model and V-V-V′ model, which revealed an AUC of 0.9114 for the V-V-V model and 0.8626 for the V-V-V′ model (Supplementary Figure S2). DKADE identified more ADEs in the end-to-end task after the drug knowledge graph was introduced. One possible reason is that the drug entities in the ADE relationships are complemented based on the drug knowledge graph. Another reason is that abstract drug entities can be identified and combined with the parent–child relationships of drug entities in the drug knowledge graph. The identification precision of the V-V-V′ model was 94.46%, mainly because DKADE can effectively extract ADEs from clinical course notes, but since the drug knowledge graph was not introduced into the V-V-V′ model to complement the ADE relations, the known ADEs failed to be effectively identified, thereby reducing the overall recall to 79.07%. After the drug knowledge graph was introduced into the V-V-V model, the model incorrectly identified some ADEs and their relationships while showing improved recognition ability, thereby reducing the precision to 93.13%. In summary, the model more effectively identified the ADE relationships after the drug knowledge graph was introduced for inference analysis.
Comparison of identification of ADEs with or without knowledge graph
| Model | Known ADEs | Identified ADEs | Performance | ||
|---|---|---|---|---|---|
| Precision (%) | Recall (%) | F1 score (%) | |||
| V-V-V | 5629 | 5283 | 93.13 | 89.20 | 91.13 |
| V-V-V′ | 5629 | 4642 | 94.46 | 79.07 | 86.08 |
| Model | Known ADEs | Identified ADEs | Performance | ||
|---|---|---|---|---|---|
| Precision (%) | Recall (%) | F1 score (%) | |||
| V-V-V | 5629 | 5283 | 93.13 | 89.20 | 91.13 |
| V-V-V′ | 5629 | 4642 | 94.46 | 79.07 | 86.08 |
Adaptability analysis of DKADE
To further verify the adaptability of DKADE, 1000 clinical course notes containing ADEs were obtained from another tertiary medical institution, B, from which 1631 ADE relationships were annotated. As a standard reference set, these ADE relationships were identified and analyzed using the above V-V-V model. The final results demonstrated that the overall F1 score was 86.25% and the precision and recall were 89.89% and 82.89%, respectively. The results demonstrated that the overall evaluation performance was reduced and that the overall F1 score declined by 5.66%. The main reasons were as follows:
(i) Insufficient coverage of the regular expression library: For example, in the statement ‘considering a long-term history of taking anti-tuberculosis drugs before the onset, the abnormal liver function is more likely to be caused by drugs’, the description of the ADE could not be extracted using the existing 21 regular expressions; hence, the ADE could not be identified.
(ii) Differences in descriptions of drug and ADE entities: The entity recognition and alignment effects were reduced mainly because there were differences in the descriptions of entities between medical institutions A and B; hence, the model trained on data from medical institution A exhibited poor identification performance when applied to data from medical institution B. For example, the data from medical institution A contained the description ‘the patient’s hyponatremia and hypochloremia were considered to be caused by diuretics’, while a similar description in the data from medical institution B was ‘the low levels of sodium and chloride in the patient were caused by diuretics’; similarly, it was described that ‘the patient’s leukopenia, erythropenia and thrombocytopenia were considered to be myelosuppression caused by chemotherapy drugs’ in medical institution A and that ‘the low levels of white blood cells, red blood cells and platelets are considered myelosuppression caused by chemotherapy drugs’ in medical institution B. Due to great differences in the descriptions of the same entities, the degree of fitting of the model trained in medical institution A was insufficient.
Because of the above problems, corresponding optimization measures were taken: regular expressions were added to increase coverage, and the entity corpora were complemented; the former could take effect immediately, while the latter required an iterative training model. To verify and improve the degree of fitting of DKADE to the data of medical institution B, the scale of the corresponding entity corpora was increased gradually in the clinical course notes to explore the association between the corpus scale and the fitting performance of DKADE. The overall analysis results are shown in Figure 4. With the annotated data in the course notes of medical institution B added to the model training data, the model quickly converged and fit the semantic features of the medical institution, and the F1 score, precision and recall of the model all quickly stabilized. The F1 score of the model was greatly improved after 50 new corpora in the course notes were added and stabilized to 92.96% after 150 new corpora were added. The results demonstrate that the degree of fitting and adaptability of DKADE could be quickly stabilized by adding new corpora.
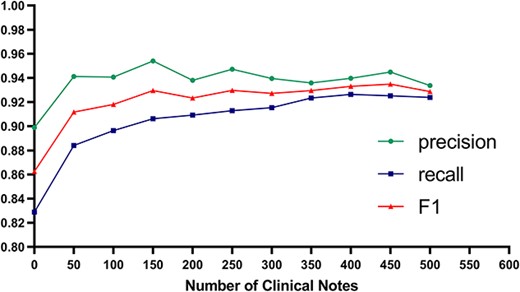
Performance trend of the model after corpus enhancement.
To evaluate the consistency of the predicted outcomes with real-world clinical data, we imposed an additional challenge on DKADE. For this purpose, we retrospectively monitored inpatients at Hospital B using DKADE during a 1-month period in 2021. The analysis revealed that DKADE identified 102 suspected ADEs from the medical records of 5086 patients. The clinical records of these 102 patients were then evaluated by two clinical pharmacists from the hospital, with any inconsistencies determined by a third pharmacist. The evaluation results indicate that 98 of the 102 patients were semantically recognized with precision, suggesting that potential ADEs may have occurred. This implies that the model’s predictive performance achieved a high precision of 96.1%. We also investigated the number of ADEs reported by the hospital during the same period, and found that only 11 cases were reported, indicating a significant underreporting of ADEs. This highlights the potential utility of our DKADE framework for identifying ADEs that may otherwise be missed, and we believe that our proposed framework can significantly improve the level of ADE monitoring and reporting in clinical practice.
Value of DKADE for mining new ADEs
By incorporating ADE knowledge into the drug knowledge graph, DKADE could distinguish whether the relationships between identified ADEs and medications were known or not. The identified new relationships between ADEs and medications were highly valuable. The results can be used to discover novel ADE signals, although they might include some misidentifications or noise data. When the scale of the identified new ADEs reached a certain level, the potential information on the ADEs could be further discovered and identified by statistics and correlation analysis combined with big data technology. According to China’s drug surveillance policy, ADEs that are not listed in the drug package insert are considered new ADEs. However, establishing a causal relationship between a drug and suspected ADEs can be challenging and time-consuming. According to the ‘report any suspicion’ principle in ADE monitoring, which requires that suspected ADEs be reported even when it is not possible to establish a definitive causal relationship between the harmful reaction and the drug. In this context, the DKADE framework can efficiently increase the reporting rate of new ADEs.
Comparison with other methods
Many studies have attempted to extract medication, ADEs and their interrelations through NLP. Moreover, the clinical NLP community has initiated a series of challenges in recent years to facilitate the development of systems capable of recognizing medication and ADEs. These challenges include the 2009 Informatics for Integrating Biology and the Bedside challenge, the Medication, Indication and ADEs from Electronic Health Record Notes (MADE) challenge, and the 2018 National NLP Clinical Challenges (n2c2) [41, 42]. These studies typically involve several tasks, including clinical NER, relation extraction and an integrated task. Compared with the existing models our model is specifically designed for the Chinese language environment. Due to the differences in entity types between English and Chinese, a direct comparison between our model and existing models may not be appropriate. We compared our model with existing models indirectly by comparing the recognition framework process and functionality. To the best of our knowledge, there has been no previous research that incorporates a knowledge graph into NLP to extract medication, ADEs and their associations. Our framework combines patient medication orders and leverages the knowledge graph to infer missing drug entities in the clinical notes, and also identifies new medication and ADE relationships after comparing them with the knowledge graph. In addition, by comparing the performance before and after the removal of the drug knowledge graph-related analysis process from DKADE (Table 7), we have also demonstrated the contribution of the drug knowledge graph. This approach demonstrates advantages in dealing with complex clinical language environments. The framework presented in this study has several limitations. Firstly, some ADEs may be caused by the interaction of multiple drugs. Our current identification model is not capable of inferring and completing adverse reaction relationships that involve multiple drugs simultaneously. Secondly, the updating of a knowledge graph is limited by the sources of knowledge, and the delayed updates of certain knowledge may result in biases in inferring and completing the relationships between drugs and adverse events. Thirdly, the performance of DKADE may vary when applied to different medical institutions, as the availability and quality of clinical data may differ. To ensure the stability of the identification framework under more widespread usage conditions, the entity recognition and binary classification models in the framework need to be further enhanced by incorporating data from additional medical institutions.
CONCLUSIONS
In this study, we proposed a novel framework based on deep learning and a knowledge graph, named DKADE and applied it to identify the relationships between ADEs and medications from clinical data. DKADE integrates rich deep learning algorithms to perform binary classification, entity recognition and entity alignment tasks. The drug knowledge graph is constructed and introduced to enable DKADE to infer and complement relationships between ADEs and medications and to effectively distinguish whether the relationships between identified ADEs and medications are new. Our results indicate that using a knowledge graph results in a better F1 score and recall. The experimental and external validation results demonstrate that DKADE can effectively identify and extract ADEs and related medications from complex Chinese semantic texts. By learning ADE-related knowledge from a large number of Chinese descriptions of ADEs, DKADE can facilitate adverse event surveillance and drug safety studies (Figure 5).
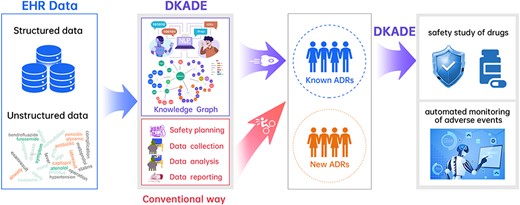
Overview of DKADE.
We propose a novel framework based on deep learning and a knowledge graph, called DKADE, for identifying adverse drug events (ADEs) and related medications from Chinese electronic medical records.
DKADE uses various deep learning algorithms to perform binary classification, entity recognition and entity alignment tasks and combines medication orders and drug knowledge to infer and complement missing drug entities and evaluate their correlations with ADEs.
DKADE can also automatically screen for new drug-adverse reaction relationships, and distinguish known and unknown ADEs by using the knowledge graph.
Experimental results show that DKADE achieves an overall F1-score value of 91.13%, indicating a good recognition performance. Moreover, the adaptability of DKADE is validated on real-world external clinical data.
ACKNOWLEDGMENTS
We acknowledge Haikun Xu and the High-Performance Computing Center of Central South University for their support. The study was approved by the university’s review board.
FUNDINGS
This work was supported by the National Key Research and Development Program of China (2021YFF1201400), the National Natural Science Foundation of China (22173118), the Hunan Provincial Science Fund for Distinguished Young Scholars (2021JJ10068), the Science and Technology Innovation Program of Hunan Province (2021RC4011), the Key Research and Development Program of Hunan Province of China (2020SK2010), and the Natural Science Foundation of Hunan Province (2023JJ60513, 2022JJ80104, 2020JJ9010).
DATA AVAILABILITY
The source codes and data are available at https://github.com/wuxuehong214/DKADE/wiki.
Author Biographies
Ze-Ying Feng is a PhD candidate at the Xiangya School of Pharmaceutical Sciences, Central South University, China. His research focuses on deep learning, bioinformatics and clinical pharmacy.
Xue-Hong Wu is a PhD candidate in the School of Computer Science and Engineering, Central South University, China. His current research interests include machine learning, deep learning and bioinformatics.
Jun-Long Ma is a PhD candidate in the Center of Clinical Pharmacology, The Third Xiangya Hospital, Central South University, China. His current research interests include machine deep learning and bioinformatics.
Min Li is a professor at the School of Computer Science and Engineering, Central South University, China. Her research interests include computational biology, systems biology and bioinformatics.
Ge-Fei He is a professor in the Department of Pharmacy, The First Hospital of Changsha, China. Her research focuses on clinical pharmacy and adverse drug reaction monitoring.
Dong-Sheng Cao is currently a professor at the Xiangya School of Pharmaceutical Sciences, Central South University, China. His research interests can be found at the website of his group: http://www.scbdd.com
Guo-Ping Yang is a professor at the Center of Clinical Pharmacology, The Third Xiangya Hospital, Central South University, China. His current research interests include machine clinical pharmacy and bioinformatics.
REFERENCES
Author notes
Ze-Ying Feng and Xue-Hong Wu contributed equally to this work.
