


Abstract
CD8+ T cells can recognize peptides presented by class I human leukocyte antigen (HLA-I) of nucleated cells. Exploring this immune mechanism is essential for identifying T-cell vaccine targets in cancer immunotherapy. Over the past decade, the wealth of data generated by experiments has spawned many computational approaches for predicting HLA-I binding, antigen presentation and T-cell immune responses. Nevertheless, existing HLA-I binding and antigen presentation prediction approaches suffer from low precision due to the absence of T-cell receptor (TCR) recognition. Direct modeling of T-cell immune responses is less effective as TCR recognition’s mechanism still remains underexplored. Therefore, directly applying these existing methods to screen cancer neoantigens is still challenging. Here, we propose a novel immune epitope prediction method termed IEPAPI by effectively incorporating antigen presentation and immunogenicity. First, IEPAPI employs a transformer-based feature extraction block to acquire representations of peptides and HLA-I proteins. Second, IEPAPI integrates the prediction of antigen presentation prediction into the input of immunogenicity prediction branch to simulate the connection between the biological processes in the T-cell immune response. Quantitative comparison results on an independent antigen presentation test dataset exhibit that IEPAPI outperformed the current state-of-the-art approaches NetMHCpan4.1 and mhcflurry2.0 on 100 (25/25) and 76% (19/25) of the HLA subtypes, respectively. Furthermore, IEPAPI demonstrates the best precision on two independent neoantigen datasets when compared with existing approaches, suggesting that IEPAPI provides a vital tool for T-cell vaccine design.
INTRODUCTION
Exploring the T-cell-mediated immune response mechanism is incredibly significant for cancer immunotherapy. Human leukocyte antigen (HLA)-mediated antigen presentation can display various peptides on the cell surface, which is a critical step in the immune response process [1]. HLA proteins involved in antigen presentation can be divided into class I HLA (HLA-I) and class II HLA (HLA-II) proteins. HLA-I proteins expressed in nucleated cells mainly present endogenous peptides that can be recognized by CD8+ T cells [2]. HLA-II proteins are expressed in professional antigen-presenting cells (such as dendritic cells and macrophages), displaying exogenous peptides that can activate CD4+ T cells [3]. Here we focus on the immune response associated with HLA-I proteins.
HLA-I proteins may bind with peptides generated in proteasomal cleavage to form peptide-HLA complexes, which can transport to the cell surface for display [1]. Generally, native peptides presented by normal cells do not activate T cells due to immune tolerance [4]. However, the non-native peptides generated from carcinogenesis, viral infection or xenotransplantation can broadly activate T cells through the HLA presentation pathway and thus trigger the subsequent immune responses [5–7]. Identifying such immunogenic peptides, also called immune epitopes, is paramount for cancer immunotherapy. For instance, existing immune epitope prediction methods can narrow the candidate set of neoantigens and reduce the workload of experimental verification, which are vital tools for developing tumor vaccines [8–11]. Moreover, tumor antigens obtained by these prediction algorithms can also be exploited as targets for CAR-T therapy [12].
Existing approaches of immune epitope prediction can be divided into three categories according to the source of training data and the method’s output. The first type of method is trained on the binding affinity (BA) data of peptides and HLA proteins, and the output is the binding probability or IC50 values [13–15]. In most BA-based methods [16, 17], 500 nM has been used as an affinity threshold to screen peptides for potential immune epitopes. For example, ACME [14] exploits the convolutional neural network and an attention module to interpret the binding of peptides to HLA-I proteins. However, HLA-I binding is only one step in antigen presentation; other steps include protease cleavage and transporter associated with antigen processing (TAP) (Figure 1A) [18]. Simply employing BA-based methods to screen immune epitopes will inevitably lead to limited performance. The second type of approach is trained on eluted ligands (EL) data and outputs the probability of antigen presentation. Representative EL-based methods include NetMHCpan4.1 [19] and mhcflurry2.0 [20]. The former exploits a simple feedforward neural network. In contrast, the latter predicts antigen processing and HLA-I binding separately, and finally utilizes the logistic regression to obtain antigen presentation scores. EL data cover whole antigen presentation processes, thus significantly improving the performance of antigen presentation prediction [21, 22]. Nevertheless, much evidence suggests that the presented peptides do not necessarily activate T cells [23, 24]. The binding of T-cell receptors (TCR) to peptide-HLA complexes is also critical for accurately predicting immune epitopes [25]. Therefore, the third type of method is directly trained on immunogenicity (IM) data and outputs the probability of a peptide being immunogenic [26–28]. For instance, DeepImmuno [26] adopts a convolutional neural network and a beta-binomial distribution to improve both recall and precision on dengue, cancer neoantigens and SARS-Cov-2 test datasets. Although IM data enable end-to-end modeling of immune epitopes, all existing IM-based methods are less effective due to insufficient IM training data. Therefore, it is still desirable to explore how to model immunogenicity more appropriately.
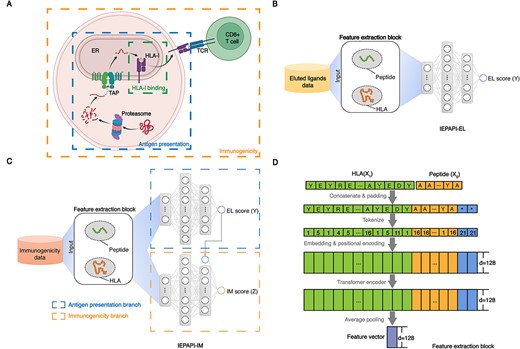
Deep learning of the antigen presentation process. (A) Overview of the biological processes of antigen processing, presentation and recognition by T cells. First, the intracellular protein is hydrolyzed into peptides by protease. Second, transporter associated with antigen processing (TAP) transports the peptide into the endoplasmic reticulum (ER). Third, the peptide binds to HLA-I protein to form a complex. Finally, the peptide-HLA complex is presented to the cell surface and binds to the TCR of CD8+ T cells. Created with BioRender.com. (B) The model structure of IEPAPI-EL. (C) The model structure of IEPAPI-IM. (D) The structure of feature extraction block.
To sum up, the above three types of approaches suffer from limited performance due to the lack of considering upstream/downstream biological processes. Specifically, BA-based methods only handle the binding process of peptides to HLA proteins while ignoring other biological features involved in antigen presentation. This inevitably results in a high recall but a low precision when using BA-based approaches to screen immune epitopes. EL-based methods also suffer from low precision in screening immune epitopes due to the absence of immunogenicity or TCR binding information. Furthermore, although the IM-based methods can directly predict immune epitopes, they could hardly achieve encouraging performance due to insufficient knowledge of T-cell immune response. Recently, several studies [29, 30] have demonstrated that both the BA and the antigen presentation score can facilitate immunogenicity prediction, which provides significant insight for designing more effective IM-based methods.
To address above-mentioned problems, we propose a novel immune epitope prediction method by incorporating antigen presentation and immunogenicity (IEPAPI), which consists of a shared feature extraction block and two separate branches for different tasks. First, IEPAPI efficiently encodes amino acid sequence information of peptides and HLA proteins using a transformer-based feature extraction block, which is trained on large-scale EL data. Second, the antigen presentation and immunogenicity branch of IEPAPI are separately trained on EL and IM data. Besides, the two branches output two scores, representing the probability of antigen presentation and immunogenicity, respectively. Notably, the antigen presentation branch’s output is merged into the immunogenicity branch’s input to mimic their biological connection. To demonstrate the advantage of IEPAPI over other approaches, we evaluate them on three independent datasets, including an antigen presentation dataset and two test datasets of cancer neoantigens. Quantitative comparison results exhibit that IEPAPI outperforms two start-of-the-art approaches, including NetMHCpan4.1 and mhcflurry2.0, on the independent antigen presentation test dataset. When applied to immunogenicity prediction, IEPAPI achieves the best AUC performance compared with DeepImmuno, IEDB method and DeepHLApan on two test datasets of cancer neoantigens. To validate the structural effectiveness of IEPAPI, we performed ablation studies to compare with a baseline model with one difference in the neural network structure. Experimental results suggest that incorporating the prediction of antigen presentation with the immunogenicity branch highlights the biological mechanism and thus contributes to better performance for immunogenicity prediction. Moreover, IEPAPI can reveal HLA-restricted motifs for both antigen presentation and immunogenicity. Overall, IEPAPI provides a new tool to overcome the limitations of existing methods in predicting immune epitopes, which can be applied to T-cell vaccine design.
MATERIALS AND METHODS
Dataset
There are two types of data used in this paper: (i) elution ligands (EL) data: peptides bound to HLA proteins eluted from the cell surface, containing antigen presentation information; (ii) immunogenicity (IM) data: peptides that can activate T-cell immune responses, containing immune information. The monoallelic EL data utilized to train our model were obtained from training data of NetMHCpan4.1 [19] and MHCflurry2.0 [20]. We employed only the positive EL samples provided in two studies, including 124 579 non-redundant instances from MHCflurry2.0 and 197 523 non-redundant instances from NetMHCpan4.1. We removed instances whose peptide length is not in the range of 8 to 11, and the remaining instances were collected to construct the training dataset. Subsequently, we generated negative instances with ten times the number of positive instances by randomly segmenting peptides from the Protein Data Bank (PDB) [31]. The basic strategy of randomly segmenting peptides from the protein database as negative samples is consistent with NetMHCpan4.1 and mhcflurry2.0. Moreover, the IM data exploited to train our model were fetched from three different studies [26, 29, 32]. Before training, we augmented the IM data using random peptides obtained from PDB. The number of random peptides was ten times that of positive instances. These random peptides and experimentally verified non-immunogenic peptides together constructed the negative IM training data. The collation and analysis of original data from different studies can be found in Supplementary Note 1, and the detailed data generation process can be found in Supplementary Note 2.
To demonstrate the advantage of our method in predicting antigen presentation, we first compared IEPAPI with two start-of-the-art approaches, NetMHCpan4.1 and mhcflurry2.0, on the independent EL test data collected from a recent peptidome dataset [33]. Second, for the prediction of immunogenicity, we compared IEPAPI with existing approaches on two independent cancer neoantigen datasets, including a glioblastoma (GBM) dataset [25] and a neoantigen dataset gathered by the Tumor Neoantigen Selection Alliance (TESLA) [30]. The detailed sample distribution of all independent test datasets is shown in Supplementary Figures 1 and 2.
Structure of IEPAPI
There are two versions for our approach according to different prediction tasks. One is for antigen presentation prediction, termed IEPAPI-EL, and the other is for immunogenicity prediction, which is named IEPAPI-IM. IEPAPI-EL aims to predict the presentation probability from peptide and HLA information, as shown in Figure 1(B). However, IEPAPI-IM attempts to predict whether the peptide can activate T cells (Figure 1C). We assume that the input variables |${X}_1$| and |${X}_2$| represent the pseudo sequence of HLA proteins [19] and the amino acid sequence of peptides, respectively. The top output |$Y$| denotes the probability of peptides presented by HLA proteins, and the bottom output |$Z$| is the probability of the peptide being immunogenic. Both |$Y$| and |$Z$| are constrained to the range of 0 to 1 by the sigmoid function. The mapping function between the input and the output can be formulated as |$Y={f}_1\left({X}_1,{X}_2\right),Z={g}_1\left({X}_1,{X}_2,Y\right)$|. We employ the feature extraction block to obtain the feature vectors of peptides and HLAs (Figure 1D). IEPAPI-IM and IEPAPI-EL share the same feature extraction block, which is trained on a large-scale EL dataset.
To verify the structural effectiveness of IEPAPI-IM, we construct a control model named baseline-IM (Figure 3D). The baseline-IM is modeled as |$Z={g}_2\left({X}_1,{X}_2\right)$|, which abandons the antigen presentation branch. Furthermore, the feature extraction block of baseline-IM is trained on IM data. The detailed parameters of the three models exploited in this study are shown in Supplementary Figure 3.
Feature extraction block
As shown in Figure 1(D), the feature extraction block first pads the character ‘*’ to the right end of the peptide sequence to form a maximum length of 11. It then concatenates the peptide sequence with the pseudo sequence of the HLA protein. As the HLA protein is represented using a pseudo sequence formed by residues at 34 sites on the binding pocket [19, 20], the length of the final spliced sequence is 45. We design tokens for 20 common amino acids, the padding character ‘*’ and the unknown amino acid symbol ‘X’. The concatenated sequences are tokenized to shape the input of the model:
where |${c}_i$| is a character and |${t}_i$| is its corresponding token, which is also an integer.
Unlike previous algorithms that use the BLOCKS substitution matrices (BLOSUM) to encode amino acids [14], we utilize the adjustable embedding layer to encode each token into a 128-dimensional word vector. Moreover, we also employ a trainable parameter matrix to encode positional information of the input sequence. The embedding layer and the positional encoding are the first two layers of the end-to-end model, whose parameters are learned during the training process. The encoded sequence is processed through one self-attention layer with eight heads [34]. Finally, we average all word vectors except the padding symbol ‘*’ to obtain a 128-dimensional feature vector characterizing peptide and HLA information.
Task related branches
The prediction model IEPAPI-IM can be divided into the antigen presentation branch and the immunogenicity branch (Figure 1C). As shown in Supplementary Figure 3, both the antigen presentation branch and the immunogenicity branch are composed of a three-layer fully connected neural network. The 128-dimensional feature vector provided by the feature extraction block is first passed through two fully connected layers with 1024 and 256 neurons, respectively. Batch normalization immediately follows these two fully connected layers to speed up the convergence of the neural network. Both layers adopt the Rectified Linear Unit (ReLU) as the activation function. Finally, the prediction score is generated by the last dense layer with only one neuron. The sigmoid function is utilized as the activation function to restrict the output in a range of [0, 1].
The antigen presentation branch of IEPAPI-IM utilizes the network weights of IEPAPI-EL completely and remains frozen during training on IM data. Therefore, the gradient of the loss generated from the IM score (|$Z$|) is back-propagated only to the immunogenicity branch. In addition, the structural difference between the baseline-IM and the immunogenicity branch of IEPAPI-IM is that the third dense layer in the immunogenicity branch of IEPAPI-IM additionally merges the EL score of the antigen presentation branch into its input. We design IEPAPI-IM this way because the network structure of IEPAPI-IM (Figure 1C) can largely mimic the connection between antigen presentation and immunogenicity shown in Figure 1(A), which is inspired by the biological mechanism that the antigen presentation is an essential upstream part of the T-cell immune response process.
Loss function
Considering that both antigen presentation and immunogenicity prediction are essentially classification problems, we adopted cross-entropy (CE) as the loss function:
where P = [p1, p2 ,..., pN] is the prediction, G = [g1, g2 ,..., gN] is the ground truth and N denotes the batch size.
Training process
First, we trained IEPAPI-EL with a large amount of EL data. Second, we exploited the network weights of IEPAPI-EL to initialize the feature extraction block and antigen presentation branch of IEPAPI-IM and froze them. The training of the immunogenicity branch in IEPAPI-IM was completed on the IM data.
We employed the 5-fold cross-validation to find the optimal parameters and the model with the best generalization performance in the formal training process. For the EL data or the IM data, we randomly divided them into five non-overlapping equal parts, each of which was utilized as a validation set in turn, and the remaining four parts were merged as a training set. For each fold, we computed the performance of predictions on the validation set. During the training process, the maximum number of iterations was set to 200, and the learning rate was set to 0.00005. When the performance on the validation set has not improved for 50 consecutive epochs, it was considered that the network had converged, and the training process was terminated early. Finally, we saved the model which achieved the best performance on the validation set. In the 5-fold cross-validation, we obtained an optimal neural network for each fold. The final model was an ensemble of these five neural networks by averaging their predictions as the final output. The AdamW optimizer [35] was employed in the training process with a weight decay parameter of 0.01 to control the network complexity.
The model training was implemented on the Centos Linux release 7.9.2009 (Core) system. The CPU is an Intel(R) Xeon(R) CPU E5–2678 v3 @2.50GHz with 14 logical processors. The GPU is 8 Tesla K80, and the available memory of each GPU is 11 G. The computer programs are based on Python 3.7.9 and the deep learning framework Pytorch1.8.0.
Evaluation metrics
We exploited various evaluation metrics to evaluate the model’s performance, including the area under the receiver operating characteristic curve (AUC), the area under the precision-recall curve (AUPRC), accuracy, precision and F1 score:
where TP is the number of true positive instances, FP is the number of false positive instances, TN is the number of true negative instances and FN is the number of false negative instances.
Demonstration of HLA-restricted motifs
As we employ a transformer encoder to extract sequence information, attention scores can be calculated to show which sequence parts influence the final output more critically. The calculation process is shown in Figure 4(A). After the sequence embedding and positional encoding, the word vector is multiplied by three weight matrices to obtain three different vectors: Query, Key and Value. The attention weight of each word vector is calculated by Queries and Keys [34], and then an attention weight matrix is obtained. We extract the items related to the peptide in the attention weight matrix and compute their average to obtain the attention value of each peptide position, which indicates the proportion of the position’s impact on the final output.
We downloaded 207 304 human protein sequences from the UniProt [36] database and randomly sampled 100 000 peptides with nine amino acids. Given a specific HLA typing, we selected the top 1% peptides in the EL score or the IM score ranking. The attention scores corresponding to these 1000 peptides were summed to form the total attention values of 20 common amino acids at nine sites of the peptides. Finally, the cumulative attention values of 20 amino acids corresponding to nine sites were presented as a heat map for each HLA.
![Comparison of the IEPAPI-EL with existing methods on antigen presentation prediction. (A) Precision-recall (PR) curve and receiver operating characteristic (ROC) curve on the independent presentation test dataset. (B) AUC changes across all HLAs provided by the independent presentation test dataset [33] compared with NetMHCpan4.1-EL and mhcflurry2.0. The green and red bars indicate performance gains and drops, respectively. (C) Comparison of the AUPRC between IEPAPI-EL and NetMHCpan4.1-EL/mhcflurry2.0 on all HLAs. HLAs above the green dashed line are marked in green, indicating that IEPAPI-EL achieved an AUPRC improvement of more than 0.01 on these HLAs; HLAs below the red dashed line indicate that IEPAPI-EL suffered from AUPRC decrease of more than 0.01 compared with NetMHCpan4.1-EL or mhcflurry2.0.](https://oup.silverchair-cdn.com/oup/backfile/Content_public/Journal/bib/24/4/10.1093_bib_bbad171/1/m_bbad171f2.jpeg?Expires=1749148008&Signature=QYvQBpvherleyaBqOzlp4u5amus19SLzvqrUi5b0WHJwapTavGhXnlQUEPCQUT~z7nJihobOdbcuT3iUXhIL~dLrhksWjN6RaRAgDrIL1p0gPWxa~JHDbaxM4A2WKJUx93JeXIO5WVujy3P2Q46HNpJ9opYmcH3G5hUm9jqRrcvDBK1X5gHAIzkQU9EMiG5nAcQ7WlHjTPCscSZLHqygPLtiZ~KFMGGDFjiqV0KVk7GuiWY1gTNflAEowFHHuEHmv05i5Fuz1Y860YWYdxxNMG1-E7E7BrXR7QKG4ZqNPMwC11Xm8ohN9OGH5AwDmp~KwwbgsoDJaxH1UN1N73x9HQ__&Key-Pair-Id=APKAIE5G5CRDK6RD3PGA)
Comparison of the IEPAPI-EL with existing methods on antigen presentation prediction. (A) Precision-recall (PR) curve and receiver operating characteristic (ROC) curve on the independent presentation test dataset. (B) AUC changes across all HLAs provided by the independent presentation test dataset [33] compared with NetMHCpan4.1-EL and mhcflurry2.0. The green and red bars indicate performance gains and drops, respectively. (C) Comparison of the AUPRC between IEPAPI-EL and NetMHCpan4.1-EL/mhcflurry2.0 on all HLAs. HLAs above the green dashed line are marked in green, indicating that IEPAPI-EL achieved an AUPRC improvement of more than 0.01 on these HLAs; HLAs below the red dashed line indicate that IEPAPI-EL suffered from AUPRC decrease of more than 0.01 compared with NetMHCpan4.1-EL or mhcflurry2.0.
RESULTS
Comparison of IEPAPI-EL with existing methods in antigen presentation prediction
To demonstrate the effectiveness of IEPAPI-EL in predicting antigen presentation, we compared it with two time-honored approaches in this field: NetMHCpan4.1 [19] and MHCflurry2.0 [20]. The monoallelic EL training data were obtained from the training data of NetMHCpan4.1 and MHCflurry2.0. As the majority of the collected EL data have peptide lengths ranging from 8 to 11 (Supplementary Table 1 and Supplementary Figure 1), we discuss peptides with length only in this range here. The output of IEPAPI-EL is a probability score ranging from 0 to 1. For fairness, we adopted the EL score of NetMHCpan 4.1 and the presentation score of mhcflurry2.0 in comparison instead of their %rank value.
For the independent antigen presentation test dataset, positive instances were derived from a recent mass spectrometry experiment [33]. To prevent data leakage, all positive instances that appeared in the training data were removed from the test dataset. Negative instances consist of natural peptides randomly sampled from PDB (Supplementary Note 2). According to Supplementary Table 2 and Supplementary Figure 2, the final antigen presentation test dataset has 289 723 entries, of which 9.09% were positive instances. Moreover, the coverage of 25 common HLAs enables an adequate model comparison.
We adopted AUC and AUPRC to evaluate the presentation prediction performance of each approach. First, we compared the performance of the three models on the entire independent test dataset (Figure 2A). IEPAPI-EL (AUC = 0.9556, AUPRC = 0.8364) outperformed mhcflurry2.0 (AUC = 0.9449, AUPRC = 0.8248) and NetMHCpan4.1-EL (AUC = 0.9328, AUPRC = 0.8101) on both evaluation metrics. This is attributed to the efficient encoding of the transformer-based feature extraction block for peptides and HLAs. Second, we exhibited the performance enhancement and decline of IEPAPI-EL over existing EL-based approaches on each HLA separately, as shown in Figure 2(B). Compared with NetMHCpan4.1-EL, IEPAPI-EL achieved better AUC on all 25 HLAs. The most significant improvement was for HLA-A*02:01, which is a prevalent HLA subtype in the population. Similarly, for the metric of AUPRC, IEPAPI-EL outperformed NetMHCpan4.1-EL on almost all HLAs except for HLA-A*02:52 (Figure 2C). Compared with mhcflurry2.0, IEPAPI-EL achieved an AUC improvement on 76% (19/25) of the HLAs. The subtype with the most significant elevation in AUC was HLA*B15:13. The results shown in Figure 2 provide a reference for researchers when selecting prediction methods for specific HLA subtypes.
IEPAPI-IM enables more accurate immunogenicity prediction
Precisely predicting immunogenic peptides that activate CD8+ T cells is vital for finding cancer neoantigens. To demonstrate the advantage of IEPAPI-IM in predicting immunogenicity, we compared it with three existing algorithms for immunogenicity prediction, including DeepImmuno [26], IEDB method [27] and DeepHLApan [28]. Furthermore, we designed a control model baseline-IM for comparison to show the improvement of IEPAPI-IM in model structure. The difference between baseline-IM and IEPAPI-IM is that baseline-IM is trained entirely on IM data (Figure 3A). In contrast, the feature extraction block and the antigen presentation branch of IEPAPI-IM are trained on EL data, whereas its immunogenicity branch is trained on IM data incorporating the prediction of antigen presentation to its input (Figure 1C).
![Comparison of IEPAPI-IM with existing methods and baseline-IM on immunogenicity prediction. (A) The model structure of baseline-IM. (B) The prediction performance curves of baseline-IM and IEPAPI-IM along epoch number on the validation set in the first fold of the 5-fold cross-validation. (C) The comparison of ROC curves for all immunogenicity prediction models on two independent neoantigen test datasets [25, 30]. (D) Performance comparison of all immunogenicity prediction models on independent test datasets. The IEDB method uses 0 as the classification threshold, and the other four approaches adopt 0.5 as the threshold.](https://oup.silverchair-cdn.com/oup/backfile/Content_public/Journal/bib/24/4/10.1093_bib_bbad171/1/m_bbad171f3.jpeg?Expires=1749148008&Signature=nlH7NYYe9mML27HdBvl5FhjTkiuKKD0VWVlvgRUc-p~2qilsjgwXB86iQjw8HSzR44mI00EdHm27FKaT3T5h0KSEa5kw3pGfYbBuxgdFYkHQx8wuAxfQhDUi3NFrnUPh5W7JjtfmC2P5xWnGXKDIKYaAYx-Cml39l7uxpao0u917NpAwCVbEcv0MaOV5N9WmLtK-bHzECRtcmRhnmuiE7SHcDAHywMPpZYj7Sqqt1N8orfjTZpKQ6zOYFDqhNv3cJD5ZRl4ik2bzDo6dwUj-fpPn6c9vMkjYbK0yHcqjRX1~DXbq864KmKElQyIQ5IIQqVX9yFHw4tGIn6CkY31sTg__&Key-Pair-Id=APKAIE5G5CRDK6RD3PGA)
Comparison of IEPAPI-IM with existing methods and baseline-IM on immunogenicity prediction. (A) The model structure of baseline-IM. (B) The prediction performance curves of baseline-IM and IEPAPI-IM along epoch number on the validation set in the first fold of the 5-fold cross-validation. (C) The comparison of ROC curves for all immunogenicity prediction models on two independent neoantigen test datasets [25, 30]. (D) Performance comparison of all immunogenicity prediction models on independent test datasets. The IEDB method uses 0 as the classification threshold, and the other four approaches adopt 0.5 as the threshold.
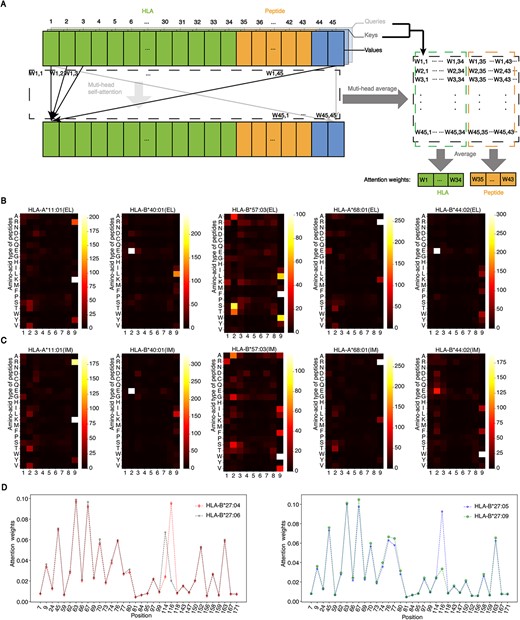
HLA-restricted motifs in antigen presentation and immunogenicity. (A) Process for calculating attention weights. (B) Representative examples of the antigen presentation motifs for several HLAs. Each column corresponds to one position of the peptide, and each row corresponds to one amino acid type. A brighter pixel suggests the more significant impact of the residue on antigen presentation. Only the 9-mer motifs are shown here. (C) Representative examples of the immunogenicity motifs for several HLAs. (D) Attention weights for pseudo sequences of HLA*B27. The horizontal axis shows the position of 34 selected amino acids in the HLA protein.
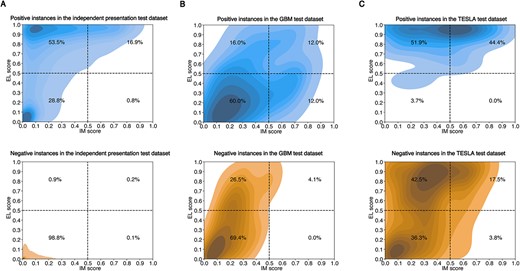
The KDE plot of output distribution. The output distributions of EL score and IM score for the positive and negative instances from the independent antigen presentation test dataset (A), the GBM test dataset (B) and the TESLA test dataset (C). The proportion of samples is exhibited in four classification regions yielded by setting the classification threshold to 0.5.
We employed AUC, AUPRC, accuracy, precision and F1 score as evaluation metrics. For baseline-IM, IEPAPI-IM, DeepHLApan and DeepImmuno, whose outputs are distributed from 0 to 1, we utilized 0.5 as the classification threshold. For IEDB method whose outputs are distributed from −1 to 1, we adopted 0 as the classification threshold. Notably, IEDB method exploited only peptides for immunogenicity prediction, whereas other approaches used HLA-peptide complexes as input. All immunogenicity prediction algorithms were evaluated on two independent cancer neoantigen datasets.
First, we evaluated baseline-IM and IEPAPI-IM on the validation folds during training (Figure 3B and Supplementary Figure 4). The AUC of IEPAPI-IM is much higher than that of baseline-IM on each validation fold of the IM data at the initial epoch of the training process. Furthermore, IEPAPI-IM reaches the maximum performance point faster than baseline-IM, implying the effectiveness of exploiting a feature extraction block trained on large-scale EL data. As the iterative training progressed, both baseline-IM and IEPAPI-IM showed overfitting due to insufficient IM training data. However, as we selected the model with the best performance on the validation set, the preserved IEPAPI-IM (AUC = 0.9289) still outperformed the preserved baseline-IM (AUC = 0.9190) in respect of the first fold (Figure 3B). The results demonstrated that the incorporation of antigen presentation boosted IEPAPI-IM in terms of the feature extraction block and the additional input information.
Second, we performed model comparisons on two independent cancer neoantigen test datasets. One of them is the GBM test dataset which contains 123 entries for HLA-A*02:01. The other is the TESLA test dataset, which holds 399 entries for seven different HLAs. Both datasets do not overlap with the IM training data. The experimental results are exhibited in Figure 3(C), Supplementary Figure 5 and Figure 3D. Regarding AUC and AUPRC, it is clear that baseline-IM does not outperform DeepImmuno, IEDB method and DeepHLApan on two neoantigen test datasets. It can be seen that for the GBM test dataset (Figure 3C and Supplementary Figure 5), IEDB method achieved a higher AUC and AUPRC than DeepHLApan and DeepImmuno. However, IEPAPI-IM further increased the AUC and AUPRC performance compared with IEDB method by about 3.6 and 15.4%, respectively. In particular, IEPAPI-IM outperformed the latest approach DeepImmuno on the GBM test dataset by a large margin (40.0% improvement on AUC). Similarly, IEPAPI-IM outperformed all other approaches on both AUC and AUPRC metrics in the TESLA test dataset.
We then configured the classification threshold to evaluate the performance of immunogenicity prediction. The experimental results (Figure 3D) illustrate that IEPAPI-IM achieved the best performance on almost all metrics, including the highest accuracy (GBM: 0.8130, TESLA: 0.7644), precision (GBM: 0.6000, TESLA: 0.1319) and F1 score (GBM: 0.3429, TESLA: 0.2034) on both independent test datasets. Especially on the TESLA test dataset, the precision of IEPAPI-IM is nearly two times that of DeepImmuno, which suggests that the accurate antigen presentation prediction could further contribute to the improvement of IEPAPI for immunogenicity prediction. To evaluate the computational efficiency of our approach, we compare the inference speed of IEPAPI with other approaches on the same computer and the results are shown in Supplementary Note 3.
HLA-restricted motifs in antigen presentation and immunogenicity
As we employed a transformer-based feature extraction block to obtain representations of peptides and HLAs, the self-attention mechanism can help to explain the contribution of each residue of the peptide to the model’s output. After specifying the HLA, we adopted IEPAPI-EL or IEPAPI-IM to make predictions for 100 000 random 9-mer peptides sampled from the UniProt dataset [36]. Attention scores were calculated for the top 1% of peptides in the prediction results (Figure 4A). We accumulated their attention scores to acquire the attention heat maps (Figure 4B and C). A brighter color indicates a higher cumulative score and a more significant effect on the output.
Part of the motifs exhibited in Figure 4(B) and (C) can be explained in the affinity analysis of peptide-HLA complexes [14]. For example, for HLA-B*40:01, it can be seen that GLU(E) at position 2 (P2) has a significant effect on both antigen presentation and immunogenicity. The previous study [37] shows that this site belongs to the anchor amino acid, which is of great significance for the binding of peptides to HLA-B*40:01 proteins. Consequently, it will naturally have an important impact on the downstream biological processes (Figure 1A). In addition, the motifs, such as Lys (K) at P9 for HLA-A*11:01, Trp (W) at P9 for HLA-B57:03, Arg (R) at P9 of peptides for HLA-A68:01 and Glu (E) at P2 for HLA-B44:02, are reported to be related to binding in the previous study [14]. Encouragingly, their effects on antigen presentation and immunogenicity are captured by our methods, as shown in Figure 4.
To facilitate the reading of more scholars, we presented the sequence logo using the toolkit WebLogo [38], which could reveal HLA-restricted motifs more clearly (Supplementary Figure 6). The high similarity between the motifs output by IEPAPI-EL and IEPAPI-IM is because antigen presentation is a fundamental upstream process in the T-cell immune response. Finally, we downloaded the binding motifs of these HLAs from the MHC Motif Atlas [39], and it can be seen that our approach found most of the currently recognized HLA class I binding motifs, as exhibited in Supplementary Figure 6.
In addition to visualizing the motifs of immune epitopes, the calculated attention weights could also be exploited to reveal the effect of HLA to the final immunogenicity score. For instance, ankylosing spondylitis (AS) risk is found to be associated strongly with HLA-B*27, which has 167 reported subtypes [40]. Current studies [41] demonstrated that HLA-B*27:04 and HLA-B*27:05 were strongly associated with AS, whereas HLA-B*27:06 and HLA-B*27:09 were unassociated or weakly associated with AS. The only difference between HLA-B*27:05 and HLA-B*27:09 is the single amino acid at P116 (Asp and His). As well, HLA-B*27:04 varies from HLA-B*27:06 by only two amino acids at P114 (His and Asp) and P116 (Asp and Tyr).
We calculated immunogenicity scores for 100 000 random 9-mer peptides with the four HLA-B*27 subtypes mentioned above, respectively. Similar to the attention weights calculation for peptides, we counted the cumulative attention weights of HLAs in the top 1000 scoring predictions. The normalized attention weights of HLA pseudo sequences were shown in Figure 4(D). We observed that the Asp at P116 of HLA-B*27:04 and HLA-B*27:05 both contribute significantly to the model’s output, whereas the Tyr at P116 of HLA-B*27:06 and the His at P116 of HLA-B*27:09 exhibited much less effect on the model’s output. This phenomenon suggested that the Asp at P116 of HLA-B*27 could influence AS strongly through antigen presentation.
Distribution analysis of the output
Fed with peptide-HLA complexes, our method can simultaneously provide probability scores for antigen presentation and T-cell immune response. It is generally believed that only peptides presented on the cell surface could further bind to TCR and generate the first signal to activate T cells [42]. Therefore, it is worth exploring whether the two outputs of IEPAPI are consistent with the above relationship. The output distributions of EL scores and IM scores on three independent test datasets are shown in Supplementary Figure 7. We calculated and visualized the kernel density estimate (KDE) on the positive and negative instances using the tool seaborn [43] (Figure 5).
First, it can be observed from Figure 5A that the recall on the independent antigen presentation test dataset was 70.4%, and only 17.7% of the presented peptides were predicted to be immunogenic. Furthermore, 98.8% of negative instances generated by random sampling were simultaneously determined to be neither presentable nor immunogenic by our approach, which suggests that both EL and IM scores can recognize random peptides well. Less than 1% of positive and negative samples were predicted to be non-presentable but immunogenic, which demonstrates that the prediction of antigen presentation and immunogenicity provided by IEPAPI covers the biological relationship that only presented peptides could further activate T-cells.
Second, in terms of distinguishing positive immunogenic peptides, EL and IM scores recognized 28 and 24% of the true immunogenic peptides in the GBM test dataset, respectively (Figure 5B). For the TESLA test dataset, the EL score achieved a high recall of 96.3%, whereas the IM score only identified 44.4% of positives (Figure 5C). However, the EL score is much less capable than the IM score in screening for non-immunogenic peptides. The IM score precisely predicted 95.9% of experimentally validated non-immunogenic peptides on the GBM test dataset, whereas the EL score found only 69.4% of them (Figure 5B). For the TESLA test dataset, the EL and the IM score distinguished 40.1 and 78.8% of the non-immunogenic peptides, respectively (Figure 5C). The above results demonstrate that the EL and IM score can be well adapted to the situation requiring high recall and high precision of immunogenicity prediction, respectively. In analogy to the antigen presentation prediction, few positive/negative examples in both GBM and TESLA datasets were predicted with low EL scores and high IM scores, which reveals the capability of our approach to simulate the biological connection between antigen presentation and immunogenicity.
CONCLUSION
In this paper, we exploited the relationship between antigen presentation and immunogenicity to construct an immune epitope prediction method, IEPAPI. First, the transformer-based deep learning module enabled IEPAPI to surpass the two most widely used tools, NetMHCpan4.1 and mhcflurry2.0, in predicting antigen presentation. For the 25 HLA subtypes in the independent antigen presentation test dataset, IEPAPI outperformed NetMHCpan4.1 and mhcflurry2.0 for 100 (25/25) and 76% (19/25) of the HLA subtypes, respectively. Second, IEPAPI significantly improved in predicting immunogenicity by incorporating antigen presentation. Compared with three existing immunogenicity prediction approaches (DeepHLApan, IEDB method and DeepImmuno), IEPAPI achieved the best performance regarding AUC, AUPRC, accuracy, and precision. In particular, the precision of IEPAPI on the GBM and TESLA test datasets is 2.1-fold and 70% higher than that of latest DeepImmuno, respectively. Third, IEPAPI can exhibit HLA-restricted motifs with respect to both antigen presentation and immunogenicity. We found that IEPAPI could highlight known patterns corresponding to several characterized HLAs, demonstrating the reliability of the motif uncovered by IEPAPI. Finally, we analyzed the distribution of the two IEPAPI outputs on one antigen presentation and two immunogenicity test datasets. The experimental results show that IEPAPI rarely makes the mistake of simultaneously predicting peptides as non-presentable and immunogenic.
Despite the progress achieved so far, several challenges still need to be addressed. For instance, there may be noise in the EL or IM data. For HLA- A*68:01, its last anchor is known to be hydrophobic. However, some peptides from the study [44] show a trypsin-like motif at the last anchor, and our current modeling approach cannot handle these uncertainties. Such noisy data may result in incorrect prediction and motifs for specific HLAs. Furthermore, it is still challenging to properly model the T-cell immune response as the biological mechanism remains underexplored. Considering that the immunogenicity of the presented peptide is associated with the TCR binding process [45], further incorporating the TCR binding prediction may further facilitate the performance of immunogenicity prediction.
The transformer-based feature extraction block efficiently encodes amino acid sequences of peptides and HLA proteins, enabling IEPAPI to achieve state-of-the-art performance for antigen presentation prediction.
The incorporation of antigen presentation in the structure of IEPAPI simulates the biological connection and thus significantly boosts the predictive performance of immunogenicity.
HLA-restricted motifs are visualized by heat maps and sequence logos for both antigen presentation and immunogenicity, which contributes to a profound understanding of T-cell immune epitopes.
The analysis of the output distribution provides interpretability of the prediction model and informs the application of IEPAPI in the search for cancer neoantigens.
FUNDING
National Science Foundation of China (Grant No. 62173204).
DATA AVAILABILITY
Datasets used in this study have been deposited in Mendeley Data under DOI: 10.17632/fwxg5mgntn.2, which are available at https://data.mendeley.com/datasets/fwxg5mgntn. Analysis of the training and test data is given in the Supplementary Information. The source code and our trained models are freely available at https://github.com/ddd9898/IEPAPI, with detailed instructions.
Author Biographies
Juntao Deng is a PhD student at the Department of Automation, Tsinghua University. His research interests include the application of machine learning algorithms in drug development.
Xiao Zhou is a PhD student at the Department of Automation, Tsinghua University. His research interests include machine learning and cancer early diagnosis.
Pengyan Zhang is a PhD student at the Department of Automation, Tsinghua University. His research interests include the application of deep learning in proteomics and drug development.
Weibin Cheng is a chief physician at Guangdong Second Provincial General Hospital. His research interests include epidemiological methods, application of artificial intelligence in medical medicine.
Min Liu is a professor at the Department of Automation, Tsinghua University. His research interests include bioinformatics, innovative drug development and precision medicine driven by artificial intelligence.
Junzhang Tian is a chief physician at Guangdong Second Provincial General Hospital. His research interests include imaging medicine, application of artificial intelligence in medical medicine.
