


Abstract
The volume of ribonucleic acid (RNA)-seq data has increased exponentially, providing numerous new insights into various biological processes. However, due to significant practical challenges, such as data heterogeneity, it is still difficult to ensure the quality of these data when integrated. Although some quality control methods have been developed, sample consistency is rarely considered and these methods are susceptible to artificial factors. Here, we developed MassiveQC, an unsupervised machine learning-based approach, to automatically download and filter large-scale high-throughput data. In addition to the read quality used in other tools, MassiveQC also uses the alignment and expression quality as model features. Meanwhile, it is user-friendly since the cutoff is generated from self-reporting and is applicable to multimodal data. To explore its value, we applied MassiveQC to Drosophila RNA-seq data and generated a comprehensive transcriptome atlas across 28 tissues from embryogenesis to adulthood. We systematically characterized fly gene expression dynamics and found that genes with high expression dynamics were likely to be evolutionarily young and expressed at late developmental stages, exhibiting high nonsynonymous substitution rates and low phenotypic severity, and they were involved in simple regulatory programs. We also discovered that human and Drosophila had strong positive correlations in gene expression in orthologous organs, revealing the great potential of the Drosophila system for studying human development and disease.
INTRODUCTION
A thoroughly understood transcriptome is the basis of biological studies of almost all species [1–3]. The D. melanogaster has approximately 65% of human orthologous genes associated with disease and is therefore attracting growing attention as a model organism [4–6]. Some previous studies have investigated the gene expression throughout the fly life cycle in specific tissues [7–10]. Recent work has applied ribonucleic acid (RNA)-seq technology to uncover the diversity, dynamics and genetic basis of the Drosophila transcriptome [3, 11–13]. Similarly, emerging single-cell or single-nucleus studies provide valuable data on gene expression in different types of cells [14–16].
While a significant amount of transcriptomic data is publicly available, there remains a need for systematic integration of both new and existing data remains. Meta-analysis offers the potential to identify rare transcripts and facilitate comprehensive and multidimensional characterization of gene expression patterns. The value of reusing datasets is recognized in the FAIR Data Principles (Findable, Accessible, Interoperable and Reusable) [17], which are increasingly being implemented as policy. However, the challenge of ensuring data quality and adherence to FAIR standards remains due to the heterogeneity of data resulting from the specific needs of focused studies and procedures in different laboratories, as well as poorly organized metadata. Practical, rather than intellectual, challenges are the main barriers to the comprehensive analysis of large gene expression datasets from both model organisms and humans.
It is crucial to ensure the data quality when integrating large-scale public sequencing data. However, commonly used data quality control tools, such as FastQC, fastp [18] and MultiQC [19], only examine the quality of the sequencing sample itself, such as the sequencing quality of raw read and contamination from other species. They did not take into account the differences between samples, so the error caused by many other factors, such as mis-annotation of sequencing type, would be ignored. Therefore, some software for quality control of high-volume data, such as RNA-SeQC2 [20], RNA-QC-chain [21] and Qualimap [22], extracted some features from samples to characterize the quality of alignment and expression. However, these software products neither integrate these features nor provide criteria for subsequent filtering. While some studies have used expression correlation as an indicator to exclude outliers [20, 23], this approach would result in significant loss of information and is not applicable to large-scale heterogeneous data (e.g. different tissues and developmental stages).
Based on the unsupervised machine learning algorithm, Isolation Forest (iForest) [24], we developed a tool named MassiveQC to perform quality control and outlier detection on large amounts of public data. In addition to checking the sequencing quality of raw reads, MassiveQC extracts 21 important features from the sequencing samples and generates an iForest model based on the features of all samples for outlier detection. Using MassiveQC, we collected and filtered 62,927 Drosophila RNA-seq samples from Sequence Read Archive (SRA), resulting in 12 K high-quality samples for further analysis. To highlight the value of this exercise, we investigated the gene expression dynamics and systematically characterized the correlations between expression dynamics and other amenable high-throughput measures such as evolutionary constraint, regulatory input and functional categories. Finally, we analyzed the conservation in gene content and expression profile between human and Drosophila, providing a greatly improved view of the commonalities between expressions in these two organisms. The striking conservation of expression patterns by organ provides the basis for the high translatability of disease gene research between human and Drosophila. The integration of massive Drosophila RNA-seq data not only serves the model organism community but also provides a test of our methods for use in other organisms.
MATERIALS AND METHODS
SraMongo: downloading NCBI databases
We developed a Python package (SraMongo, https://sramongo.readthedocs.io/en/latest/) to query, download, parse and store records from the SRA. SraMongo uses the Entrez utility API to query Entrez databases and download their XML records. Each sample is an individual sequencing library assigned with a unique SRA accession number (SRX/ERX/DRX) that is associated with one or more sequencing runs (SRR/ERR/DRR), which constitutes technical replicates. Although only 24 K samples were analyzed, SraMongo is capable of handling larger numbers of datasets. Each XML record is parsed into a local document database (MongoDB Community server) and indexed by experiment accession (SRX/ERX/DRX). We used this local database to generate a processing queue, explore technical and biological metadata and aggregate metadata for use in downstream analyses.
MassiveQC: quality control of massive high-throughput sequencing data
MassiveQC obtained the download URL of each run (SRR) from the ENA Portal API (https://www.ebi.ac.uk/ena/portal/api/filereport) and used the command ‘ascp’ or ‘wget’ command to download the raw sequencing file (.fastq.gz). The downloaded files were examined by checking the sequencing reads. Single-end runs with at least 1000 reads and an average read length > 10 bp were considered successful. Meanwhile, pair-end runs with both R1 and R2 having at least 1000 reads and an average read length > 10 bp were considered successful. For runs where either R1 or R2 failed, the workflow kept the passing FASTQ files (R1 or R2) and re-annotated the library as single-ended. Runs that completely failed these criteria were flagged as having download issues and removed from further processing. Additionally, runs with malformed quality scores or sequenced using the ABI Solid color space were similarly flagged and removed.
Following ‘Check reads’, contamination levels were quantified using FastQ Screen [25] and adapter and poly(T/A) sequences were trimmed using Atropos. Reads shorter than 25 bp after trimming were removed. The runs were aligned to the reference genome using HISAT2 with the parameter‘—max_intronlen 300000—known-splicesite-file <splicesite-file>’. Additional alignment statistics were then generated using ‘samtools stats’ [26], ‘bamtools stats’ [27] and ‘CollectRNASeqMetrics’ (https://gatk.broadinstitute.org/hc/en-us). Library complexity was estimated using ‘MarkDuplicates’. Library strandedness was determined by calculating the percentage of reads mapping to each strand using ‘CollectRNASeqMetrics’. A run was assigned as forward stranded if 75% of the reads mapped to the same strand as the gene model, reverse stranded if 75% of the reads mapped to the opposite strand as the gene model or unstranded. Subsequently, MassiveQC generated a set of genomic counts (genic, intergenic, junctions) using ‘featureCounts’ [28]. After ‘Quality control’ and ‘Alignment’, we trained an iForest model (scikit-learn; v0.22.1) using the 21 features generated by the above process and detected outliers based on this model.
iForest model construction and evaluation in D. melanogaster RNA-Seq
The Library Strategy information obtained by SraMongo describes which sequencing method was used (e.g. RNA-Seq, EST, WGS, ChIP-Seq). Currently, the SRA allows for 36 different terms. Here we focused on the most common Library Strategy (RNA-Seq). In MassiveQC, we used an anomaly detection method (iForest) to identify and remove outlier RNA-Seq samples. Initially, the RNA-Seq samples were segregated into training and testing datasets, with the former being used to train the iForest model by utilizing 100 decision trees. We validated the RNA-Seq iForest model using RNA-Seq test data to generate a test dataset consisting of different proportions of EST, WGS or ChIP-Seq runs. To better understand why iForest classified a sample as an outlier, we used Shapley Values to help interpret the model [29]. Briefly, given the RNA-Seq iForest model, local Shapley values were calculated for each sample describing how each feature contributed to moving the sample toward or away from the mean.
Alignment workflow
The alignment workflow generated experiment level (SRX) deliverables, including genomic feature counts and coverage tracks (BigWigs). The workflow began by removing adapter sequences, poly(T/A) sequences and low-quality bases (−q 20) using Atropos [30]. Reads shorter than 25 bp after trimming are excluded. Runs were then aligned to the D. melanogaster Release 6 plus ISO1 MT (GCA_000001215.4) using ‘hisat2—max_intronlen 300000—known-splicesite-file <r6.11 GTF> —rna-strandness <forward or reverse>’. The library strandedness information was obtained from the pre-alignment workflow. Multi-mapping reads and low-quality alignments were removed using ‘samtools -q 20’, and all runs from a library (i.e. SRRs from an SRX) were merged using ‘samtools merge’. We also performed a post hoc analysis using correlation to flag libraries whose runs did not look like technical replicates. The workflow generated genomic coverage counts (genic, intergenic and junction) using ‘featureCounts’ with the options ‘-p -P -C -J’ for pair-end or ‘-J’ for single-end libraries. Stranded genome browser tracks were then generated using ‘bamCoverage—binSize 1—normalizeTo1x 129,000,000—ignoreForNormalization chrX—outFileFormat bedgraph—filterRNAstrand <forward or reverse>’ [31].
Normalization of biological metadata
The normalization of biological metadata was carried out for RNA-Seq samples, by creating a set of keywords for each sample using natural language processing. Briefly, for each sample, we tokenized all author biological metadata, including sample titles and used term frequency inter-document frequency (TFIDF), to identify and weight keywords using NLTK [32]. Next, we aimed to create a set of normalized biological attributes for the four main attribute classes (sex, developmental stage, tissue and cell type). We aggregated author-supplied attributes related to these categories and harmonized class labels by hand (e.g. developmental stage versus dev_stage). For each attribute class, we manually mapped values to the FlyBase controlled vocabulary and imputed missing values by searching the sample keywords.
Analysis of gene expression dynamics
All analyses in this study used FPKM (Fragments per Kilobase of transcript per Million mapped reads) to quantify gene expression. We applied the R package sva to remove batch effects among samples and estimate gene expression variations [33]. Genes with FPKM > 0.1 in at least one sample were retained for further analysis. The evolutionary age of genes was retrieved from GenOrigin [34] and GenTree [35]. The estimates of dN/dS values were provided by flyDIVaS [36]. The promoter of each gene was defined as the region 500 bp upstream to 500 bp downstream of the transcription start site. We measured sequence conservation of gene promoters using phastCons and PhyloP, with basewise conservation scores acquired from the UCSC Genome Browser [37]. Transcription factor (TF) binding information was downloaded from GTRD, a database of transcription factor binding sites generated from ChIP-seq data [38]. Bedtools intersect was used to identify the overlap between of TF binding sites and promoter regions [39]. The number of types of different TFs binding in a region was indicative of the TF diversity. The number and diversity of TFs represented the complexity of transcription regulation. GO enrichment analysis was performed using clusterProfiler [40] based on the background of all annotated genes.
RESULTS
MassiveQC detects outliers based on isolated forests using sample self-reporting
When processing a large-scale public sequencing data from SRA, it is essential to capture the data quality and technical experimental details [17]. The SRA stores metadata in addition to RNA-Seq reads. We found that SRA samples were sometimes mis-annotated, and more often, that important information was scattered across fields, databases and subsections of the underlying manuscripts. There was no central source for this information, which made it difficult for us to use a large amount of public data for analysis. Almost all quality control software considered only sequencing quality of the samples and did not address the above issues [18, 19]. Fortunately, many of the critical metadata affect the data and are thus self-reporting. Therefore, we developed a machine learning-based software, MassiveQC, that takes advantage of this self-reporting to (1) eliminate poor quality samples, samples collected for special purposes (e.g. 5′ or 3′ end analysis) and mis-annotated samples (e.g. DNA-seq labeled as RNA-seq) (Supplementary Figure S1) and (2) to separate a major type of sequencing samples of interest (RNA-seq) from a few other types of contaminated sequencing samples (e.g. ChIP-seq) using iForest [24].
To ensure the quality of the sequencing and to gain more information from their self-reporting, MassiveQC used a variety of methods to extract the features of sequencing samples (Figure 1). First, MassiveQC checked and filtered the reads in each FASTQ file after the download (Figure 1A) and integrated FastQ Screen [25] and Atropos [30] to detect contamination and trim adapters, respectively (Figure 1B). Meanwhile, the features of FASTQ were extracted from the results (‘FASTQ features’, Figure 1B and D). Then, the processed FASTQs with high quality were aligned to the reference genome using HISAT2 [41]. Picard and Bamtools were employed to extract alignment statistics, and count statistics were summarized from the featureCounts results (Figure 1C and D). Finally, MassiveQC obtained 21 features from each sample and used these features to build an RNA-Seq iForest model and to identify outliers among all samples (Figure 1E) (see Methods). Given that MassiveQC identifies outliers depending only on read features of samples provided by the users, it can be applied to any other species.
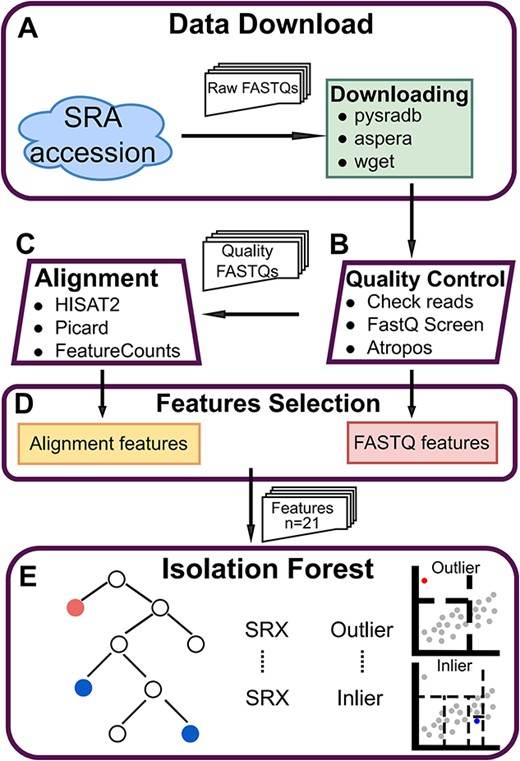
Overview of the MassiveQC. (A) Download: Use the pysradb package to search the download URL of the SRA accession, and use aspera or wget to download the raw FASTQs. (B) Quality Control.Check sequencing reads, detect FASTQ contamination and trim reads adapters with ‘FastQ Screen’ and ‘Atropos’. By the way, some FASTQ features are extracted from the result, like ‘libsize’ and ‘Reads that were too short’ (C) Alignment. Reads were mapped using Hisat2 and quantified with FeatureCounts. ‘bamtools’, ‘samtools’ and ‘picard’ are used to extract alignment features from bam files. (D) Features Selection. Organize the features of all samples and select the 21 most important features for downstream analysis. (E) Isolation Forest. An outlier detection model was trained using selected features from all samples.
Compared to other tools designed for data quality control, such as FastQC, RNA-SeQC2 and RNA-QC-chain, the advantages of MassiveQC are 1) it can integrate features from multiple dimensions (read, alignment and expression) to make the results more accurate; 2) it generates cutoffs based on the self-reporting of all samples, which is not affected by artificial factors and 3) isolated forests are robust to multi-modal distributions and are applicable to publicly available heterogeneous data (e.g. different tissues and developmental stages) (Table 1).
Comparison of quality control tools
| FastQC | fastp | RNA-SeQC2 | RNA-QC-chain | Qualimap2 | MassiveQC | |
|---|---|---|---|---|---|---|
| Read QC | Yes | Yes | Yes | Yes | Yes | Yes |
| Alignment QC | No | No | Yes | Yes | Yes | Yes |
| Expression QC | No | No | Yes | Yes | Yes | Yes |
| Identification method | No | No | No | No | No | iForest |
| Cutoff | Manual | Manual | Manual | Manual | Manual | Self-reporting |
To evaluate the performance of MassiveQC, we used the large RNA-Seq datasets with 952 runs in the SRA project SRP045429 as an example [42]. The median size of the runs is 346.4 Mb (Figure 2B) and the median running time is 11 minutes (Figure 2A). The above tasks were performed with 8 threads per run on a PBS cluster with 40 nodes whose CPU is Intel(R) Xeon(R) CPU E5-2690 v4. Each node has 256G running memory and 28 threads. Each sample was processed by 8 threads. We then collected 30 samples of other sequencing types as contaminating samples (Supplementary Table S1) to examine the accuracy of MassiveQC. We randomly added k samples (k = 5 to 30) from the 30 contaminating samples to the SRP045429 dataset and used MassiveQC to identify outliers. After 100 simulations, we calculated the mean probability that a contaminating sample was identified as an outlier. In all simulations, contaminating samples were identified as outliers (Figure 2C). In addition, we performed 100 simulations with n normal samples (n = 100 to 800) and 30 contaminated samples to evaluate the stability of the model in the samples of different sizes (Figure 2D). When samples of the target type accounted for more than 90% of the total samples, 99.8% of all contaminating samples would be identified as outliers.
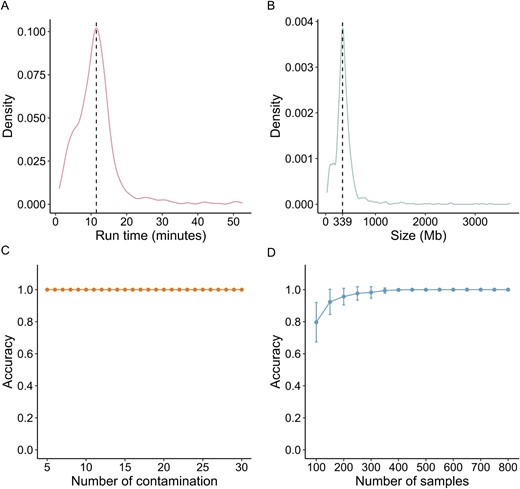
Performance of MassiveQC. The distribution of running time (A) and sample size (B) for 952 runs from GSE60314. (C) The average accuracy of outlier detection with k contaminated samples (k = 5 to 30). The accuracy is calculated by dividing the number of contaminated samples identified as outliers by the total number of contaminated samples. The y-axis represents the average accuracy of 100 simulations with different numbers of contaminated samples. (D) The average accuracy in different numbers of normal samples.
A pipeline for collection and filtration of RNA-seq data from SRA using MassiveQC
Next, we built a pipeline based on MassiveQC for integrating massive RNA-seq data to generate a comprehensive transcriptome atlas of D. melanogaster, by curating the SRA [43], the well-known global repository of raw sequencing data (Figure 3). In this pipeline, we first queried the SRA for ‘D. melanogaster’ [organism]’ and downloaded all associated metadata from the NCBI BioProject, BioSample, Gene Expression Omnibus (GEO) and PubMed repositories using SraMongo which we developed to store and organize SRA metadata (Figure 3A). As of March 2020, there were 62,927 D. melanogaster samples (Supplementary Figure S2). We individually downloaded and processed all 73,539 runs using MassiveQC, except for 107 runs that could not be downloaded and 4923 ABI Solid runs that we excluded to streamline downstream processing (Figure 3B). These results are available on GEO (this study, GSE117217) and the composite tracks are available on FlyBase (‘Oliver lab SRA Aggregated RNA-Seq’) [44].
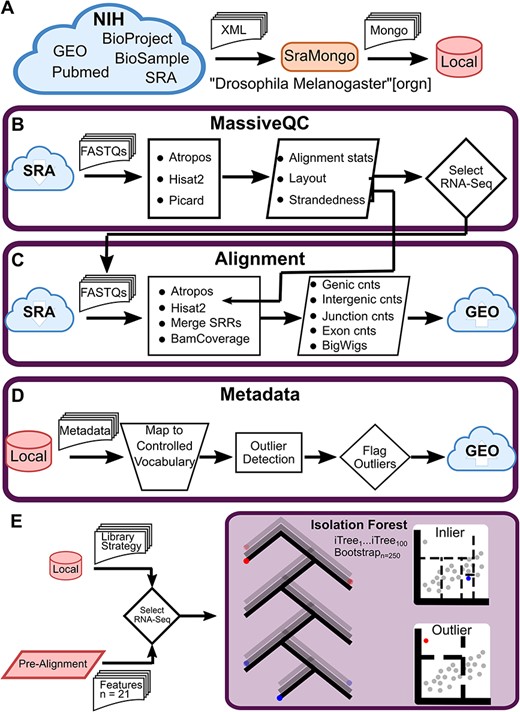
Curation of the Drosophila Sequence Read Archive (SRA). (A) Schematic of metadata download. SraMongo queries all D. melanogaster samples from the SRA and downloads all associated metadata from multiple NIH databases to a local MongoDB database. (B) Schematic of MassiveQC. This tool downloads FASTQs from the SRA and processes the files using a number of third-party tools. Generated data is used to select well-behaving RNA-Seq samples. (C) Schematic of the alignment workflow. This workflow processes selected RNA-Seq samples using third-party tools to align reads, merge technical replicates (SRRs), and generate final counts tables and coverage tracks. The resulting files are uploaded to the Gene Expression Omnibus (GEO). (D) Schematic of the metadata workflow. This workflow normalizes sample descriptions to a set of controlled vocabularies and uses gene expression to flag outlying samples. Updated metadata is uploaded to GEO. (E) Schematic of outlier detection using Isolation Forest. An outlier detection model was trained using samples annotated as RNA-Seq in the SRA (Library Strategy) and selected features from the pre-alignment workflow. Isolation Forest builds a set of decision trees while randomly selecting a subset of samples and features. Each decision (node or dashed line) splits the samples into various leaves. An inlier requires many splits to be isolated, while an outlier is isolated with few splits.
Then, we explored the marginal contributions of feature importance using Shapley values (Supplementary Figure S1C and D) [29] and found that the most important indicators of library mRNA quality were ‘% rRNA reads’ and ‘% alignment with transcripts’, and that metadata mis-annotation was indicated by ‘% mRNA’ and ‘Mid Gene Body Coverage’. To test the model, we mixed different proportions of samples from other library strategies [such as expressed sequence tags (EST) and whole genome sequencing (WGS)] (Supplementary Figure S1B) with RNA-Seq samples. Our data showed that WGS and ChIP-Seq libraries (DNA-Seq samples) were consistently identified as RNA-Seq outliers by iForest, confirming the ability of iForest to identify mis-annotations (Figure 3E). Using this method, we removed 875 RNA-Seq outliers (Supplementary Figure S1A). We also excluded libraries with low complexity (< 5 K expressed genes with fragments per kilobase of transcript per million mapped reads (FPKM) > 1) or low read depth (< 2 million mapped reads) (Supplementary Figure S3). As a result of these processes, we retained 12,049 high-quality RNA-seq samples for further analysis. After filtering, we used more detailed parameters to carry out the alignment workflow and generate experimental-level (SRX) deliverables including genomic feature counts and coverage tracks (BigWigs). In addition, we normalized metadata from SRA to facilitate downstream analysis. We identified and weighted keywords using NLTK [32] and manually aggregated them into 4 major attribute classes (sex, developmental stage, tissue and cell type) and mapped them to FlyBase-controlled vocabularies (Figure 3D). The metadata are also available at GEO (GSE117217).
Drosophila transcriptome atlas based on 12,049 high-quality public RNA-seq samples
A large collection of samples also facilitates the grouping of results by fly anatomy. We manually annotated the RNA samples by organ, developmental stage and sex using available metadata and explored the expression variation among samples to identify outliers. When parsed by organ anatomy (Figure 4A), we found 28 sources, with the two largest groups being whole body (n = 5225) and head (n = 2436, including the brain). We also parsed by five developmental stages, including egg, embryo, larva, pupa and adult. The adult stage has the largest sample size (n = 7835). Given that the technical biases among our data could confound biological outcomes [45], we applied the R package sva to remove batch effects between samples (Supplementary Figure S4). The large-scale dataset allows us to examine gene expression patterns in depth and systematically. We first examined the breadth of gene expression, defined as the frequency of samples in which a gene was expressed and revealed that 6455 (39.06%) genes were expressed (FPKM >1) in more than 50% samples (only protein-coding genes, lncRNAs and pseudogenes were considered, same below). For example, eukaryotic translation initiation factor 1A (eIF1A), required for mRNA translation [46], was expressed in almost all samples. Meanwhile, we found that 4559 (27.59%) genes were expressed in less than 10% samples (Supplementary Figure S5), suggesting their distinct gene expression spectrums. Another example was the olfactory receptors (ORs). The olfactory system of Drosophila contains 61 OR genes [47] and the saturation curve showed that the more head tissues, the higher the detection rates of OR genes, with Or43b detected in 93.44% of all head samples (2186) (Supplementary Figure S6).
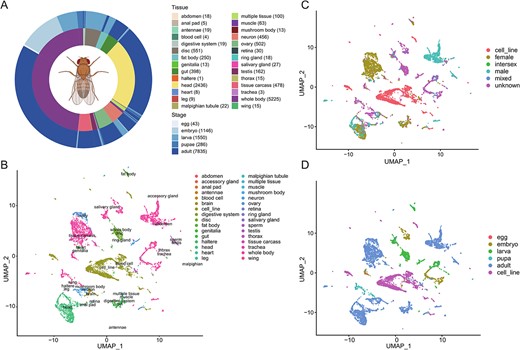
Overview of Drosophila transcriptome data. (A) Schematic overview of the dataset. The two-layer ring diagram shows the distribution of filtered samples across tissues (inner) and stages (outer), with sample sizes indicated in the legend. Due to the different sample contents, we manually merge different parts of the same organization and merge two similar organizations to facilitate analysis. It is worth noting that the brain is classified into the head, and the sperm and accessory glands are classified into the testes. (B–D) Uniform manifold approximation and projection (UMAP) of 12,049 samples colored by tissue (B), sex (C), and developmental stage (D).
It is not easy to visualize expression distances between 12 K samples. Therefore, we next subjected the samples to low-dimensional embedding and identified clusters [48]. The 2D Uniform Manifold Approximation and Projection (UMAP) plot showed that gene expressions of functionally relevant samples (organs, tissues or cells) were clustered together, for example, ovary and egg, as well as midgut and digestive system (Figure 4B), suggesting the common gene expression programs. Likewise, tissues were also grouped by developmental stage. Many adult samples were sexed and they clearly separated by sex in the UMAPs (Figure 4C and D), which was consistent with previous studies that sex dimorphism is fully manifested at the adult stage [3, 16, 49–51].
Dynamic pattern of gene expression
We further applied the two-dimensional uniform manifold approximation and projection (UMAP) implemented in Seurat to calculate the standardized variance of each expressed gene [48]. Among the 16,679 genes, roX2, a long non-coding RNA that is functionally redundant with roX1 and essential for the assembly of the dosage compensation complex [52, 53] exhibited the highest expression variance (Figure 5A). Consistently, the expression of roX2 was dynamic during development and was limited to a few tissues based on FlyBase expression data [50]. Furthermore, our observation was also consistent with a recent study that roX2 was the top male-biased specific gene at the single cell level [16], confirming our evaluation of gene expression dynamics. We also introduced another metric tau [54] to evaluate the expression specificity of genes and observed the strong consistency between gene expression dynamics and expression specificity (Spearman correlation, Rho = 0.77, P = 0) (Supplementary Figure S7). We then ranked all genes based on their expression variance and showed the expression pattern of the top dynamic genes (5%) and the bottom dynamic genes (also known as stably expressed genes) (5%). As expected, the most dynamically expressed genes were expressed in one or limited tissues (Figure 5B). For example, a set of genes was preferentially expressed in larval anal pad (box1) and another set of genes exhibited a higher expression level in the adult retina than in other tissues (box2). In contrast, the least dynamically expressed genes were found in a wide range of organs or tissues (Figure 5C).
![Expression variation of Drosophila genes. (A) Standardized variance and average expression level of each gene. Each point represents one gene. (B) Heatmap shows the expression pattern of dynamically expressed genes (C) Same as in (B) while stably expressed genes were used. (D) UMAP plots of the normalized expression of Lsm11 (FBgn0033450). (E) The t-distributed stochastic neighbor embedding (t-SNE) plots of the normalized expression of Lsm11 across fly tissues (Fly Cell Atlas data), which is generated by SCope (https://scope.aertslab.org/#/FlyCellAtlas). The annotation of tissues and cell types could be found in the article [16] (Figure 1G and Supplementary Figure S18). (F) UMAP plots of the normalized expression of eEF2 (FBgn0000559). (G) Same as in (E) with the gene eEF2 investigated.](https://oup.silverchair-cdn.com/oup/backfile/Content_public/Journal/bib/24/4/10.1093_bib_bbad177/2/m_bbad177f5.jpeg?Expires=1749148940&Signature=UlmKg7vj10A5Fs9tHDiGbweODU5kKH3-rGz9BV6kYBPAFaaLm9eAGH~fJOuYW-GJshwqFN98cUIB0YE62S9cGMqYsy4PWDNBkFft1wqA42HnoLcpkl0rEHxOL1EtPZv1QuWFfxulVWQaeM5EUt0tRVm4-h43sT~73Plnac~qRBPEU~bjxaf3hOILAa8RtIYwh6tMcxbXJM3GBpUJeJ4H2imUR0spglRxjYpgPAIVodez5Drn3kgkrPQv5pIFerG~GPMCHlCrhV6NM0VcRHqQmDH6uPODEtjGx3ClWc5lpE-ZOHefM0spxv4SleaVMNUVeYIDj7~iKkeielAWg13KkQ__&Key-Pair-Id=APKAIE5G5CRDK6RD3PGA)
Expression variation of Drosophila genes. (A) Standardized variance and average expression level of each gene. Each point represents one gene. (B) Heatmap shows the expression pattern of dynamically expressed genes (C) Same as in (B) while stably expressed genes were used. (D) UMAP plots of the normalized expression of Lsm11 (FBgn0033450). (E) The t-distributed stochastic neighbor embedding (t-SNE) plots of the normalized expression of Lsm11 across fly tissues (Fly Cell Atlas data), which is generated by SCope (https://scope.aertslab.org/#/FlyCellAtlas). The annotation of tissues and cell types could be found in the article [16] (Figure 1G and Supplementary Figure S18). (F) UMAP plots of the normalized expression of eEF2 (FBgn0000559). (G) Same as in (E) with the gene eEF2 investigated.
For an intuitive understanding of their distinct expression dynamics, we displayed the expression profile of Lsm11, which was unevenly distributed in the ovary samples and expressed at the adult stage (Figure 5D). We also confirmed and extended these observations using single cell data from Fly Cell Atlas [16]. Once again, and congruently, Lsm11 was found to be expressed in cells of fat body and ovary (Figure 5E). Interestingly, when we further examined the expression pattern of Lsm11 in different cell types of ovary, we observed that it was preferentially expressed in young germ cell, 16-cell germline cyst in germarium region and oviduct (Supplementary Figure S8A), showing remarkable expression dynamics at single-cell resolution.
However, eukaryotic translation elongation factor 2 (eEF2) was widely expressed in nearly all samples (12,041 out of 12,049) (Figure 5F). Similarly, its expression profile at the single-cell level recapitulated the above observation (Figure 5G). We also showed the expression pattern of eEF2 in different cell types of ovary and found that it was expressed in the majority of cells (Supplementary Figure S8B). Considering that the ubiquitously expressed genes are associated with frequent protein-DNA-binding events [55], we further examined whether these genes were involved in complex expression regulation.
Regulation of genes with different expression dynamics
Gene expression in organism is modulated by spatial–temporally dynamic regulatory programs [56]. To further reveal whether the genes with dynamic expression have distinct evolutionary and regulatory patterns, we first investigated the association of gene types with expression dynamics at the basic level of encoded gene product. We observed that protein-coding genes exhibited the lowest expression variation, followed by lncRNAs and pseudogenes (based on FlyBase annotation) (Wilcoxon test) (Figure 6A), consistent with previous reports that lncRNAs and pseudogenes are expressed in a highly tissue- or condition-specific manner [57]. We also looked for correlations with the time when a gene first arose in the lineage. Interestingly, the origination time of genes (gene age) was negatively correlated with its expression dynamics (Spearman correlation, Rho = −0.43, P = 0), with younger genes displaying higher expression variation (Figure 6B, Supplementary Figure S9). Previous studies have shown that young genes tend to have a testis-specific expression and subsequently acquire broader expression (Supplementary Figure S10) [34, 58]. Our work showed that this gradual repurposing of genes is a general trend.
![Relationships between expression dynamics and evolutionary constraints and regulations. (A) Expression variation of protein-coding gene, lncRNA, and pseudogene. Pseudogene is based on flybase annotation. Wilcoxon test is used to evaluate the statistical significance. (B) Relationship between gene expression dynamics and their ages (origination times). The age of a gene is negatively correlated with its expression dynamics. Myr, million years. The evolutionary age of genes was retrieved from GenOrigin, a comprehensive protein-coding gene origination database [34]. (C) Genes expressed later during development show expression dynamics at significantly higher values than those expressed early. (D) Expression dynamics of the transcriptome across organs. Higher values indicate higher dynamics of expressed genes. (E) Relationship between gene expression dynamics and transcription factor (TF)-binding sites. TF-binding sites are defined as the number of binding sites overlapping the promoters of each gene. (F) Relationship between gene expression dynamics and number of RNA binding protein (RBP).](https://oup.silverchair-cdn.com/oup/backfile/Content_public/Journal/bib/24/4/10.1093_bib_bbad177/2/m_bbad177f6.jpeg?Expires=1749148940&Signature=wS0g8MhBckvMlrkfu8RJQEMwT2iiy~6z4PUVRZ1~VO0ZzC03QXJ9X8o5-7s1JzNn8DAPt9saB419FzdHXLScRA0T~~Guup1-uf1RyQZ2IXl3b2u2d8Uij4D5ImUDBKnnEvbgOHgWG~ZtmuZ2J7Xf5EoDTOqNqhH8RMYagVFJhN0y8fPa7~2MMz76KjrBuLorX~sa1PVQram9gCuBzgY74QI9eQJJdeKgnV1Ci7WFapQJT3sO4dckuMv1CsAyW9kmhVRF8zZ4EVd90uijtyw6srEfJOx~bbJ2L4zxfeI~deWL7TU18VzeaLJcZOjOO5P5s9paYWSLZQe72xgNS2sqDA__&Key-Pair-Id=APKAIE5G5CRDK6RD3PGA)
Relationships between expression dynamics and evolutionary constraints and regulations. (A) Expression variation of protein-coding gene, lncRNA, and pseudogene. Pseudogene is based on flybase annotation. Wilcoxon test is used to evaluate the statistical significance. (B) Relationship between gene expression dynamics and their ages (origination times). The age of a gene is negatively correlated with its expression dynamics. Myr, million years. The evolutionary age of genes was retrieved from GenOrigin, a comprehensive protein-coding gene origination database [34]. (C) Genes expressed later during development show expression dynamics at significantly higher values than those expressed early. (D) Expression dynamics of the transcriptome across organs. Higher values indicate higher dynamics of expressed genes. (E) Relationship between gene expression dynamics and transcription factor (TF)-binding sites. TF-binding sites are defined as the number of binding sites overlapping the promoters of each gene. (F) Relationship between gene expression dynamics and number of RNA binding protein (RBP).
We next surveyed the forces governing the evolution of Drosophila genes at the protein level. First, we examined the evidence of selection on dynamically expressed genes using dN/dS value, which was defined as the ratio of the rates of nonsynonymous and synonymous codon substitutions, with high values (> 1) indicating positive selection and low values indicating purifying selection [59]. The expression dynamics were positively correlated with selection strength and relatively stably expressed (or widely expressed) genes were enriched for signatures of purifying selection (Supplementary Figure S11), suggesting that purifying selection might constrain the dynamics of gene expression.
While adult phenotypes are entirely dependent on the successful completion of increasingly complex gene expression patterns during development, it is thought that pathways evolve in reverse. In other words that as long as the final phenotype is achieved, it is possible to exchange mechanisms for initiating development [60]. If this is applicable to gene expression, then we might expect to see more variance in early developmental stages. Surprisingly, we discovered that late expressed genes showed higher expression variation than early-expressed genes (Figure 6C). This suggested that even if early development was evolutionarily fungible, there was tight regulation at micro-timescales. The overall trend was linear, but showed two peaks at adult 14-day and 24-day ages. This result might be explained by the mutation accumulation theory of aging, where the force of purifying selection decreases with age, as proposed by Sir Peter Medawar [61]. Moreover, the genes expressed in testis showed significantly larger expression variations than those in other organs (Figure 6D), the pattern might result from rapid gene evolution in testis and pervasively accessible chromatin allowing extensive transcription [56, 62]. We also observed that genes expressed in the ovary were much less dynamic than those in other tissues, which might because genes important for Drosophila ovarian function are highly conserved during evolution [63], suggesting that these genes might also be expressed in other tissues and be pleiotropic. Collectively, these observations (Figure 6B–D) provided a link between gene expression patterns in an extant species and the molecular evolution and life history theory of the lineage (Medawar’s hypothesis).
To evaluate whether our observations of the associations between expression dynamics and evolutionary constraints could be extended to regulatory programs, we examined the sequence conservation in promoter regions which governed the transcription initiation and gene activity [64]. Expectedly, the promoters of genes with higher expression dynamics were significantly, albeit slightly, less evolutionarily conserved (Supplementary Figure S12). Interestingly, we also found that the promoters of genes with lower expression dynamics harbored more TF-binding sites and higher diversity of TFs (Figure 6E, Supplementary Figure S13) (Spearman correlation, Rho = −0.53, P = 0). These results were reminiscent of high-occupancy target (HOT) regions, defined as the segments that were bound by high amount of TFs, and genes related to HOT regions were stably expressed [55, 65], with their expression variability resembling that of housekeeping genes [66]. Additionally, the transcripts derived from less dynamically expressed genes were bound by more RNA-binding proteins (RBPs) than those from highly dynamically expressed genes (Figure 6F, Supplementary Figure S14). These data indicated a stronger and more complex transcriptional and post-transcriptional regulation of these less dynamic genes. Given the diverse expression patterns, genes that need to be expressed widely require more TF-binding sites to ensure that they could be expressed in essentially all cell types. If the levels of proteins encoded by these genes were also in a narrow tolerance range, then they might be more subject to translational control by RBPs.
Function and phenotypic essentiality of genes with different expression dynamics
Evolutionary constraints and regulatory complexity are strong predictors of functional importance. To extend this inference, we hypothesized that the dynamically expressed genes might perform lineage-specific functions while the less dynamically expressed genes might be associated with the maintenance of basic cellular functions (acting as ‘housekeeping genes’). Considering the different functional paradigms between protein-coding genes and lncRNAs [57], we first focus on protein-coding genes. In support of our notion, the dynamically expressed genes were significantly enriched in developmental process, immune response and neuropeptide signaling pathway gene ontology terms (Figure 7A), while the less dynamically expressed genes were enriched in protein phosphorylation, cell junction organization and GTPase-mediated signal transduction terms (Figure 7B), indicating the different functional categories of these two types of genes.
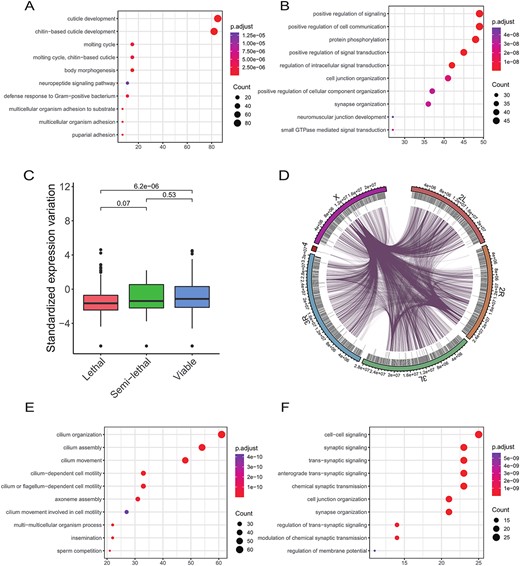
Gene ontology (GO) enrichment analysis. (A) Enriched biological processes of highly dynamically expressed protein-coding genes. Top 5% of all dynamic protein-coding genes are used for analysis. (B) Enriched biological processes of less dynamically expressed protein-coding genes. Bottom 5% of all dynamic protein-coding genes are used for analysis. (C) Expression dynamics of genes with different phenotypic severity. (D) Circos plot showing genome-wide lncRNA–protein-coding gene contacts based on expression correlation. The first track (shown by coding) indicates protein-coding genes, and second track (shown by pseudo) represents lncRNAs. (E) Enriched biological processes of protein-coding genes with significantly high expression correlation with highly dynamically expressed lncRNAs. Top 5% dynamic lncRNAs is user for analysis. (F) Same as in E, bottom 5% dynamic lncRNAs used.
To further assess whether the less dynamically expressed genes were required for housekeeping functions (i.e. are essential), we assigned genes to different classes of phenotypic severity based on a public large-scale transgenic short-guide RNA library that enabled efficient disruption of specific target genes [67]. We compared the degree of expression variation for genes in these different classes and revealed a clear association between expression dynamics and the severity of phenotypes when those genes were disrupted (Figure 7C). For example, genes required for lethality showed the lowest expression dynamics. Using another dataset of essential genes predicted by a machine learning algorithm [68], we found that essential genes were enriched for less dynamically expressed genes (Supplementary Figure S15). Collectively, our data reinforced and extended the idea that genes with less dynamic expression have important, conserved functions in Drosophila.
Considering our relatively poor understanding of specific lncRNA functions, it is difficult to compare expression dynamics with functional importance. To get around the poor functional annotation, we borrowed functional information from protein-coding genes based on a previous method [69], by constructing a co-expression network between protein-coding genes and lncRNAs. We used this functional relationship to infer lncRNA functions. With P < 0.01 and absolute Pearson correlation coefficient R > 0.65, a total of 21,613 co-expression pairs were identified between 2383 coding genes and 89 lncRNAs (Figure 7D). Protein-coding genes significantly correlated with dynamically expressed lncRNAs were involved in specific differentiation, such as the sperm-associated functions of spermatid development and differentiation (Figure 7E), while protein-coding genes correlated with stably expressed lncRNAs were involved in basic biological processes, such as cell–cell signaling and cell junction assembly (Figure 7F). These observations on protein-coding genes and lncRNAs indicated that expression dynamics and functional categories were intertwined in these gene pairs.
Conservation and divergence of gene content and expression profile between Drosophila and human
As a premier model species, Drosophila is routinely used to elucidate the progress and underlying molecular mechanisms of human development and diseases [4, 70–73], under two assumptions: 1) a large fraction of human genes, especially disease-associated genes, have counterparts in the Drosophila genome; 2) the genetic regulatory programs are largely conserved between the two. However, how these two assumptions interact has not been systematically characterized. For example, approximately ranging from 65% to 77% of human disease genes have orthologs in Drosophila [71, 74], but how these genes are regulated in the two species is underexplored. Our dataset provided important genome-wide information on the transcriptional regulation of orthologs.
To this end, we classified human genes into different categories based on their phenotypic severity by integrating a dataset of essential genes [75] with a dataset of disease-associated genes [76]. This analysis obtained 2460 vital genes, 1145 vital and disease-suppressing genes, 3150 disease-suppressing genes and 10,463 other genes, with gradually decreasing severity of loss-of-function phenotypes. We matched these with 20,400 ortholog pairs between human (9223 genes) and Drosophila (6937 genes) using Ensembl Compara [77]. Interestingly, we observed a clear and significant association between orthology in Drosophila and phenotypic severity in human loss-of-function (Figure 8A). Specifically, 68.5% of human vital genes were conserved in the Drosophila genome, followed by vital and disease-suppressing genes (65.33%), disease-suppressing genes (49.3%) and other genes (42.34%), suggesting that functionally important genes have been conserved by evolutionary forces. The utility of Drosophila is partly due to the lower number of paralogs, but we also discovered that 40.57% of human vital genes had a one-to-one (1:1) orthology in Drosophila, significantly higher than genes in other three phenotypic groups. Overall, these analyses illustrated that the vital or disease-suppressing genes in human ‘obey’ strict 1:1 orthology relationships, suggesting that most of them could be investigated in Drosophila avatars.
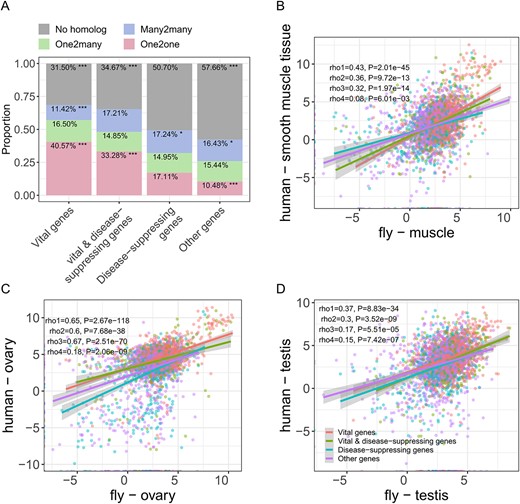
Expression dynamics of orthologs between human and Drosophila. (A) Proportion of human genes in each type that have homologs in Drosophila. One2one represents that the human genes in the pair have only one ortholog in Drosophila (1:1 orthologous relationship). One2many, 1:m orthologous relationship (m ≥ 2). Many2many, m:m orthologous relationship (m ≥ 2). No homolog, human genes that do not have orthologs in Drosophila. Fisher’s exact test, *P < 0.05; **P < 0.01; ***P < 0.001. Expression correlation of human genes and Drosophila orthologs in muscle (B), ovary (C), testis (D). The correlation coefficients of vital genes, vital and disease-suppressing genes, disease-suppressing genes, and other genes are represented by rho1, rho2, rho3, and rho4, respectively. 1:1 orthologs are used in this analysis.
Much of the knowledge of the genetic programs underlying human biology was first discovered in model organisms like rhesus macaque, mouse and Drosophila. Although the expression conservation between human and mammalian models has been elucidated [78], such analyses on human genes and Drosophila orthologs are understudied. Therefore, we evaluated the expression conservation and dynamics of 1:1 orthologs in 9 matched tissues (Figure 8B–D, Supplementary Figure S16) and found that the expression correlations ranged from 0.08 to 0.67 (Spearman correlation coefficient), with the lowest value in muscle (Figure 8B) and the highest value in ovary (Figure 8C), suggesting the high conservation of gene expression in ovary over hundreds of millions of years of divergence. Interestingly, the general linear relationship did not depend on gene category, but when looking closely, we found that the vital genes exhibited the highest expression conservation than other types of genes in 6 of the tissues, with the highest value of 0.65 in ovary, while the other genes exhibited the lowest conservation in 7 tissues, with the lowest value of 0.08 in muscle. We also found that the expression similarity of genes expressed in testis was considerably lower than other tissues, especially for disease-suppressing and other human genes (Figure 8D). These observations strongly suggested that the clinical phenotypes of human vital and vital and disease-suppressing genes were more likely to be recapitulated by the Drosophila model. For example, the high expression conservation and low expression variability of human Drosophila ortholog pairs in ovaries made them an ideal organ for translating disease etiology research between human and Drosophila.
DISCUSSION
The scientific community generates enormous amounts of sequence data. The journals have done a good job of insisting that these data find a home in accessible data repositories. However, these data are not reused optimally due to the lack of interoperability inherent in the metadata structure. It is crucial to ensure the data quality when integrating large-scale public sequencing data. However, current quality control software does not provide appropriate criteria for users to screen samples. Moreover, these methods do not consider the heterogeneity in public data and are not applicable to data with multi-modal distribution. To this aim, we developed a tool called MassiveQC based on Isolation Forest to perform quality control and outlier detection on large amounts of public data. It could automatically identify outliers based on the self-reporting of all samples and is suitable for data with multi-modal pattern. To highlight its value, we downloaded and filtered all Drosophila RNA-seq data from NCBI SRA using MassiveQC and developed SraMongo to automatically parse the sample information. Our work finally generated 12 K high-quality quality-controlled RNA-seq samples, with several orders of magnitude larger than previous Drosophila genomics studies. This general approach is species agnostic and could be applied to other species and should be amenable to automation. Such database implementations would be a major functional advance in support of the FAIR policy.
The unprecedented breadth and depth allowed systematic characterization of gene expression dynamics and associations. We observed that highly dynamic genes were enriched for signatures of relaxed selective constraint and tended to be expressed at late stages, whereas less dynamic genes were more likely to be under purifying selection and expressed at early stages, suggesting their different functional categories. Genes with less dynamic expression might have a broad expression spectrum and might perform fundamental and vital functions. These ‘housekeeping’ genes, therefore, were of great importance in defining a basal genome required for basic cell function and served as a reference of gene expression in computational and experimental biology (i.e. normalization for RT-qPCR data) [79–81]. While the housekeeping genes in human and mouse have been identified by mining large-scale RNA-seq datasets [66], a consensus list in Drosophila still remains to be defined and the less dynamic genes among the 12 K samples (combining tau value) might be a potential candidate for further validation. Lists of candidate ‘housekeeping’ genes are almost exclusively protein coding. Consistent with prior studies of lncRNAs with tight spatiotemporal specificity [82] and functions [69], we found only a few lncRNAs with less dynamic expression. However, there were some. For example, among the top 200 ‘housekeeping’ genes in our data, one lncRNA, CR46268, was found to be widely expressed in 11,626 samples (96.5%) (FPKM > 0.1), and its top 10 co-expressed protein-coding genes were associated with protein processing and modification. Our data resource could also be used to identify specifically expressed genes in different tissues or at different developmental stages using some tools (e.g. SEGtool [83]).
Gene regulation is extremely useful in comparative genomics and is essential for determining whether Drosophila will be a good human disease model for a particular case. Our meta-analysis of Drosophila gene expression connected to human gene expression and phenotypes provides a direct, easy-to-use window for exploring cross-species comparisons.
In summary, our study has for the first time examined Drosophila gene expression dynamics across organs, developmental stages and sexes by integrating the large-scale transcriptome data and systematically characterized the association of expression dynamics with functional categories, regulatory complexity, evolutionary properties and applicability to human biology. As that the Drosophila has been successfully used as a leading model organism in fundamental biological research, we anticipate that our observations on the expression dynamics are also applicable to other species in general. Our data and the software (MassiveQC and SraMongo), along with the accompanying online resource (http://flybase.org/jbrowse/?data=data/json/dmel, ‘Oliver lab SRA Aggregated RNA-Seq’), which allows the gene expression dynamics to be investigated in an interactive manner, will facilitate the disentangling of the underlying mechanisms in the future.
We developed a novel software, MassiveQC, based on an unsupervised machine learning algorithm (Isolation Forest), to perform quality control and detect outliers from large amounts of public data using their self-reporting.
We applied MassiveQC to collect and filter 62,927 Drosophila RNA-seq samples from Sequence Read Archive (SRA), resulting in a comprehensive transcriptome of 12 K high-quality samples across organ, developmental stage and sex.
We systematically characterized fly gene expression dynamics and its associations with function, regulation, evolution patterns and applicability in human biology.
ACKNOWLEDGEMENTS
B.O. and Z.C. conceived and designed the project; B.O. and J.F. acquired the data; S.Q., M.S., D.W. and J.F. performed data analysis and wrote the manuscript with the input from B.O. and Z.C.; L.C., Y.T., H.L., Y.Z., S.Z. and S.Y. provided helpful comments on the manuscript.
FUNDING
The science and technology major program of Hubei Province (2021ABA011); Foundation of Hubei Hongshan Laboratory (2021hszd012 and 2022hszd024); HZAU-AGIS Cooperation Fund (SZYJY2021010).
DATA AVAILABILITY STATEMENT
All raw and processed RNA-seq data generated in this study have been submitted to the NCBI Gene Expression Omnibus (GEO; https://www.ncbi.nlm.nih.gov/geo/) under accession number GSE117217. The composite tracks are available on FlyBase (http://flybase.org/jbrowse/?data=data/json/dmel, ‘Oliver lab SRA Aggregated RNA-seq track’). The python package SraMongo and MassiveQC has been deposited in github (https://github.com/jfear/sramongo and https://github.com/shimw6828/MassiveQC) and figshare (https://figshare.com/articles/software/MassiveQC/21674198). The computer codes for the workflows of transcriptome atlas of Drosophila melanogster have been deposited in github (https://github.com/jfear/ncbi_remap).
Author Biographies
Sheng Hu Qian is currently a PhD candidate at Hubei Key Laboratory of Agricultural Bioinformatics, College of Life Science and Technology and College of Biomedicine and Health, Huazhong Agricultural University, China.
Meng-Wei Shi is currently a PhD candidate at Hubei Key Laboratory of Agricultural Bioinformatics, College of Life Science and Technology and College of Biomedicine and Health, Huazhong Agricultural University, China.
Dan-Yang Wang is currently a PhD candidate at Hubei Key Laboratory of Agricultural Bioinformatics, College of Life Science and Technology and College of Biomedicine and Health, Huazhong Agricultural University, China.
Justin M. Fear is a postdoc researcher at Section of Developmental Genomics, National Institute of Diabetes and Kidney and Digestive Diseases, National Institutes of Health, Bethesda, USA.
Lu Chen is a postdoc researcher at Hubei Key Laboratory of Agricultural Bioinformatics, College of Life Science and Technology and College of Biomedicine and Health, Huazhong Agricultural University, China.
Yi-Xuan Tu is currently a PhD candidate at Hubei Key Laboratory of Agricultural Bioinformatics, College of Life Science and Technology and College of Biomedicine and Health, Huazhong Agricultural University, China.
Hong-Shan Liu is a master’s graduate at Hubei Key Laboratory of Agricultural Bioinformatics, College of Life Science and Technology and College of Biomedicine and Health, Huazhong Agricultural University, China.
Yuan Zhang is a master’s graduate at Hubei Key Laboratory of Agricultural Bioinformatics, College of Life Science and Technology and College of Biomedicine and Health, Huazhong Agricultural University, China.
Shuai-Jie Zhang is a master’s graduate at Hubei Key Laboratory of Agricultural Bioinformatics, College of Life Science and Technology and College of Biomedicine and Health, Huazhong Agricultural University, China.
Shan-Shan Yu is a master’s graduate at Hubei Key Laboratory of Agricultural Bioinformatics, College of Life Science and Technology and College of Biomedicine and Health, Huazhong Agricultural University, China.
Brian Oliver is a professor of Section of Developmental Genomics, National Institute of Diabetes and Kidney and Digestive Diseases, National Institutes of Health, Bethesda, USA.
Zhen-Xia Chen is a professor of Hubei Hongshan Laboratory, Hubei Key Laboratory of Agricultural Bioinformatics, College of Life Science and Technology, College of Biomedicine and Health, Interdisciplinary Sciences Institute, Huazhong Agricultural University, Wuhan 430070, China; Shenzhen Institute of Nutrition and Health, Huazhong Agricultural University, Shenzhen 518000, China; Shenzhen Branch, Guangdong Laboratory for Lingnan Modern Agriculture, Genome Analysis Laboratory of the Ministry of Agriculture, Agricultural Genomics Institute at Shenzhen, Chinese Academy of Agricultural Sciences, Shenzhen 518,000, China. Her research group has been working in evolutionary and developmental genomics.
REFERENCES
Author notes
Sheng Hu Qian, Meng-Wei Shi, Dan-Yang Wang and Justin M. Fear contributed equally to this work.
