


Abstract
Metagenomic next-generation sequencing (mNGS) enables comprehensive pathogen detection and has become increasingly popular in clinical diagnosis. The distinct pathogenic traits between strains require mNGS to achieve a strain-level resolution, but an equivocal concept of ‘strain’ as well as the low pathogen loads in most clinical specimens hinders such strain awareness. Here we introduce a metagenomic intra-species typing (MIST) tool (https://github.com/pandafengye/MIST), which hierarchically organizes reference genomes based on average nucleotide identity (ANI) and performs maximum likelihood estimation to infer the strain-level compositional abundance. In silico analysis using synthetic datasets showed that MIST accurately predicted the strain composition at a 99.9% average nucleotide identity (ANI) resolution with a merely 0.001× sequencing depth. When applying MIST on 359 culture-positive and 359 culture-negative real-world specimens of infected body fluids, we found the presence of multiple-strain reached considerable frequencies (30.39%–93.22%), which were otherwise underestimated by current diagnostic techniques due to their limited resolution. Several high-risk clones were identified to be prevalent across samples, including Acinetobacter baumannii sequence type (ST)208/ST195, Staphylococcus aureus ST22/ST398 and Klebsiella pneumoniae ST11/ST15, indicating potential outbreak events occurring in the clinical settings. Interestingly, contaminations caused by the engineered Escherichia coli strain K-12 and BL21 throughout the mNGS datasets were also identified by MIST instead of the statistical decontamination approach. Our study systemically characterized the infected body fluids at the strain level for the first time. Extension of mNGS testing to the strain level can greatly benefit clinical diagnosis of bacterial infections, including the identification of multi-strain infection, decontamination and infection control surveillance.
Background
Bacterial infections remain a significant health threat to humans. To date, culture is the most commonly used diagnostic method in clinical practice, but its low detection ability, especially for fastidious organisms or for certain sample types, makes precision diagnosis and clinical decision-making challenging [1]. As an emerging technique for pathogen detection and monitoring [2–4], metagenomic next-generation sequencing (mNGS) provides a comprehensive and unbiased overview of microbes in complicated clinical specimens [5, 6]. Without culture and isolation, mNGS directly captures all nucleic acids in a sample and performs whole-genome sequencing (WGS) with high-throughput sequencing technologies. Due to cost-effectiveness, short-read sequencing has been dominating mNGS; but long-read sequencing has also appeared in this field, with its unique advantages in providing real-time, long-read data with highly portable devices [7].
Despite the continuous advancement in sequencing technologies and bioinformatics tools, the interpretation of mNGS data, or rather pathogen identification, remains at the genus or species level and meanwhile ignores the strain specificity [8]. Critically, such strain awareness is imperative due to the distinct strain-specific traits, including antimicrobial resistance and virulence potentials. One prominent example is Escherichia coli: most strains are commensal, while a few of them, such as E. coli O157:H7 and O104:H4, are extremely pathogenic [9]. Multiple-strain infections have been known to reach considerable frequencies (6.1%–52.9%) by a variety of human pathogens [10, 11]. Due to the technical limitations, the standard culture-based techniques can hardly reflect the real bacterial composition, e.g. ignoring the non-culturable strains or strains of lower abundance. In case the strains possess high virulence or antimicrobial resistance, patients are accordingly at a higher risk of treatment failure [12, 13]. In addition, the strain-level diagnosis also benefits for source tracking of bacterial infectious diseases [14]. The establishment of transmission links relies on the determination of clonal relationships among bacterial isolates. To serve this, pulsed-field gel electrophoresis was once the gold-standard molecular fingerprinting technique, and in the recent decade WGS, yet both of which require isolation of a pure culture [15]. If the interpretation of mNGS data achieves the strain level, their results, including those from culture-negative samples, can be directly used for epidemiological investigations of bacterial infectious diseases.
In contrast to the traditional typing approaches such as biochemical identification and the sequencing of the 16S rRNA genes, which often reach the genus and species level, acquisition of the entire genome sequences of pathogens allows mNGS to have the potential of resolving strain-level heterogeneities. To date, a few bioinformatics tools have been developed to resolve metagenomics datasets at the strain level and show reasonable performance, most of which, however, is dedicated to the gut or environmental microbiomes with high bacterial loads [16–22]. Clinical samples such as blood, cerebrospinal fluid and ascites are usually thought of as sterile. Hence, mNGS is a needle-in-a-haystack endeavor, as only a small proportion (typically 0.001%–1%) of reads may correspond to potential pathogens [5], which fails to be supported by currently available software working on strain-level typing.
Lack of a clear definition of the concept of ‘strain’ is another concern that is usually neglected by most currently available tools for strain-level typing [23]. Various factors contribute to this challenge, including the rapidity of microbial evolution, the plasticity of microbial genomes, the technical difficulty in differentiating between microbial taxa, and the natural history of microbial systematics and terminology [24]. This ambiguity has led to the fact that genomes differing by 0.01–5% nucleotide identity can all be defined as different strains, which inevitably creates difficulties and misunderstandings when mNGS is employed in practical clinical application. Take E. coli for an example, the diverse genetic structure of this species has permitted the phylogenetic separation of human strains into at least seven main phylogroups, which can be further divided into dozens of clonal complexes (CCs) and hundreds of sequence types (STs) by the multi-locus sequence typing (MLST) scheme [25, 26]. While phylogroups and CC levels can define the pathogenic potential, STs or taxons of lower rank are required for effective outbreak detection and epidemiological surveillance. Obviously, a finer resolution requires a higher sequencing depth. Thus, it is imperative to prepare a hierarchical reference genome database that provides a reliable typing result at an appropriate taxonomic level according to the available sequencing depth. StrainEst is the only existing tool that prepares its reference database in this hierarchical manner [27]; but it is based on a single nucleotide variation (SNV)-calling algorithm, which requires sufficiently deep depth (typically 10× or more) and is not amenable to clinical mNGS.
Here we present a metagenomic intra-species typing (MIST) tool, which is specifically designed to address the above-mentioned challenges in strain-level pathogen identification. By using this tool, the infected body fluids were, for the first time, characterized at the strain level on a large-scale clinical specimens. Strain-level typing shows significant potential in identifying multi-strain infection, contamination and outbreaks, and therefore necessitates the need for strain typing in clinical diagnosis.
Results
Hierarchical design of MIST using E. coli genomes as an example
The workflow of MIST is shown in Figure 1. For species-level typing, MIST relies simply on the counts of reads that are specifically aligned to the pan-genomes of each pathogen species. Next, for strain-level typing, MIST starts with preparing a hierarchical database of reference genomes based on ANI clustering. By aligning reads to all reference genomes of the species, scores for each alignment are converted to posterior probabilities that represent the likelihood of the read being assigned to each cluster. Finally, the probability matrix was used to estimate the abundance of each cluster by the maximum likelihood estimation (MLE) algorithm.
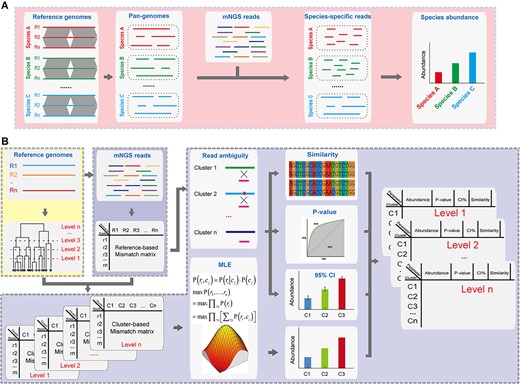
Schematic of the MIST package. (A) Species-level typing. MIST maps the mNGS reads against the pan-genomes of each species and counts the species-specific reads for estimation of species abundance. (B) Strain-level typing. MIST starts by mapping the mNGS reads against all reference genomes. The mismatch information extracted from the SAM files is then converted to the probability of each read derived from each reference genome. This reads-based probability matrix is compressed into a cluster-based matrix according to the clustering results of the reference genomes. MLE is then imposed upon the matrix to infer the most likely abundances of each cluster in the mNGS dataset. Next, read ambiguity is used to quantify the abundance uncertainty along with the similarity of the sample’s components to reference genomes. Finally, all results are integrated and presented in a hierarchical manner. The module ‘Species’ is highlighted by the red box, the module ‘Index’ and ‘Cluster’ by the yellow box, and the module ‘Strain’ by the purple box.
As MIST hierarchically organizes the reference genomes, we first proved the feasibility of its concept in E. coli since this species, as a model organism, has been most extensively studied in epidemiology, phylogeny and pathogenesis. A total of 718 complete genomes of E. coli were available in NCBI GenBank at the time of the analysis (Supplementary Table S1 available online at https://dbpia.nl.go.kr/bib). Whole-genome ANI was calculated to estimate the genetic relatedness between the pairwise genomes (Figure 2A), which ranged from 95% to 100% (Figure 2B). Agglomerative hierarchical clustering then produced 10, 57, 363 and 588 clusters with a 98%, 99%, 99.9% and 99.99% ANI threshold, respectively. These clustering results showed a good agreement with those performed by the previous typing approaches: the 98% level corresponded to the phylogroup, the 99% level to the MLST CC, and 99.9% to the MLST ST.

Genetic relatedness of the 718 E. coli reference genomes. (A) A neighbor-joining dendrogram was constructed based on pairwise ANI. The rings from inner to outer levels represent: first, clustering results based on 98% ANI; second, phylogroups; third, clustering results based on 99% ANI; and fourth, MLST clonal complexes. (B) The histogram of pairwise ANI values between the 718 E. coli genomes. (C) Relationship between ANI and similarity of genomic content; the latter refers to the ratio of shared genomic regions to the entire genome size. The blue, red and black lines represent 75% percentile, median and 25% percentile of genomic content similarities.
In terms of genomic content, pairwise conserved regions accounted for 75–100% of the whole-genome size (Figure 2C). ANI and the similarity of genomic content revealed a nearly exponential relationship: at the 99% ANI level, only 90% of the genomic content was shared between the strains; but the genomic content was nearly identical when ANI reached 99.9% or higher.
Performance evaluation in simulated mNGS data
The performance of MIST was validated using in silico simulated reads of known composition and was benchmarked against StrainEst. Because the infection-associated microbiota is often a complex mixture of closely related strains of the same species, the E. coli strain K-12 was mixed with the strains DH1, UMNK88, IAI1 and UMN026 (Figure 3A). Since K-12 showed gradient genetic distances to the other four strains, the mixtures of these strains provided a good model to test the limit of the distinguishing capability. A series of reads with 0.001× −1× sequencing depth was simulated to test the limit of detection.
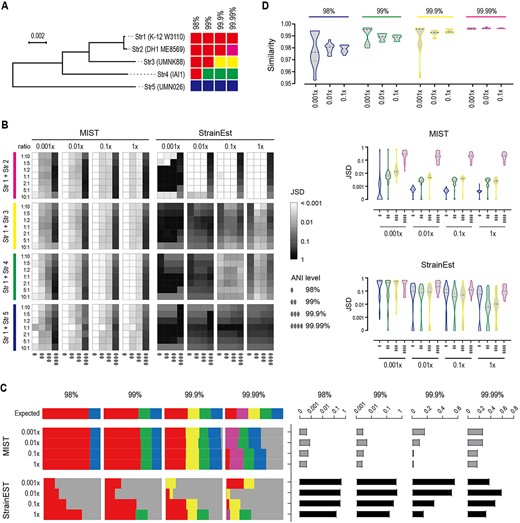
Performance evaluation using synthetic mNGS datasets. The efficacy of MIST is benchmarked against StrainEst. (A) Phylogenetic relationship between the five tested E. coli strains. They were str1 (K-12 substrain W3110, accession no. CP017979), str2 (DH1 ME8569, accession no. AP012030), str3 (UMNK88, accession no. CP002729), str4 (IAI1, accession no. CU928160), str5 (UMN026, accession no. CU928163). The five strains are grouped into different clusters according to different ANI thresholds. The neighbor-joining tree shows a gradient ANI distance between str1 and the other four strains. (B) Performance in two-component co-infections. Str1 is mixed with one of the other four strains with different ratios and at different sequencing depths, and the mixture is disentangled at different ANI resolutions. The JSD index is used to assess the accuracy of the prediction. A smaller JSD value indicates a more accurate estimation. Heatmap (left) and violin plot (right) show the JSD values at different mixing ratios. The evaluation is performed at four different resolutions, namely 98%, 99%, 99.9% and 99.99% ANI. (C) Performance in five-component co-infections. The five strains are mixed at equal ratios. The clusters they belong to at different ANI resolutions follow the same color scheme as panel (A). The gray color represents the wrong cluster. The abundance estimate is shown on the left; the corresponding JSD values on the right. (D) Assessment of similarity to reference genomes. The expected cluster that str1 belongs to at different ANI levels is withdrawn from the reference genome database. The violin plot shows the similarities that MIST reports based on the reads mapping to sister clusters. For example, at the 98% level, removing the expected cluster would lead to assigning the reads to a sister cluster but reporting a similarity of around 98% of the query reads to the sister cluster.
When two or even five of the strains were mixed together with varying mixing ratios, the estimated compositions by MIST were satisfactory except at the 99.99% level (Figure 3B and C, Supplementary Figure S1available online at https://dbpia.nl.go.kr/bib). Using the index Jensen–Shannon divergence (JSD) to estimate the typing accuracy, an increasing sequencing depth and a lower resolution level required both produced more accurate typing results. However, when the depth reached 0.001×, the predicted composition was already similar to the real one. In contrast, the typing results with StrainEst showed >10 times JSD larger than that with MIST in the majority of tests, suggesting StrainEst was not suitable for low-throughput data.
Since the real-world clinical samples may comprise multiple bacterial species as well as human DNA, we constructed another synthetic dataset that contained reads simulated from E. coli, Salmonella enterica, Staphylococcus aureus, Clostriodioides difficile and human. MIST firstly separated the reads at the species level, and further successfully predicted their strain-level composition (Supplementary Figure S2 available online at https://dbpia.nl.go.kr/bib).
One of the major challenges of the reference-based methods is whether they inform the user of the uncertainty of the match and outputs the nearest strain when the genome of the query strain is actually missing from the reference database. To test the performance of MIST in this case, we adopted a leave-one-out approach by selectively removing the reference genomes belonging to the true cluster from the database. MIST can assign reads to a sister cluster, namely a cluster belonging to the same parent cluster, and meanwhile provided a similarity value that matched well with the clustering level (Figure 3D).
Strain-level characterization of culture-positive body fluids
Next, we leveraged MIST to characterize real-world 359 clinical body fluid specimens that were culture-positive for Acinetobacter baumannii, Klebsiella pneumoniae, E. coli or S. aureus. The four bacterial species were chosen due to their clinical prevalence and importance, as well as their extensive genome resources accumulated for building a hierarchical database. The median rate of total bacterial reads in these mNGS datasets was 1.36% (Figure 4A). At the species level, in 255 specimens, the culture-positive bacterial species was expectedly the Top1 species ranked by mNGS read count; whereas in the remaining 104 specimens, the read count of the cultured species was 100-fold fewer than the former 255 specimens (Figure 4A). In addition, for the 255 specimens, the ratio of read count of the most abundant species to the second abundant species (Top1/Top2) was much higher than that for the 104 specimens, indicating the presence of a predominant species in the former but multiple species in the latter.
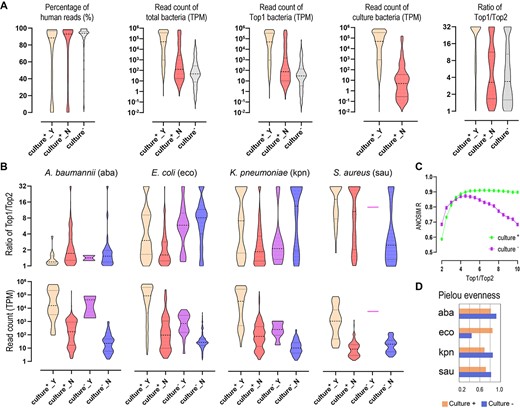
Typing of real-world clinical specimens at the species level (A) and strain level (B). (A) Comparison of human reads percentage, read count of total bacteria, read count of Top1 bacterial species and read count of the cultured species between culture-positive and culture-negative specimens. The culture-positive specimens are classified into two groups: Culture+_Y: the culture-positive species and the Top1 species by read count are the same; Culture+_N: cultured species and Top1 species in mNGS are different. (B) Strain-level statistics of four species in the specimens. For each of the four species, the culture-positive specimens containing them are classified into two types: Culture+_Y, the species is the cultured one and meanwhile is the Top1 by read count (hence, the species is probably the causative pathogen in the specimen); Culture+_N, the species is not the cultured one or the Top1 by read count (hence, the species is probably not the causative pathogen). The culture-negative specimens are also classified into two types: Culture−_Y, the species ranks Top1 by read count; Culture−_N, the species does not rank Top1 by read count. Top1/Top2 indicates a ratio of strain-level Top1/Top2 based on the abundance inferred by MIST. TPM indicates read counts per million. (C) ANOSIM correlation R at different Top1/Top2 values, which reflect the significance of divergence between the specimens with Top1/Top2 below the value and the specimens with Top1/Top2 above the value. The value with the highest R is used as the cutoff that decides whether there is a predominant strain in the specimen. (D) Pielou’s evenness index shows the diversity of strain composition between culture-positive and culture-negative specimens. The higher the value, the more diverse the strain level of the specimen tends to be.
The strain-level typing was next performed on the four bacterial species (Figure 4B, Supplementary Table S2 available online at https://dbpia.nl.go.kr/bib). Using the ratio of strain-level Top1/Top2 to assess the strain composition, we determined by ANOSIM test that, at the 99.9% ANI level, 5-fold can be used as the threshold to determine the presence of a predominant strain or multiple strains (Figure 4C). Accordingly, the presence of multiple strain was detected in 86.55% of A. baumannii-carrying specimens, 74.17% of E. coli-carrying specimens, 71.85% of K. pneumoniae-carrying specimens and 35.93% of S. aureus-carrying specimens. In line with that at the species level, the strain composition corresponded roughly to whether they were the causative pathogens for E. coli and K. pneumoniae (Figure 4B): the two species were more likely to be culture-positive in specimens in which they comprised a predominant strain, and, in contrast, be culture-negative in specimens comprised of multiple strains (P < 0.0001 by Chi-square test). However, this rule did not apply to S. aureus and A. baumannii. Whether it was the causative pathogen or not, the former tended to show a predominant strain while the latter showed multiple-strain composition. For all of the four species, the read count was 100-fold higher on average when they were the causative pathogens than when they were not.
Notably, a few strains appeared in many specimens as the predominant ones (Figure 5A): ST231, ST195 and ST208 tended to be prevalent for A. baumannii; ST15, ST11 and ST340 for K. pneumoniae; and ST22, ST59 and ST398 for S. aureus. They were exactly the most frequently reported nosocomial strains in China, according to the previous epidemiological studies in which MLST or WGS was adopted [28–30]. Few prevalent strains could be identified in E. coli.
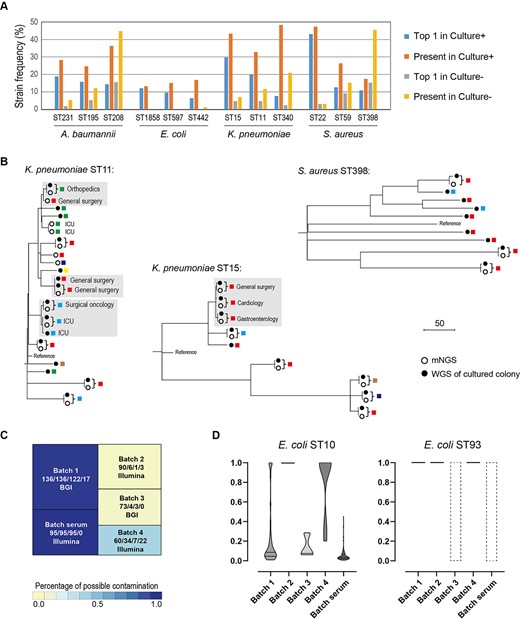
Identification of prevalent strains across samples. (A) The frequencies of the prevalent strains in both culture-positive and culture-negative specimens. ‘Top1’ indicates that the strain is the most abundant strain; ‘present’ indicates that the strain accounts for >10% of the species by abundance. (B) SNV-based phylogenetic tree of strains inferred from metagenomics samples (solid circle) and the cultured isolates (hollow circles). Isolates that are recovered from different patients and have their genetic relatedness <5 SNVs are highlighted with a gray box. Only specimens with the sequencing coverage of the four species >10× are included. (C) Treemap of E. coli ST10 (comprising K-12) and ST93 (comprising BL21) in culture-negative specimens. A total of four sequencing batches are involved in this study, and the corresponding sequencing platform (Illumina or BGI) is marked. The total number of specimens, the number of specimens including E. coli, and the number of specimens including ST10 and ST93 E. coli are marked, respectively. A batch of 95 human serum mNGS datasets is also included in the analysis (SRP182938). (D) The ratios are being removed as contaminants by MicroDecon software. The dashed boxes indicate that ST10 or ST93 is not present in the batches, and therefore decontamination is not applicable for them.
Prevalent strains across specimens were indicative of clonal circulation in the hospitals. We further sequenced the whole genomes of nine cultured colonies for ST15 K. pneumoniae, fifteen colonies for ST11 K. pneumoniae and nine colonies for ST398 S. aureus, respectively, and constructed the core genome SNV-based phylogeny (Figure 5B). Concordance was observed between mNGS and WGS of single colonies as the pairwise distances from the same specimen was smaller than 2 SNVs. Interestingly, a few events of potential pathogen transmission between individuals were identified since the isolates from different departments or even from different hospitals had their genetic relatedness <5 SNVs (Figure 5B).
When counting strains being present instead of being predominant in the specimens, the strains mentioned above were still prevalent (Figure 5A). ST22 and ST15 appeared in nearly half of the specimens in which S. aureus and K. pneumoniae were detected, respectively. Notably, these strains were actually not the causative pathogens in many of these specimens. For example, among the 146 specimens that contained ST15 K. pneumoniae, only 20 were culture-positive for K. pneumoniae.
Strain-level characterization of culture-negative body fluids
In parallel, we performed mNGS on 359 culture-negative clinical body fluid specimens. At the species level, the statistics of these specimens were similar to that of the 104 culture-positive specimens in which the cultured species did not rank Top1; namely they possessed fewer total bacterial reads and a smaller ratio of species-level Top1/Top2 (Figure 4A, Supplementary Table S3 available online at https://dbpia.nl.go.kr/bib). The read count of the Top1 species was also smaller, i.e. an average of fewer than 100 reads per 1 million of total mNGS reads. In addition, A. baumannii, E. coli, K. pneumoniae and S. aureus were present in 194 specimens but ranked Top1 in only 31 specimens, possibly indicative of their nature of contaminants.
As indicated by the strain-level Top1/Top2, multiple strains were detected in 93.22% of A. baumannii-carrying specimens, 30.39% of E. coli-carrying specimens, 44.19% of K. pneumoniae-carrying specimens and 69.70% of S. aureus-carrying specimens (Figure 4B). Compared to that in culture-positive specimens, Top1/Top2 was elevated in E. coli and reduced in S. aureus, indicating a higher level of strain diversity for S. aureus. The strain-level alpha-diversity analysis (measured by the Pielou index) revealed that A. baumannii and K. pneumoniae were also more diverse in culture-negative specimens (Figure 4D). Nevertheless, those prevalent strains in culture-positive specimens were still relatively prevalent in culture-negative specimens (Figure 5A).
Notably, among the 180 E. coli-carrying specimens, ST10 and ST93 were the Top1 E. coli strain in 122 (67.78%) and 23 (12.78%) specimens, although, in the majority (127/145) of these specimens, E. coli was not the Top1 species. Interestingly, this phenomenon was also observed in a publicly available mNGS dataset which comprised a batch of 95 human serum samples of sepsis [31]. By revisiting the data with MIST, we found that, at the 99.9% level, ST10 was not only present in all but also ranked Top1 in 94 specimens. The batch effect was evident: in Batch 1 of our datasets and in the serum dataset, E. coli ST10 was present in almost all specimens, whereas, in Batch 2 and 3, few specimens had ST10 detected (Figure 5C). Escherichia coli ST10 and ST93 are not usually clinically relevant but encompass the most common engineering strain K-12 and BL21, respectively. Combined with the batch effect observed, it was strongly reasonable to speculate that the ST10 and ST93 derived from reagents contamination. Next, we performed the prevalence-based statistical approach for decontamination. This approach assumes that contaminant sequences are present much more in negative controls than in true samples due to the absence of competing DNA in the former [31, 32]. By this approach, ST93 was fully removed; yet ST10 was considered as a contaminant only in Batch 2 and 4, and retained in the others (Figure 5D).
Discussion
The utility of mNGS has been revolutionizing how physicians diagnose and treat infectious diseases. Genotyping down to the level of individual strains within a species is a key step to fully exploit the potential power of mNGS, but software for this purpose is still in its infancy. Intra-species diversity exhibits in the form of SNV and variable genomic content. Taking E. coli for an example, at the 98% and 99% ANI levels, the genomic regions vary by 20% and 10%, respectively. The long-read sequencing technology is well suitable to recognize the strain-specific regions and may become a promising solution to the strain-level metagenomic assignment. However, the nature of specimens tested by mNGS, in particular those culture-negative ones, is considered microbiologically sterile. As revealed in this study, the culture-negative specimens yielded 100 times fewer bacterial reads than that of culture-positive specimens. To make matters worse, when ANI reaches 99.9%, SNVs account for most of the intra-species diversity. Long-read sequencing is unable to reliably call SNVs because of its high error rate (approximately 10%) relative to short-read sequencing (<0.1%) [33]. Although increasing the sequencing depth can aid in the capture of bacterial DNA and improve SNV calling, the sequencing throughput itself is a disadvantage of long-read sequencing. Consequently, short-read sequencing is so far still exclusively used in commercial mNGS testings. Nevertheless, only <–100 bacterial reads per million can be employed to perform strain typing in many samples of our study.
The currently available strain typing tools can be binned into assembly-based and alignment-based strategies; the latter can be further classified into the comparison against a single or multiple reference genomes. A small number of reads cannot overlap sufficiently to permit assembly into longer contiguous sequences [34, 35]. Alignment to a single reference genome requires a high coverage for SNV calling [16–19, 36, 37]. What is worse, reads would be wasted that are supposed to align on the strain-specific regions and therefore valuable for differentiating at 98%–99% level. Consequently, mapping against multiple reference genomes seems the only viable option for mNGS in clinical testing. In theory, this strategy applies to all pathogenic organisms, including fungi and viruses, and is able to organize all genomes in public database into a single database (from kingdom to strain). Considering the rapidly expanded availability of genomic data in the public database, each pathogen species has been accumulating tens of thousands of genomes, leading to unbearable computational resources by mapping the Giga-size mNGS data against such a huge combined database. Thus, our trade-off is to build a pan-genome for each species, extract species-specific reads and map the reads against all genomes of the species. Further reduction of the computational burden can be achieved by removing redundant genomes at the 99.99% ANI level because, at this level, strains are highly similar to each other in terms of both SNV and genomic content. Based on the hierarchical database, the sensitivity and accuracy of the subsequent MLE were satisfactory. Collectively, MIST can achieve a 99.9% ANI resolution by leveraging as low as 0.001× sequencing depth.
WGS has become the new gold standard for the studies of molecular epidemiology. A number of locally and globally accessible databases such as NCBI Pathogen detection and BacWGSTdb have been established with the aim of storing and sharing genome information of clinical isolates, as well as establishing transmission links and tracing the source of infections [38–40]. In this study, the strain typing results interpreted by MIST revealed that a few strains are prevalent across different departments or even different hospitals. These findings were then validated by WGS of the cultured colonies, indicating the potential application of MIST in epidemiology. To allow for real-time surveillance and outbreak tracking, the relevant mNGS database should be established in healthcare facilities. The routine use of mNGS in the clinical laboratories would significantly accelerate this process, creating mounds of sequence data that could be mined for transmission patterns for preventative purposes, especially for monitoring the widespread multidrug-resistant high-risk clones. When political and technical issues are overcome, the hospital’s local mNGS database should link to each other and synchronize with public databases, where a huge amount of pathogen genome resources would expand the transmission and tracing analyses to larger spatial and temporal scales.
The prevalence of strains across the mNGS specimens might result not only from outbreaks but also from microbial contamination; the latter can be introduced either in the laboratory or during clinical sampling. In the laboratory, contaminations may come from reagents, personnel or machines used for processing nucleic acid and constructing sequencing library, and, therefore, are often batch-specific [31]. Current decontamination relies mainly on statistical approaches, e.g. the frequency-based approach and the prevalence-based approach [31, 32]. With either approach, certain species would be completely considered contaminants and disregarded from the microbiome components, which could be otherwise disastrous for diagnostic purposes due to the existence of multiple strains in clinical specimens. One possible solution is to perform the statistical decontamination at the strain level, but this way is not always effective, as revealed in this study. Hence, prior knowledge of contamination, i.e. a database of background microorganisms commonly detected in mNGS data that arises from the laboratory environment frequently, is necessary, which must be built at the strain level as pointed out by this study.
Contaminations from clinical sampling can be a much more tricky challenge than that from the laboratory. In a broad sense, normal microbiota and transient colonizers can also be regarded as contaminants due to their minor clinical significance. The high sensitivity of mNGS, as a double-edged sword, makes it easier to capture these clinically common contaminants. For example, ST208 and ST195 were not only the main cultured strains of A. baumannii but also appeared frequently in specimens that were not culture-positive for this species. These findings agree that ST208 and ST195 A. baumannii play both roles of pathogens and contaminants in hospitals [41]. Under these circumstances, we recommend strict adherence to specimen collection guidelines for reducing the risk of contamination.
Conclusion
Technological advancements in high-throughput sequencing are enabling more rapid and comprehensive metagenomic analyses for routine diagnosis at a low cost. Before MIST, few tools have been designed to identify multiple strains of low abundance, and few methods have quantified how genetically distant these strains need to be to properly delineate them. MIST addressed these issues and achieved accurate strain-level typing for mNGS, therefore being helpful for accurate disease diagnosis and effective treatment of individuals. Analysis of a large number of culture-positive and culture-negative specimens showed that multiple-strain infection is the norm, not the exception, which may increase the probability that infected hosts harbor strains that are refractory to treatment.
Prevalent strains in hospitals not only cause the circulation of nosocomial infections but also complicate the clinical diagnosis as contaminants. While the infections need real-time surveillance and control measures, the contaminations warn us to read the mNGS reports with caution. Software that enhances metagenomic analyses at the strain level, such as MIST, will be the foundation of necessary surveillance and decontamination strategies. The coming years will witness the utility of mNGS as a game-changing technology in clinical medicine and public health.
Materials and Methods
Development of MIST software
MIST contains four modules: Species, Cluster, Index, Strain (Figure 1).
Module ‘Species’
This module functions to perform species-level typing. MIST downloads the genome sequences from the NCBI GenBank database and constructs a pan-genome for each pathogen species by using Panseq [42]. Then Bowtie2 is called to map the user’s mNGS reads (in fastq format) against the pre-built pan-genomes [43]. The abundance of pathogen species is estimated by counting the reads mapped to each species. The species-specific reads are extracted from the resulting SAM file for the downstream strain-level typing.
Module ‘Cluster’
MIST recruits multiple genome sequences, either complete or draft, to cover the intra-species genomic diversity. FastANI is called to calculate pairwise ANI between the genome sequences [44]. A complete linkage hierarchical clustering is carried out to assign the reference genomes into clusters at different ANI levels (Figure 1). Users are required to define the ANI thresholds; an optimal threshold is between 0.95 and 0.9999. Users can also use the pre-built clustering files, in which four ANI thresholds, namely 0.98, 0.99, 0.999 and 0.9999, are employed.
Module ‘Index’
This module functions to index the reference genomes using Bowtie2 indexer (bowtie2-build).
Module ‘Strain’
According to the results of the module ‘Species’, users can choose the most abundant species or any other ones as the suspect pathogen and perform strain-level typing by the module ‘Strain’. For the suspect species, MIST maps the species-specific mNGS reads against each of the reference genomes of the species using Bowtie2. The number of mismatches is extracted from the resulting SAM files and is saved in a mismatch matrix file, in which rows represent reads and columns represent reference genomes (Figure 1).
Next, this module estimates the relative abundance of each reference cluster. By using the clustering information produced by the module ‘Cluster’, the read-based mismatch matrix is converted into a clustered-based mismatch matrix, in which the minimum mismatch value of the reference genomes belonging to the same cluster is chosen as the mismatch value for the cluster. Thus, in the clustered-based mismatch matrix rows, represent reads, and columns represent clusters.
All of the ‘Minimize’ optimization methods available in the Scipy package in Python have been evaluated; only the sequential least-squares programming (SLSQP) method enables stable estimation and is eventually employed in MIST.
Five α values, i.e. 0.001, 0.005, 0.01, 0.05 and 0.1, have been evaluated using the training data from different pathogens of different sequencing depths and at different resolution levels (Supplementary Table S4 available online at https://dbpia.nl.go.kr/bib). Based on the derived JSD, the final estimates appeared not sensitive to α. The value 0.05 seemed slightly better than the others and was fixed in MIST.
We assume that most mNGS samples are dominated by only a few strains [37]. Because the computation cost of the above optimization depends greatly on the number of clusters, removing those clusters that are probably absent from the sample can effectively exponentially decrease the running time. In the cluster-based mismatch matrix, reads may align to more than one cluster with varying number mismatches. For each cluster, we define their ‘best’ reads as those aligned to them with a mapping score not lower than that with any other clusters; thus, the number of ‘best’ reads for a certain cluster can be used as a rough index of whether this cluster is present in the sample. In detail, for each of the predicted clusters (abundance >5%) at a certain level, we rank their children clusters by their number of ‘best’ reads, pick up the top five clusters and discard the rest. The chosen children clusters from each of the detected parent clusters are put together, and the corresponding mismatch matrix is used for optimization at the finer typing level. The process is repeated until typing at all levels is completed. The parent–children (hierarchical) relationship is extracted from the clustering file derived from the module ‘Cluster’.
The main difficulty of strain-level typing (compared to species-level typing) lies in the presence of highly similar reference sequences, which causes many reads to match against multiple references with equal scores. We speculated that ambiguous assignments of reads into clusters were the source of uncertainty of the abundance estimates. Herein we further divided the ‘best’ reads into ‘unique best’ and ‘shared best’ ones (Supplementary Figure S3 available online at https://dbpia.nl.go.kr/bib) and measured the extent of ambiguity with the ratio of the ‘unique best’ reads to the ‘shared best’ reads. In the meantime, to infer the uncertainty of the abundance estimates, we performed bootstrapping by 100 random samplings of reads and obtained the coefficient of variation (relative SD). As expected, the ratio of ‘unique best’ reads to ‘shared best’ reads was significantly correlated with the coefficient of variation (Pearson’s correlation r = −0.392, P < –0.0001), which was even stronger than the effect of sequencing depth (Pearson’s correlation r = −0.178, P < –0.0001) and typing ANI level (Pearson’s correlation r = –0.236, P < –0.0001). As bootstrapping was extremely time-consuming, we instead output in MIST the number of ‘unique best’ reads and ‘shared best’ reads to show users the uncertainty of the estimates.
Genetic analysis of E. coli reference genomes
The reference genomes of E. coli were downloaded from the NCBI GenBank database. The information of their phylogroups and MLST was extracted from EnteroBase [46]. Pairwise ANI was calculated using FastANI [44]. The distance matrix based on the resulting pairwise ANI was used as input to construct a neighbor-joining tree using MEGA X [47]. Pairwise conserved genomic regions were identified using MUMmer v3.2 [48]. The similarity of genomic regions was defined as the size of the conserved regions divided by the average genome size of the compared genomes.
Generation of synthetic datasets and comparison with StrainEst
Synthetic datasets were generated using Mason read simulator v0.1.2 for 100 bp long Illumina reads, with the following parameters: ‘-ll 300 -le 50 -n 100 -mp’ (http://publications.imp.fu-berlin.de/962).
StrainEst was used with default parameters except for the following. The genome of E. coli O157:H7 str. EDL933 (NCBI GenBank accession no. CP008957) was set as the single representative genome; all of the 718 E. coli complete genomes were mapped against this reference genome, and the SNV profile was produced. The identity thresholds 0.98, 0.99, 0.999 and 0.9999 were specified by the parameter ‘-t’ in the ‘snpclust’ command. JSD was used to evaluate the accuracy of the predicted strain profiles [49], namely the divergence between the actual and the inferred frequencies, in synthetic datasets for both MIST and StrainEst.
Sample collection and sequencing
The specimens of body fluids were obtained from the patients at eight different tertiary hospitals in China during 2020/11 and 2021/02. These patients were suspected of suffering bacterial infections based on the review of the clinical charts by an infectious disease specialist and clinical pathologist. The specimens were collected in sterile tubes or using swabs as part of routine clinical care, including blood, bile, abscess, joint, peritoneal, pleural, cerebrospinal, urine, bronchoalveolar lavage and other body fluids. The specimens were cultured routinely and were identified at the species level using a MALDI Biotyper (Bruker Daltonics, Billerica, MA, USA). A total of 359 specimens were positive for one of the following four species, A. baumannii, K. pneumoniae, E. coli or S. aureus, which were recruited for the subsequent study. Moreover, 359 culture-negative body fluid specimens were prepared in parallel for comparison.
The mNGS sequencing was performed using either Illumina NovaSeq 6000 or BGI MGISEQ sequencer according to the standardized operating procedures. Before bacterial identification, the reads after quality filtering were mapped to the human reference genome GRCh38 (GCA_000001405.15) using Bowtie2. The bacterial and fungal reference databases for typing at the species level were downloaded from RefSeq of NCBI (November 18, 2020), containing 36 494 bacterial and 394 fungal species.
WGS of prevalent strains and phylogeny construction
For specimen that met the following criteria, we picked its single cultured colony for WGS: (1) based on its strain-level typing at 99.9% ANI level, the ratio of Top1/Top2 > 5, and the relative abundance of the Top1 strain >80%; (2) based on the strain typing results, it belonged to ST11 or ST15 K. pneumoniae, or ST398 S. aureus; (3) the specimen was culture positive for K. pneumoniae or S. aureus. The genomic DNA of the colony was sequenced using Illumina NovaSeq 6000 platform with the 150 bp paired-end protocol. The derived raw reads were mapped against the reference genome (SCKP020079 for ST11 K. pneumoniae, CP029384.2; PMK1 for ST15 K. pneumoniae, CP008929.1; 13_LA_301 for ST398 S. aureus, LT992470.1), and SNVs were identified by using Snippy (https://github.com/tseemann/snippy). Gubbins was used for filtering putative recombinant sites [50]. FastTree was used for constructing maximum likelihood trees under gtr substitution model [51]. For specimens that contained ST11 or ST15 K. pneumoniae, or ST398 S. aureus, their raw mNGS reads were also added into the above Snippy analysis for comparison and phylogeny construction if they met the following criteria: (1) the sequencing coverage of the species >10×; (2) based on the strain-level typing at 99.9% ANI level, the ratio of Top1/Top2 > 5, and the abundance of the Top1 strain >80%.
Additional bioinformatics analyses
The MicroDecon R package was used for decontamination with default parameters adopted [52]. The read counts of each strain of E. coli strains at the 99.9% ANI level, combined with the read counts of each species except E. coli, were used as input.
To determine whether a predominant strain was present in a specimen, we set a threshold, based on which the specimens were classified into two groups according to the value Top1/Top2 being larger or smaller than the threshold. The ANOSIM method in vegan R package was used to test whether the intra-group distance was significantly smaller than the inter-group distance [53]. The values from 2.0 to 10.0 were tested, with a step value of 0.5. The value with the largest correlation R was set as the threshold.
Ethical approval and consent to participate
Study protocols were reviewed and approved by the Ethical Review Committee of Sir Run Run Shaw Hospital, Zhejiang University School of Medicine, China (Reference 20210325-35). The study was considered exempt from the requirement of informed consent as no identifiable patient information was collected, and only residual samples (after routine clinical testing) were collected in the clinical laboratory to perform mNGS analysis.
Software and data availability
MIST is written in Python and is freely available at https://github.com/pandafengye/MIST. The raw reads of 359 culture-positive and 359 culture-negative mNGS samples, as well as the reads of the selected cultured single bacterial colonies, have been deposited in the NCBI SRA database under the project number PRJNA728968. The 95 human serum mNGS datasets studied are also available at the NCBI SRA database number SRP182938. The synthetic datasets used in this study are available at http://bacdb.cn/MIST.testdata.tgz.
A new metagenomic intra-species typing (MIST) bioinformatics tool was developed to perform strain typing upon metagenomic sequencing data, especially for those clinical specimens with extremely low pathogen loads.
The real-world infected body fluid specimens, including culture-positive and culture-negative ones, were systemically characterized at the strain level.
The extension of clinical metagenomic sequencing to the strain level could greatly benefit clinical diagnosis of bacterial infections, including the identification of multi-strain infection, decontamination and infection control surveillance.
Authors’ contributions
Y.F. conceived and designed the project. S.M.Z., L.H.Z. and Z.Y.W. developed the algorithms, wrote the codes and analyzed the data. Z.R., H.F.C., Y.Y.W. and H.Q.J. collected the samples and performed the sequencing. Z.R., Y.F. and M.D. wrote the manuscript. All authors read and approved the final manuscript.
Funding
National Natural Science Foundation of China (82072241 and 82102436); Zhejiang Provincial Natural Science Foundation of China (LY21H190001).
Zhi Ruan is an associate professor at Sir Run Run Shaw Hospital, Zhejiang University School of Medicine, China. His primary research interest is in microbial genomics and the application of bioinformatics to studying the molecular epidemiology of bacterial infectious diseases.
Shengmei Zou is a graduate student at Zhejiang University School of Medicine, China. Her research focuses on developing novel algorithms and tools for metagenomic sequencing.
Zeyu Wang is a graduate student at Zhejiang University School of Medicine, China. Her research focuses on developing software for visualizing microbial genomic data.
Luhan Zhang is a graduate student at Zhejiang University School of Medicine, China. Her research includes the development of bioinformatics and machine learning algorithms.
Hangfei Chen is a graduate student at Zhejiang University School of Medicine, China. His research focuses on genome-wide association study of bacterial pathogens.
Yuye Wu is a graduate student at Zhejiang University School of Medicine, China. Her research interests include molecular epidemiology and antimicrobial resistance mechanisms of bacterial pathogens.
Huiqiong Jia is a clinical laboratory scientist at The First Affiliated Hospital, Zhejiang University School of Medicine, China. Her research interests include the molecular epidemiology, pathogenesis and antimicrobial resistance of bacterial pathogens.
Mohamed S. Draz is a principal investigator at Case Western Reserve University School of Medicine, USA. His primary research interest includes the development of advanced diagnostics and engineered biologics for infectious diseases and infection-associated health conditions.
Ye Feng is a principal investigator at Institute of Translational Medicine, Zhejiang University School of Medicine, China. His research interests include developing and utilizing comparative genomic approaches for the investigation of microbial evolution and epidemiology.
References
Author notes
Zhi Ruan and Shengmei Zou authors contributed equally to this work.
