


Abstract
The current standard practice for assembling individual genomes involves mapping millions of short DNA sequences (also known as DNA ‘reads’) against a pre-constructed reference genome. Mapping vast amounts of short reads in a timely manner is a computationally challenging task that inevitably produces artefacts, including biases against alleles not found in the reference genome. This reference bias and other mapping artefacts are expected to be exacerbated in ancient DNA (aDNA) studies, which rely on the analysis of low quantities of damaged and very short DNA fragments (~30–80 bp). Nevertheless, the current gold-standard mapping strategies for aDNA studies have effectively remained unchanged for nearly a decade, during which time new software has emerged. In this study, we used simulated aDNA reads from three different human populations to benchmark the performance of 30 distinct mapping strategies implemented across four different read mapping software—BWA-aln, BWA-mem, NovoAlign and Bowtie2—and quantified the impact of reference bias in downstream population genetic analyses. We show that specific NovoAlign, BWA-aln and BWA-mem parameterizations achieve high mapping precision with low levels of reference bias, particularly after filtering out reads with low mapping qualities. However, unbiased NovoAlign results required the use of an IUPAC reference genome. While relevant only to aDNA projects where reference population data are available, the benefit of using an IUPAC reference demonstrates the value of incorporating population genetic information into the aDNA mapping process, echoing recent results based on graph genome representations.
INTRODUCTION
Genomic data are playing an increasingly prominent role in contemporary evolutionary biology and biomedical research. This has been spurred by the development of high-throughput DNA sequencing (HTS) technologies [1, 2] and the resulting reduction in sequencing costs, leading to exponential growth in the amount of genetic data available. To date, the most cost-effective and widely used approach for generating standard genomic data is to break up genomes into large numbers of short DNA fragments, which are subsequently sequenced to produce ‘reads’ around 100–150 nucleotides (nt) in length. The genome sequence is then reconstituted by aligning (or ‘mapping’) these reads to a previously constructed reference genome from the relevant species (or, alternatively, another closely related species depending on availability) using purpose-built DNA mapping software, with two particularly popular options being BWA [3] and Bowtie2 [4]. In the case of ancient DNA (aDNA; retrieved from paleontological, archaeological and museum specimens) the degraded nature of the DNA means that most fragments are <150 nt long, obviating the need for further fragmentation.
Crucially, accurate mapping of the DNA reads is essential for proper identification of genetic variants that are often the focus of investigation in medical or population genetic studies, e.g. the discovery of alleles that contribute to disease, or determination of genetic markers that help define ancestry and population affiliations. However, the DNA alignment step is known to be error-prone [5] and can also result in biases that are related to the properties of the reads and specific characteristics of the reference genome [6]. In particular, reads carrying one or more alleles that are not present in the reference genome are known to be less likely to map than reads carrying the reference allele, which results in a bias against calling non-reference (i.e. alternate) alleles [7, 8]. This problem, which is commonly referred to as reference bias, becomes more problematic for DNA from individuals that are highly diverged from the individual(s) used to create the reference genome and is known to lead to incorrect inferences in downstream genetic analyses [9, 10].
Errors in DNA alignment and reference bias are expected to be particularly problematic for the analysis of aDNA, a rapidly growing research field that introduces new challenges for read-mapping algorithms that are absent from modern genetic datasets. Because of postmortem DNA degradation, DNA fragments recovered from ancient specimens are much shorter (resulting in the majority of reads being between 30 and 80 nt [11]) than those from artificially fragmented modern genomes, and also typically contain damage-modified sequences and high levels of DNA contamination from other organisms (mainly microbes). These factors hinder the alignment of aDNA reads to the reference genome and result in much lower genomic coverage relative to modern samples for a given sequencing effort—i.e. a lower amount of unique reads mapping to each nucleotide in the reference genome—making aDNA highly susceptible to mapping errors, miscalled alleles and reference bias [6].
Despite these problems, only a handful of studies have examined the performance of different alignment tools for aDNA reads, with the current widely adopted standard mapping practices in aDNA research established nearly a decade ago [12]. However, this key benchmarking study only tested different options from a single alignment tool—BWA-aln (Burrows-Wheeler Aligner [3])—and one of the tested sequencing platforms is now obsolete (Helicos True Single-Molecule DNA Sequencing platforms) [13]. Today, improved Illumina short-read sequencing laboratory methods have become standard in the aDNA field, including treatments that partly or fully remove damaged nucleotides caused by deamination of unmethylated cytosine sites [14]. Additionally, several alternate alignment software are now available that might improve aDNA mapping [15]. Importantly, the optimal choice of aligner may depend on characteristics of the genetic data—such as fragment length, damage profiles and the treatment of deaminated sites—which have yet to be formally investigated in the context of aDNA mapping. Recent work has examined the impact of reference bias in empirical ancient human datasets and its implications on downstream population genetic analyses and how reference bias in aDNA studies can be corrected using new genome graph-based alignment software. However, there has still not been a systematic investigation of these questions that includes multiple mapping software and inbuilt parameter settings using standard linear reference genomes [6, 16, 17]. Furthermore, alignment to linear reference genomes is likely to remain the standard approach for several more years while a standardized coordinate system and annotations are developed for genome graphs [18, 19].
Here, we provide a comprehensive systematic evaluation of the alignment performance and reference bias for multiple DNA aligners in an aDNA context, using simulated aDNA reads modelled on empirical data from human populations from three different continental regions (i.e. Africa, East Asia and Europe). The performance of four commonly used software tools i.e. BWA-aln, BWA-mem, Bowtie2 and NovoAlign are evaluated with 30 different parameterizations by measuring read alignment precision and reference bias at simulated polymorphic loci. We compare performance both with and without treatments that remove damaged nucleotides that are now commonplace in aDNA studies, and also using standard filtering strategies based on read alignment qualities. Additionally, we examine if alignment performance is improved when using an augmented reference genome that incorporates information about previously identified polymorphic sites, by replacing the reference nucleotide with the IUPAC (International Union of Pure and Applied Chemistry) character that captures diversity at the locus (see Methods). Lastly, we assess the impact of mapping strategy on downstream population genetic analyses. Our results reveal that all methods exhibit some degree of reference bias when aligning short aDNA reads, and we provide recommendations to optimize alignment performance and minimize reference bias at SNP-based levels and in downstream analyses.
METHODS
Data simulation
To provide an empirical basis for examining the performance of DNA aligners we generated a set of simulated DNA fragments and used them in a benchmarking pipeline. As humans are the most widely studied species in aDNA research, we chose to limit our study to simulated data based on human population genetic datasets. Nonetheless, our findings should be relevant to other species commonly studied with aDNA (typically mammalian megafauna).
We used Mitty (https://github.com/sbg/Mitty) to simulate reads of 250 nt in length from chromosome 22 of the human reference genome version GRCh37. Reads were simulated using the ‘1kg-pcr-free.pkl’ model included in Mitty to incorporate sequencing errors that follow an Illumina profile (TrueSeq; see Supplementary Methods). To determine the impact of read-lengths pertinent in ancient DNA studies on mapping performance, we trimmed the reads to lengths ranging between 30 and 120 nt, such that there were exactly 100 000 reads falling within each consecutive 10 nt bin between 30 and 120 nt (i.e. 30–39 nt; 40–49 nt; …; 100–109 nt; 110–119 nt), and 900 000 simulated reads in total.
Variant sites were introduced into the simulated reads using polymorphic sites identified in the human 1000 Genomes Project (1000 GP) [20]. Specifically, we used Mitty to incorporate genetic variation at single nucleotide polymorphic sites (SNPs) and indels (insertions and deletions [21]) obtained from the following three samples from the 1000 GP [20]: HG00119 (British in England and Scotland; GBR; labelled Europe in this study), NA19471 (Luhya in Webuye, Kenya; LWK; Africa in this study), HG00513 (Han Chinese in Beijing, China; CHB; East Asia in this study). We chose individuals from three different continents to quantify the potential impact of reference bias on mapping.
aDNA damage incorporation
After generating the simulated reads, we used the ‘deamSim’ function from gargammel [22] to add aDNA damage to each read according to the empirical damage profile from the ~7000 year old ‘La Braña’ specimen [22, 23] (16% nuclear C > T misincorporation level [24]). Because of the large amounts of DNA damage arising from cytosine deamination, most aDNA studies now include specific treatments that repair or remove some or all deaminated cytosine sites in aDNA fragments to reduce artefacts in downstream analyses. Accordingly, we explored the impact of the two most widely used treatments, which use uracil DNA glycosylase (UDG) to remove uracil bases resulting from cytosine deamination, on alignment performance. We simulated reads that mimic the read sequence modifications specific to Full-UDG (F-UDG) and Half-UDG (H-UDG) treatments, which result in the partial replacement of deaminated cytosines [14, 25] and compared the results to reads with the full damage spectrum. To simulate the impact of Half-UDG treatment on aDNA reads, we used gargammel [22] to model the partial replacement of deaminated cytosines based on an empirical profile produced from this treatment (i.e. individual ‘SAMEA4843644’ [26]). For the Full-UDG treatment, we trimmed the five terminal nucleotides from either end of each read to mimic the removal of terminal regions and the corresponding fragment shortening characteristic of this treatment. Because our analytical results were consistent across the three samples for untreated reads (see results), we only performed the UDG treatments on the East Asian dataset (See Supplementary Methods).
DNA aligners tested
To provide a broad assessment of potential aDNA alignment strategies we tested BWA-aln [3], which is currently the most widely used alignment software in aDNA studies, and three other aligners that are widely used in modern DNA research but for which aDNA performance has not been formally explored in relation to multiple alternate aligners under standardized benchmarking criteria, namely, BWA-mem (version 0.7.15) [27], Bowtie2 (version 2.2.9) [4] and NovoAlign (version v3.09.01; http://www.novocraft.com/products/novoalign) (Table S1).
BWA-aln, also known as BWA-backtrack [3], is the current standard software used to map aDNA reads, using parameter settings outlined in Schubert et al. [12]. We include all of the BWA-aln parameter settings used in the benchmarking study of Schubert and colleagues, and include a handful of additional parameter combinations that have also been reported in the aDNA field [28, 29], which incorporate alternate gap penalties and mismatch allowances (Table S1).
We also evaluate the performance of BWA-mem [27] using the default parameter settings. BWA-mem is significantly faster than BWA-aln but the current implementation is optimized for reads longer than 70 bp and so it is not expected to be optimal for many aDNA studies; however, it is of general interest due to the large speed improvements relative to BWA-aln.
Bowtie2 [4] is another popular aligner that was recently shown to perform well with ancient DNA reads under specific circumstances [15, 30]. By default, Bowtie2 performs an end-to-end (i.e. ‘global’) alignment that forces the software to avoid soft-clipping of reads (i.e. masking of terminal portions of the reads that do not align to the genome). In addition to this default option, we also tested a local alignment option, which might be useful for aDNA mapping as DNA damage is more likely to accumulate at the terminal ends of reads. We also tested the ‘very sensitive’ option of Bowtie2 for both global and local alignment methods, and included another local-alignment implementation that was shown to improve aDNA alignments in a recent empirical study (BWT5; see Table S1 for parameters; [30]). Although most Bowtie2 preset options are designed to improve speed while maintaining high accuracy across a range of variables, those with the ‘sensitive’ option sacrifice speed for improved precision and accuracy.
Finally, we used the proprietary DNA aligner NovoAlign developed by Novocraft Technologies. While NovoAlign requires a licence to access some features, a single-core version is freely available to researchers. We tested NovoAlign using the default parameters and several additional parameter combinations that are outlined in Table S1.
IUPAC implementation
A recent study revealed that alignment of ancient DNA reads to a genome graph results in reduced reference bias compared to BWA-aln alignments to a linear reference genome [6]. Hence, we tested if the introduction of polymorphism information in the linear reference could improve mapping performance and decrease reference bias, by rerunning the alignment on a modified reference genome where all single nucleotide polymorphic sites identified in the 1000 GP (phase 3) were converted to the corresponding IUPAC character. IUPAC-modified reference genomes contain redundant nucleotides at known polymorphic positions that allow for two or more alleles to map to these genome positions without incurring a penalty [31]. The IUPAC alignments were limited to a subset of the NovoAlign strategies, as this is the only aligner that currently supports IUPAC implementations (note that NovoAlign only supports the inclusion of SNP variants in IUPAC-modified reference genomes, prohibiting any testing of the impact of polymorphic indels that were present in our samples).
Post-alignment processing
Following read mapping, we applied a set of post-alignment processing steps that are standard for the aDNA field [32]. Briefly, we used the MarkDuplicates function in Picard Tools (https://broadinstitute.github.io/picard) to identify all duplicated reads and then realigned reads around known indels using GATK indelrealigner (version 3.7) [33]. The final set of processed reads was analysed through comparison with their true mapping locations. We note that the assessment of alignments took soft clipping (i.e. removal of one or both terminal read ends in the alignment) into account wherever this occurred.
Quantifying aligner performance
Precision
For all software parameterizations and each dataset, three classes of read alignments were defined and used to calculate statistical indices: (1) true positives (|$TP$|): simulated reads that mapped to the correct genomic location; (2) false positives (|$FP$|): simulated reads that mapped to the incorrect genomic location; and (3) false negatives (|$FN$|): simulated reads that did not map. The best performing software is expected to have the majority of reads correctly mapped to the reference while minimizing the amount of incorrect and unmapped reads. Accordingly, we measured the precision (i.e. |$\frac{TP}{TP+ FP}$|) of each parameterization and contrasted this against the proportion of reads that mapped overall (see Supplementary Methods).
SNP-based reference bias
For each sample, we also quantified the level of reference bias across all SNPs by contrasting the alignment precision for reads carrying an alternate versus those carrying reference alleles at each polymorphic site. Specifically, for each sample, we determined all reads that overlapped a known SNP conditional on there being at least one alternate allele for a given SNP in the simulated reads for that sample. We then calculated the precision for reads carrying the alternate allele across all polymorphic SNPs, and subtracted this from the precision of reads that carried the reference allele at these positions. Accordingly, positive values are a direct aggregate measure of reference bias summarized across all SNPs in each sample.
Testing the impact of read filters on performance
Following standard approaches in modern aDNA studies, all precision and SNP-based reference bias measurements were made after excluding reads with mapping quality of 0 (|$mapQ>0$|; i.e. removing any reads with ambiguous mapping), and additionally after excluding reads with mapping quality below 25 (|$mapQ\ge 25$|). The application of mapping filters is a common practice in genomic studies to improve alignment performance, and results in the removal of both unmapped reads (|$FN$|) and a subset of mapped reads with |$mapQ$| below the prescribed threshold (ideally removing a higher proportion of |$FP$| than |$TP$| reads). We chose the |$mapQ\ge 25$| cut-off as it has been shown to improve the quality of read alignments in previous aDNA studies that use the BWA-aln algorithm [34]—though we caution that the maximum |$mapQ$| value varies widely across the alignment software tested here (i.e. 37 for BWA-aln, 42 for Bowtie2, 60 for BWA-mem and 70 for Novoalign), such that this |$mapQ$| value may not be as meaningful for other software tools.
Additionally, we also tested the impact of applying mappability filters and masking known CpG islands on SNP-based reference bias. Studies of BWA-aln alignments to the human reference genome have revealed considerable variation across the genome in the mapping accuracy, leading to the availability of files that demarcate regions of low mappability that can be masked from analyses. Similarly, CpG islands were recently shown to impact the alignment precision in aDNA studies, presumably because such regions are highly methylated and therefore prone to read deamination and damage-related mapping artefacts [15]. Files with mappable regions and CpG islands were obtained from BWA-aln developer Heng Li’s blog (https://lh3.github.io/) and from UCSC genome browser ‘CpG island’ table (https://genome.ucsc.edu/cgi-bin/hgTables), respectively.
Measuring the impact of reference bias on downstream analyses
To test the impact of reference bias on downstream population genetic analyses in each mapping strategy, we called individual variants (see next section) for each individual dataset (NA19471 from Africa, HG00119 from Europe and HG00513 from East Asia) and then used these variants in two commonly applied population genetic summary statistics: the D-statistic and Principal Component Analysis (PCA). We quantified the D-statistic under the following topology D(Y, X = Truth; Ref, Chimp), where X is the true set of variants for that individual, Y is the set of calls inferred from the simulated data set, Ref is human reference genome used in the alignment (GRCh37) and Chimp is the chimpanzee reference genome. Notably, reference bias is expected to result in significantly positive D-statistic scores, which results from an excess of allele sharing between the inferred simulated calls and the human reference genome relative to the truth set [35]. All D-statistic estimates were computed using admixr [38].
Accordingly, positive values indicate the relative shift towards the reference in PCA space caused by reference bias for a given simulated data set.
Variant calling
To call variant positions we followed the standard pseudo-haploid calling process applied in aDNA studies which uses the mpileup function from SAMtools [37] and pileupCaller from sequenceTools (https://github.com/stschiff/sequenceTools). The pseudo-haploidization step calls the allele for each predefined variant by determining the identity of the homologous variant in a randomly sampled read. In order to capture the uncertainty introduced by the random sampling step we repeated the pseudo-haploidization call three times for each software parameterization and sampled individual.
For each alignment method and population we downsampled the set of aligned reads to match the empirical read-length distribution of aligned reads provided by gargammel (i.e. Motala ancient specimen [23]). This ensures that our calls are based on aligned reads with lengths that are representative of empirical ancient datasets and reduces the possibility that the calls are unduly influenced by alleles carried on longer reads. Each downsampled subset of reads were filtered for mapping quality using the same two filters used to measure alignment performance (i.e. |$mapQ>0$| and |$mapQ\ge 25$|), resulting in a final set of high-quality mapped reads that were used to assess reference bias.
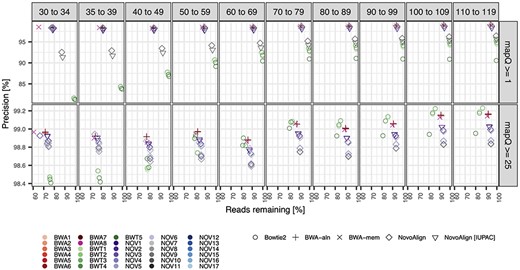
Alignment precision relative to read length and two mapping quality filters for the simulated East Asian sample. We assessed the precision of 30 parameterizations (different colours) for four different alignment software, including an IUPAC-based alignment for a subset of the NovoAlign parameterizations (different shapes). The x-axis measures the number of reads remaining after applying the specific mapping quality filter, which results in the removal of all reads below the required mapping along with all unmapped reads. Results were similar for the European and African samples and are shown in the Figures S1 and S2, respectively.
Aligner specificity for common DNA contaminants
DNA extracts from ancient specimens typically contain large amounts of additional DNA from contaminant organisms that end up being sequenced along with the host DNA. Accordingly, we examined the specificity (i.e. in this context the proportion of unmapped reads) of each aligner for aligning contaminant reads. To this end, we used gargammel [22] to simulate 10 000 single-end bacterial reads modelled upon the bacterial reads recovered from Kostenski 14 [39] (as recommended in gargammel), and also aligned a random sample of 10 000 dog reads taken from a recent publication (i.e. sample Basenji2/SAMN03366708 [40]) to examine the alignment specificity of potential contamination derived from a more closely related commensal species.
Computational resources
We used a standard computational configuration for all aligner parameterizations applied in this study. Specifically, all analyses were performed on the University of Adelaide’s Phoenix cluster and used 16GB of memory and 8 cores. To compare the running time for the different aligners we report the ‘core-hours’ for each alignment, which refers to the number of processor units (cores) used to run a simulation multiplied by the duration of the job in hours. For instance, 1 core hour could comprise 1 h on a single core, 30 min each on 2 cores, and so on.
RESULTS
Mapping precision
Mapping precision was estimated for sets of reads falling into successive 10 nt read length bins, with the exception that the smallest reads were split into two 5 nt length bins (i.e. 30–34 nt and 35–39 nt), since many aDNA studies use either 30 nt or 35 nt as the lower read length threshold in their analyses. For all software parameterizations, we observe that longer reads were consistently more likely to map to their true genomic position with fewer |$FPs$| than shorter reads, as expected (Figure 1 and Table S2), and showed qualitatively similar patterns across the three different human samples (Figures S1 and S2). Notable differences in performance were observed between the different software tested, though different parameterizations of the same software had highly similar performance overall (i.e. more variation was observed between the different aligners than across the different parameterizations of each aligner). In particular, when excluding reads with |$mapQ$| of 0, the four Bowtie2 parameterizations had consistently lower precision and a higher proportion of mapped reads across all read length bins compared to the three other tested aligners, with the differences between the software becoming more exaggerated for shorter reads (i.e. Bowtie2 having ~15% lower precision while mapping ~20% more reads of 30–34 nt length; Figure 1 and Figures S1 and S2). In contrast, BWA-aln, BWA-mem and NovoAlign aligners showed highly consistent results across each of the read-length bins when excluding reads with |$mapQ$| of 0, albeit with three notable exceptions: (1) BWA-mem had a lower proportion of reads mapped in the 30–34 nt read length bin but otherwise had comparable performance with BWA-aln across other read lengths; (2) the NovoAlign multiple-alignment parameterization (NOV10) behaved more like Bowtie2—i.e. comparatively lower precision and more mapped reads—particularly for longer reads; (3) there were slight improvements in alignment precision for the NovoAlign methods when using the reference genome with IUPAC characters (i.e. incorporating information on polymorphic sites from the 1000 GP reference populations) relative to alignments to the unmodified reference.
When reads with mapping qualities less than 25 were removed, as is common practice for aDNA studies using BWA-aln software [34], all methods exhibited a boost in precision at the cost of mapping less reads overall (Figure 1 and Figures S1 and S2). Using this more stringent mapping quality filter resulted in the precision becoming relatively uniform across the different alignment software and also across read length bins, with precision ranging between 98.4 and 99.3% for all read lengths and parameterizations. Overall, the four Bowtie2 parameterizations showed the biggest gains in precision after applying the |$mapQ\ge$|25 filter, particularly for shorter reads, with precision increasing more than 15% for reads less than 40 nt in length (compared to <2% gain for parameterizations of the other aligners for these read lengths on average).
SNP-based reference bias
The level of reference bias closely complemented the alignment precision results, with all strategies showing a consistent positive bias across all read length bins that increased steadily as reads become shorter—for reads with |$mapQ>0$|, bias ranged between ~2 and 14% for the reads between 30 and 34 nt, reducing to between ~0.5 and 5% for reads between 100 and 119 nt (Figure 2 and Figures S3 and S4). Reference bias was further reduced after applying the |$mapQ\ge$|25 filter, with the largest gains occurring for the most biased strategies and the shortest reads (e.g. reducing ~4–6% for BWA-aln, BWA-mem and Bowtie2 for reads between 30 and 34 nt), but application of the quality filter did not completely remove bias for any strategies in any read length bin (Figure 2 and Figures S3 and S4). Notably, the NovoAlign methods that aligned reads to the IUPAC-augmented genome were the least biased strategies across all read lengths and easily outperformed NovoAlign strategies aligned to the standard reference, though BWA-aln also showed comparable performance with IUPAC-aligned NovoAlign strategies after applying the |$mapQ\ge$|25 filter (<3% reference bias across all read length bins; Figure 2 and Figures S3 and S4).
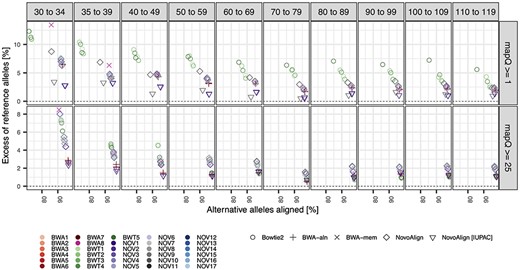
SNP-based reference bias relative to read length and two mapping quality filters for the simulated East Asian sample. We measured the degree of reference bias by evaluating the difference in sensitivity between alternate and reference alleles across all SNPs covered by at least one alternate allele across successive read length bins. All other parameters are identical to those shown in Figure 1. Notably, the reference bias patterns were broadly consistent with sensitivity patterns shown in Figure 1, and were also similar for European and African samples (see Figures S3 and S4, respectively).
UDG treatments
The reads simulated to reflect either a full or half-UDG treatment (F-UDG and H-UDG, respectively) resulted in additional improvements in mapping precision (Figures S5 and S6) and reductions in reference bias relative to untreated reads (Figures S7 and S8). The reductions in reference bias were most marked for F-UDG-treated reads of shorter lengths (F-UDG-mediated reductions in reference bias >3% for reads between 30 and 34 nt relative to untreated reads, cf. <1% reductions for F-UDG-treated reads of the same length; Figures S7 and S8). The positive impacts of UDG treatment and mapping quality filters on reference bias tended to aggregate, with the lowest overall reference biases being observed amongst F-UDG-treated reads that were filtered for |$mapQ\ge$|25. Notably, while both UDG treatments tended to reduce the reference bias, the total number of mapped reads was comparable with non-UDG treatments (Figure S6) and the reduction in reference bias appeared to be caused by a lower proportion of reference alleles being correctly aligned (rather than an increase in proportion of mapped alternate alleles; Figure S8). In contrast, applying the |$mapQ\ge$|25 filter resulted in a sizable decrease in the number of mapped reads across all treatments, and reductions in reference bias were largely driven by an inflation in proportion of alternate alleles being aligned within this smaller set of reads.
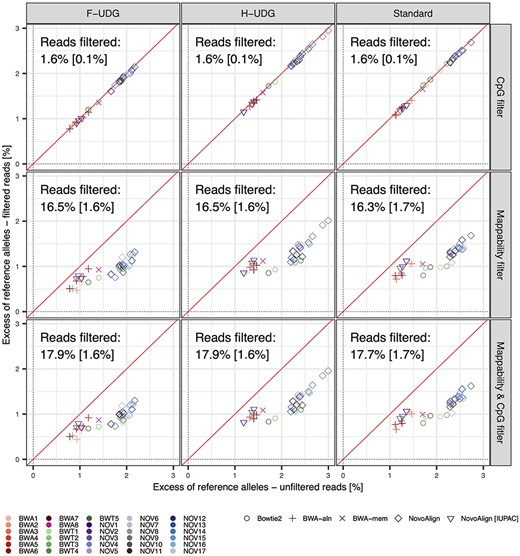
Impact of filtering CpG islands and low mappability regions on SNP-based reference bias. Small but consistent reductions in the reference bias were observed when masking regions with low mappability from alignments (~1%), though little change was observed in bias when masking CpG islands (<0.1%). The differences in efficacy of the two masking strategies was largely due to the latter overlapping far fewer SNPs overall (~1.5% for CpG islands versus ~17% for low mappability regions; mean percentage of filtered reads shown in each panel, standard deviation shown in square brackets). Reference bias was measured after downsampling simulated reads to match the distribution of read lengths in an empirical ancient sample (see Methods).
Filtering based on mappability and CpG islands
Additional reductions in reference bias were achieved when removing reads in regions of low mappability (~1% reduction for standard NovoAlign and Bowtie2, and between 0.2 and 0.6% for other strategies across untreated and UDG-treated reads), but were negligible when masking CpG islands (<0.1% reduction for all strategies and read treatments; Figure 3). Nonetheless, reference bias was consistently inflated in CpG islands relative to other genomic regions, but this did not result in a meaningful reduction in reference bias since only ~1.5% of polymorphic alleles fell within CpG islands for each sample. In contrast, an order of magnitude more SNPs (~15%) are situated within low mappability regions, whereby filtering these regions provided a small but consistent reduction in bias on top of that gained from UDG treatments and mapping quality filtering.
Impact of reference bias on population genetic analyses
To assess if the reference bias inherent in the tested alignment strategies can lead to errors in common downstream population genetic analyses, we used the D-statistic [41] to test if the simulated reads shared an excess of reference alleles relative to the truth set (i.e. the genotypes from the relevant population sample), using a Chimpanzee genome as an outgroup to polarize the alleles [6]. Using this topology, software parameterizations showing D values with a Z-score greater than 3 indicate a significant excess of shared alleles with the reference genome, implying that the software is impacted by reference bias.
The different strategies showed varying susceptibility to reference bias in a manner that was consistent with the inferred SNP-based reference bias Figure S10, with the BWA-aln and BWA-mem parameterizations having only a handful of significantly biased tests, while the Bowtie2 parameterizations exhibited moderate levels of bias and most NovoAlign parameterizations were consistently impacted by reference bias (Figure 4 and Figures S9–S11). Interestingly, the simulated East Asian sample alignments were more prone to reference bias on average—a pattern that was also evident in the SNP-based reference bias analyses (Figure 2 and Figures S3 and S4). This may be a consequence of the reference genome assembly being mostly a composite of African and European ancestries—~42% of the assembly is derived from a single donor of African American descent capturing a mixture of African and European ancestries—with only a minor amount of East Asian DNA being incorporated [42]. Despite our SNP-based estimates of reference bias consistently decreasing when applying the mapQ ≥25 filter, similar improvements were not evident for the D statistic when using the more stringent mapping quality filter (with bias actually becoming slightly exacerbated for the Bowtie2 methods). Nonetheless, the marked reference bias exhibited by NovoAlign is almost entirely overcome when aligning to a reference that includes IUPAC characters, which agrees with the large reduction in bias observed when comparing standard and IUPAC NovoAlign mappings in the SNP-based metric (Figure 4 and Figures S9–S11).
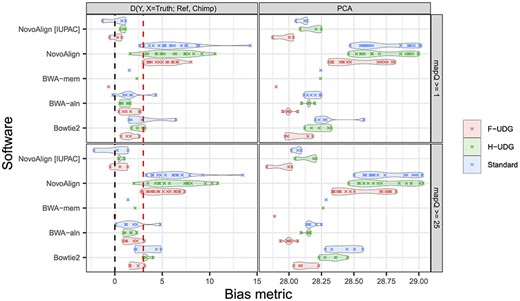
The degree of reference bias across the different alignment software evaluated using common population genetic analyses. Pseudo-haploid variant calls were made for all strategies, after filtering for mapping quality (different row panels) and downsampling reads to have a length distribution matching an ancient sample, and the D-statistic (right panels) and PCA computed (left panels). The pseudo-haploidization process was replicated three times for each parameterization and the average results are shown here. For both metrics, unbiased alignments have a value of 0. For the D-statistic, the Z-scores are plotted and positive values above 3 (red line) imply a significant excess of shared alleles between the simulations and the reference genome relative to the truth, indicative of reference bias. The PCA metric measures the reduced distance between simulations and the reference relative to expectations, with larger values indicating more reference bias (values are multiplied by 100; see Methods). Figure S9 shows the results for untreated reads in all three samples.
Considerable reference bias was also evident in the PCA analysis (Figure 4 and Figure S12), with simulated data clustering by sample and being ~28–29% closer to the reference genome in 10-dimensional PCA space than the associated truth set. In agreement with our previous results, BWA-aln and the NovoAlign strategies that used the IUPAC reference showed the least bias overall amongst the aligners. Similarly, F-UDG treated reads tended to have less reference bias than H-UDG and untreated reads and the mapQ ≥25 filters did not lead to appreciable changes in bias, other than an apparent increase in bias for Bowtie2 alignments that was also observed for the D statistic. Notably, the SNP-based measure of reference bias actually improved under Bowtie2 when applying a more stringent filter, but at the cost of aligning considerably fewer reads (~10–20% reduction for reads <60 nt, versus ~2–5% reduction for nearly all other aligners; Figure S8). This suggests that the increased reference bias observed at these summary statistics for Bowtie2 might be due to the exacerbation of reference bias at some SNPs—despite the average decrease across all SNPs—due to the large reduction in coverage.
![Summary of mapping performance and reference bias. a. Each strategy is ranked according to the mean value across the four different metrics assessed in this study, i.e. precision, SNP-based reference bias, D-statistic, and PCA (mean = black plus sign and individual metrics = different coloured crosses; see key). Each metric is scaled to take a value between 0 and 1 by dividing the metric value by the range across each metric. This plot represents the results for the East Asian dataset using the untreated reads; however, the patterns are consistent across the both UDG treatments, (see Figures S13 and S14). Note that BWA7 had results that differed markedly from other strategies for some metrics and consequently is not represented in panel a to avoid distorting the scale for these metrics. b. Average execution time for each of the strategies for the three samples, based on 1.5 million reads (see SI for details). In both panels, strategies with the suffix ‘[I]’ were aligned to the IUPAC-modified reference genome.](https://oup.silverchair-cdn.com/oup/backfile/Content_public/Journal/bib/22/5/10.1093_bib_bbab076/2/m_bbab076f5.jpeg?Expires=1749134800&Signature=XIu2xJu9s-k8Ef7H~N1qyLQZuu2iF1SAOm-mlyMTR8l4UNW8JVy5VqZ7w4hKxnqvBJlAa5h7hNFNZxyxYrKx16xrdmhP10h-nZS7FBXzbHl4owJnqcUlGRJ7hfccomGTU3aihxHpuok2nfuxnxUQ5xJsC4MrroUxaE8Z~d1HFbAucGlCEO72O33QQHVaCqwi8ZZZr5u80ud30kJKsHT6bt0Pp4pCkPop~V3JkrwFHShO6WuBcZqH3y51iijUfh3ZTQN3erD-C-6EOhn~qjba3SuWgtibE8Hfl~~ofDxqZznkc-OLhfexO-rVfREnNjgQ0AHORDVPsi~2Gqs1~2a1~Q__&Key-Pair-Id=APKAIE5G5CRDK6RD3PGA)
Summary of mapping performance and reference bias. a. Each strategy is ranked according to the mean value across the four different metrics assessed in this study, i.e. precision, SNP-based reference bias, D-statistic, and PCA (mean = black plus sign and individual metrics = different coloured crosses; see key). Each metric is scaled to take a value between 0 and 1 by dividing the metric value by the range across each metric. This plot represents the results for the East Asian dataset using the untreated reads; however, the patterns are consistent across the both UDG treatments, (see Figures S13 and S14). Note that BWA7 had results that differed markedly from other strategies for some metrics and consequently is not represented in panel a to avoid distorting the scale for these metrics. b. Average execution time for each of the strategies for the three samples, based on 1.5 million reads (see SI for details). In both panels, strategies with the suffix ‘[I]’ were aligned to the IUPAC-modified reference genome.
Impact of DNA contaminants
We measured the specificity (i.e. the proportion of unmapped reads) of several of the better performing strategies across the different aligners to quantify how readily they mapped simulated aDNA from bacterial taxa, a common contaminant in aDNA studies, along with empirical aDNA derived from domestic dogs to quantify the impact of potential contamination coming from a species more closely related to the host DNA source. For the bacterial reads, all tested strategies had consistent high specificities that approached 100%, with BWT4 performing slightly worse with a specificity around 95%. Results were more variable for the dog reads where the two tested BWA-aln (BWA1 and BWA2) strategies had specificities above 99% and BWT3 and all tested NovoAlign strategies performed slightly worse with specificities around 95%, whereas BWA-mem (i.e. BWA8) and BWT4 performed poorly with specificities of 70 and 60%, respectively. This result is likely the consequence of both BWA-mem and BWT4 being the only tested strategies that use local alignment, which is a more permissive alignment algorithm than the end-to-end read alignment adopted in the other strategies.
Software running times
Execution times varied widely amongst the different aligners, with the NovoAlign BWA-mem and Bowtie2 parameterizations running in ~1 CPU-hour, considerably faster than the BWA-aln parameterizations which consumed 10 times more CPU-hours (9–11 CPU-hours) on average (Figure 5b and Table S2).
Summary of mapping performance and recommendations
| Rank | Software | Pros | Cons | Best Options |
|---|---|---|---|---|
| 1= | NovoAlign IUPAC | – Large number of mapped reads – High alignment precision and low reference bias – Fast execution | – Requires variation information from target populations – Some options are proprietary– Requires a license to unlock multi-threading and additional functionality | NOV1 NOV2 |
| 1= | BWA aln | – Large number of mapped reads – High alignment precision and low bias | – Slow execution | BWA1 BWA2 |
| 3 | BWA mem | – Large number of mapped reads – High alignment precision and low bias – Fast execution | – Optimized for reads ≥70 bp | BWA8 |
| 4= | NovoAlign | – Large number of mapped reads – Fast execution | – Significant reference bias | NOV2 |
| 4= | Bowtie2 | – High precision if using stringent mapQ filter – Fast execution | – Significant data loss when using stringent mapQ filter – Additional bias in analyses when using stringent mapQ filter – Low sensitivity for contaminants | BWT3 BWT4 BWT5 |
DISCUSSION
The choice of genomic alignment software and parameters is often contingent upon the properties of the genetic material being mapped. For aDNA studies, the short and degraded nature of the genetic material poses a novel challenge for sequence alignment algorithms as the software was developed for longer undamaged DNA fragments from modern specimens.
Our results are consistent with this expectation and demonstrate that in general alignment becomes more difficult as reads become shorter, with decreased precision and fewer mapped reads at lengths typical for aDNA. Moreover, our results show that reference bias tends to increase with declining read length—i.e. as reads become shorter, those carrying alternate alleles become increasingly less likely to correctly align relative to reads bearing reference alleles. Importantly, the application of mapping quality filters improves alignment precision and reduces reference bias of the short read alignments to levels only slightly below that of longer reads. The application of UDG treatments resulted in further improvements in mapping precision and reference bias reduction, though these gains were less substantial for the half-UDG treatment, which is currently the most widely adopted pre-treatment strategy in contemporary aDNA studies. Notably, the two UDG treatments did not result in a large reduction the total number of aligned reads, whereas the application of the mapQ ≥25 filter resulted in a marked reduction in the number of aligned reads that disproportionately affected shorter reads (i.e. a 7 to 10% reduction in the number of mapped <40 nt reads for BWA-mem, BWA-aln and NovoAlign, and a > 20% reduction for Bowtie2 for the same length reads; Figures S6 and S8).
Filtering regions based on CpG islands and low mappability offer further reductions to in reference bias, though improvements from the former are more limited due to comprising only a small proportion of genome. While mappability filters can reduce bias by an additional 1% on top of improvements offered by mapping quality filters and UDG treatments, this is expected to have a limited impact on human aDNA studies that restrict their analyses to a set ~1 million SNPs (assayed using a set of proprietary probes), as >99% of these SNPs lie in regions of high mappability. Nonetheless, both CpG and mappability filters could be important for reducing biases in future aDNA studies that use full genome sequencing.
Recommendations and conclusions
The trade-off between the quality and quantity of mapped reads is ultimately important in how it impacts downstream analyses. In this study, we show that while filtering aDNA reads based on a minimum mapping quality of 25 can improve precision and reduce reference bias on an aggregate SNP-based level, it does not completely eradicate reference bias in downstream analyses, and may even exacerbate this effect (e.g. with the tested Bowtie2 parameterizations). Accordingly, to help guide researchers in choosing alignment strategies for aDNA studies, we provide a visual summary of our core results (Figure 5a and Figures S13 and S14) and a table summary (Table 1) that outline the overall performance across the four different metrics assessed in this study (i.e. precision, SNP-based reference bias, D statistic, PCA) along with the execution time (Figure 5b).
For the parameterizations tested here we find most of the BWA-aln and two of the IUPAC-based NovoAlign parameterizations (including the free default implementation) offer consistently high precision and negligible levels of bias across the two different mapping quality filters and for untreated (Figure 5b) and UDG-treated reads (Figures S13 and S14), suggesting that these methods should generally provide robust results in aDNA studies. Notably, the NovoAlign parameterizations ran at least 10 times faster than BWA-aln counterparts (Figure 5b), providing a significant speed advantage. However, free use of NovoAlign is currently restricted to the default parameterization in single-threaded mode (NOV1 in the current study), limiting exploration of other potential improvements, and reference bias-free implementation requires the creation of a suitable IUPAC-augmented reference genome. The generation of an IUPAC reference requires the input of variant positions based on polymorphisms from a genetic reference panel, which may not be available for many species. When multiple panels are available it also remains unclear how the choice of reference panel, along with decisions on which SNPs to use, impacts the final quality of the alignments. In the present study, we have incorporated all known variants from the 1000 GP, whereby every SNP in our three samples is represented in the IUPAC reference. Consequently, our results likely represent the minimum reference bias that is achievable for NovoAlign using an IUPAC reference, and the results in aDNA studies may not reach similarly low levels.
BWA-mem shows similar levels of performance to both BWA-aln and NovoAlign and has rapid run times comparable to the latter. However, BWA-mem is not optimized for reads shorter than 70 nt which may be prohibitive for highly degraded samples, and also has comparatively low sensitivity for DNA coming from closely related organisms which may further impact analyses if such contamination is present but not properly accounted for. Taken together, if time is not a limiting factor for analyses, our results indicate the widely adopted BWA-aln parameterizations remain the best choice for most aDNA studies. BWA-mem is a good alternative option in cases where time constraints apply and DNA contamination from closely related taxa is not present or can be accounted for, providing that the majority of reads have lengths that exceed 70 nt, otherwise the free NovoAlign parameterization could be used if a suitable IUPAC reference is available or can be generated.
The IUPAC results in the present study highlight the potential for improvements when incorporating known genetic variation into the alignment process, which was recently demonstrated through the use of graph genome representation in aDNA alignments (outperforming standard BWA-aln strategies; [43]). Variation graphs and other graph pangenomes offer a promising alternative mapping strategy to reduce reference bias and increase alignment precision [16]. However, graph genome technologies remain in an early stage of development and currently lack a universally adopted graph coordinate system [44, 45]. A community-wide effort is required to port all existing data to a new coordinate space, along with annotations and associated metadata. In the meantime, linear reference genomes will likely remain the default alignment strategy for aDNA studies, although polymorphism-augmented linear reference genomes clearly merit further research as this technology matures.
Finally, post-alignment processing steps also have a documented effect on variant calling and are sensitive to the choice of mapping software and depth of read coverage [32]. Commonly used post-alignment procedures such as Genome Analysis Toolkit (GATK) [33], ANGSD [46] or more purpose-built toolkits such as ATLAS are used inconsistently across the aDNA field. Accordingly, benchmarking studies are sorely needed to document the efficacy of all processing steps for aDNA to provide a more complete and in-depth understanding of aDNA bioinformatic pipelines.
We systematically evaluated the performance of 30 read mapping strategies using simulated short ancient DNA sequencing reads against the human reference genome.
All strategies exhibited some level of reference bias, with BWA-aln and NovoAlign paired with an IUPAC reference performing the best (least amount of bias).
When accounting for runtime (CPU cost) NovoAlign with IUPAC reference offers the best compromise.
Acknowledgements
We are grateful to Joshua Schmidt, Thomas Litster and two anonymous reviewers for their invaluable suggestions that greatly improved the rigour and scope of our study. We thank the Novocraft Technologies team for providing access to their proprietary NovoAlign software during this project and for helpful discussions on implementation and data interpretation.
Funding
This work was supported by the Australian Research Council [ARC DP190103705]. AO was supported by an ARC PhD Scholarship [ARC IN180100017]. RT was supported by an ARC DECRA Fellowship [ARC DE190101069]. AC was supported by an ARC Laureate Fellowship [ARC FL140100260]. BL was supported by an ARC Future Fellowship [ARC FT170100448].
Data availability
The scripts used to create the used datasets in this study are available in the github repository at: https://github.com/AdrienOliva/Benchmark-aDNA-Mapping.
Adrien Oliva is a PhD candidate at the Australian Centre for Ancient DNA at the University of Adelaide. He researches methods for reducing analytical bias in ancient DNA studies.
Raymond Tobler is a population geneticist and Australian Research Council DECRA Fellow based at the Australian Centre for Ancient DNA at the University of Adelaide. He works on human evolutionary history in Island South East Asia, New Guinea and Australia.
Alan Cooper is a recent Australian Research Council Laureate Fellow specializing in ancient DNA, evolutionary biology and the impacts of environmental change through time.
Bastien Llamas is an Australian Research Council Future Fellow and an Associate Professor based at the Australian Centre for Ancient DNA at the University of Adelaide. He specializes in the analysis of ancient DNA extracted from past humans and extinct animals to address outstanding questions in evolutionary biology.
Yassine Souilmi is an evolutionary genomicist at the Australian Centre for Ancient DNA at the University of Adelaide. He specializes in utilizing large-scale genomic analyses to address evolutionary and medical questions using modern and ancient DNA.
