


Abstract
Aging is the largest risk factor of major human diseases. Long noncoding RNAs (lncRNAs) as the key regulatory elements have shown a strong impact on multiple biological processes as well as human disease mechanisms. However, the roles of lncRNAs in aging/healthy aging processes remain largely unknown. Centenarians are good models for healthy aging studies due to avoiding major chronic diseases and disabilities. To illustrate their ubiquitous nature in the genome and the ‘secrets’ of healthy aging regulation from the perspective of lncRNAs, peripheral blood samples from two regions consisting 76 centenarians (CENs), 54 centenarian-children (F1) and 41 spouses of centenarian-children (F1SP) were collected for deep RNA-seq. We identified 11 CEN-specific lncRNAs that is particularly expressed in longevous individuals. By kmers clustering, hundreds of human lncRNAs show similarities with CEN-specific lncRNAs, especially with ENST00000521663 and ENST00000444998. Using F1SP as normal elder controls (age: 59.9 ± 6.6 years), eight lncRNAs that are differentially expressed in longevous elders (CEN group, age: 102.2 ± 2.4 years) were identified as candidate aging/health aging–related lncRNAs (car-lncs). We found that the expression of eight car-lncs in human diploid fibroblasts displayed dynamic changes during cell passage and/or H2O2/rapamycin treatment; of which, overexpression either of THBS1-IT1 and THBS1-AS1, two lncRNAs that highly expressed in CENs, can remarkably decrease p16, p21 and the activity of senescent related β-galactosidase, suggesting that THBS1-IT1 and THBS1-AS1 can inhibit cellular senescence. We provided the first comprehensive analysis of lncRNA expression in longevous populations, and our results hinted that dysregulated lncRNAs in CENs are potential protective factors in healthy aging process.
Introduction
The life expectancy of the world population is increasing. It is estimated that by 2020, 22% of the world population will be over 60 years old and that this number will reach 29% in 2025, which will lead to a growing number of older individuals acquiring late-life diseases [1, 2]. The social cost of health services will be higher and the financial burden for individuals and society will likewise be greater. Aging is considered the largest risk factor in the development of various diseases such as cardiovascular abnormalities, neurological dysfunctions, immunological disorders, metabolic dysregulation, and cancer [3, 4]. Therefore, a better understanding of healthy aging is of great significance.
Centenarians surpass the current human life expectancy by about 20–25 years and have the ability to escape or postpone major age-related diseases, making them a good model to study human longevity and healthy aging [5–8]. Previous studies indicated that enhanced autophagy–lysosomal function promotes healthy aging in centenarians [9]. Comparative genomic methylation analysis between centenarians and middle-aged controls found that genes with differential DNA methylation regions were stably enriched in age-related diseases, and suppressing these disease-related genes via epigenetic modification may contribute to human longevity [10]. In addition, genes involved in nucleotide biosynthesis, metabolism, and control of signal transmission exhibited different methylation patterns between centenarians’ offspring and offspring of both non–long-lived parents [11]. These studies suggested that DNA methylation is involved in the process of human longevity. However, long noncoding RNAs (lncRNAs), one of the key regulators in a wide range of biological process, include chromatin remodeling, gene transcription, and protein transport, remain unexplored in centenarians and their offspring.
Altered expression of lncRNAs is closely correlated with many diseases such as cancers, cardiovascular pathologies, and neurodegenerative disorders [12, 13]. The dysregulation of many lncRNAs have been identified to play essential roles in senescence, such as in the cases of LincROR [14, 15] and LincRNA-p21 [16]. LncRNA tts-1 in worms is required for life span extension [17]. However, lncRNAs’ expression models in the process of aging and healthy aging remain largely unknown. In this study, we present the first characterization and functional principles of lncRNAs in centenarian families via an integrated transcriptome analysis of 171 individuals consisting of 76 centenarians (CENs), 54 centenarians’ offspring (F1) and 41 spouses of F1 (F1SP) and examined the potential roles of lncRNAs in aging and healthy aging processes.
Results
Expression profiles of lncRNAs in 171 individuals
We collected the peripheral blood (PB) samples of 171 individuals, who consisted of 76 CENs (age: 102.2 ± 2.4 years; gender: 58 females + 18 males), 54 F1 (age: 63.2 ± 7.7 years; gender: 3 females + 51 males) and 41 F1SP (age: 59.9 ± 6.6 years; gender: 40 females + 1 male) from Northern and Southern regions of Hainan province, China. In our previous study, a total of 21 clinical biochemical parameters of blood such as total cholesterol, high density lipoprotein-cholesterol and blood glucose have been tested on our 171 individuals and found that the CENs were healthy with improved lipids, diastolic pressure and kidney function [18]. The 121 specimens that were collected from the Northern region were subjected to poly (A)–enriched sequencing libraries, and the other 50 from the Southern region were processed for ribosomal RNA depletion libraries (ribo-dep) as the ribo-dep method can access lncRNAs that lack a canonical polyA-tail structure. Given that the samples were collected from individuals who lived in two regions and were separately subjected to two types of sequencing libraries, they were divided into two groups (Northern-Hainan, N-Hn and Southern-Hainan, S-Hn) and analyzed separately to eliminate background noise. Considering that RNA transcript resources in the PB are complex, only white blood cells (WBCs) were isolated for sequencing as increasing evidence suggested that the WBCs as well as WBC counts have great connections with aging, aging related diseases and long-term survival [19–22]. We analyzed the cell counts of two major types of WBCs (i.e., lymphocytes, granulocytes) in our blood samples, and no significant differences in the proportion of these cell types were seen among three groups in neither N-Hn nor S-Hn (see Supplementary Figure S1 available online at http://bib.oxfordjournals.org/). Deep RNA-seq profiles (>12G/sample) for the samples were generated using HiSeq (Illumina) platforms (Raw RNA-seq data description, see Supplementary Table S1 available online at http://bib.oxfordjournals.org/).
An evidence-based lncRNA transcript annotation that contains 27 817 lncRNA transcripts from the GENCODE database (V23) [23] was used to define lncRNAs, and Fragments per Kilobase of Exon per Million Fragments Mapped (FPKM) values were calculated to evaluate lncRNA expression levels. LncRNAs with FPKM values higher than 0.1 in ≥4 individuals were retained for further analysis. On average, CENs in both N-Hn and S-Hn regions had a lower number of expressed lncRNAs but slightly higher FPKM values than F1 and F1SP (Figure 1A and B). Compared to S-Hn, N-Hn individuals showed a lower average number of expressed lncRNAs as well as FPKM values (Figure 1A and B). LncRNA distribution and expression in three groups from the two regions are shown in Figure 1E and F through circos plots. Among the N-Hn group, 950 lncRNA genes were specifically expressed in longevous individual(s), with 565 and 467 in F1 and F1SP, respectively (Figure 1C and Supplementary Table S2 available online at http://bib.oxfordjournals.org/). In S-Hn, 1081 particular lncRNAs were detected in CENs, of which only 106 overlapped with the 950 lncRNAs exclusively expressed in CENs from N-Hn (Figure 1D and Supplementary Table S2 available online at http://bib.oxfordjournals.org/).
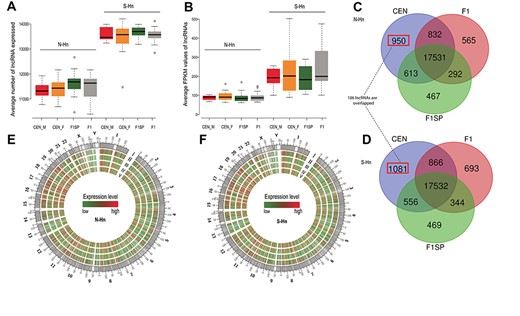
LncRNA features of CEN, F1 and F1SP in two regions. (A and B) Comparisons of the average numbers of lncRNA expressed (A) and average expression level of lncRNAs (assessed by FPKM values) in each group (B): no significant difference was observed among CEN_F (female CEN), CEN_M (male CEN), F1 and F1SP groups in neither N-Hn nor S-Hn, but more lncRNAs with higher expression levels were detected in S-Hn individuals than N-Hn’s; (C and D) Circos plots of average lncRNAs expression levels in four groups of N-Hn (C) and S-Hn (D). I represents chromosome location of human lncRNAs, II, III, IV and V represent CEN (male + female), male CEN, F1SP and F1 groups, respectively; (E and F) Venny diagrams of expressed lncRNAs in CEN, F1 and F1SP groups from N-Hn (E) and S-Hn (F) regions. In N-Hn samples, 17 531 lncRNAs are detected in all three groups, 950 lncRNAs are exclusively expressed in CEN; similar with N-Hn, 17 532 lncRNAs are commonly expressed in CEN, F1 and F1SP groups of in S-Hn, and 1081 lncRNAs are non-expressed in F1 and F1SP. There are 106 lncRNAs unique to CEN groups in both S-Hn and N-Hn.
Features of CEN-specific lncRNAs
There were 106 lncRNAs that were not expressed in any biospecimens from F1 and F1SP, and their expression distributions in CENs indicated that 58.49% (62/106) of them are expressed in one longevous individual, 31.13% (33/106) are expressed in two CENs, and 10.37% (11/106) were detected in ≥4 CENs (Figure 2A and Supplementary Table S3 available online at http://bib.oxfordjournals.org/). These 11 lncRNAs were therefore regarded as CEN-specific lncRNAs—lncRNAs that are non-expressed in any individuals of F1 and F1SP but exhibit specific expression pattern in the CENs of this study (Figure 2B). We blasted the sequences of the 11 CEN-specific lncRNAs against NONCODE database and found six of them including ENST00000521663, ENST00000444998, ENST00000565584, ENST00000510922, ENST00000608432 and ENST00000613389 (blast results, see Supplementary Table S4 available online at http://bib.oxfordjournals.org/) are sharing similar sequences with multiple mammal species like chimpanzee, gorilla, orangutan, mouse and rat (coverage >8%, identity >80%, E-value < 1e−5), suggesting they are conserved lncRNAs. We additionally analyzed lncRNA expression profiles in 16 tissues of illumina human body maps 2 (tissue information details, see Supplementary Table S5 available online at http://bib.oxfordjournals.org/) and found these 11 CEN-specific lncRNAs are barely expressed in human tissues (see Supplementary Table S6 available online at http://bib.oxfordjournals.org/).
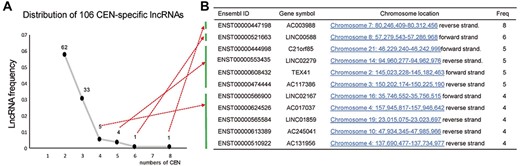
Features of CEN-specific lncRNAs. (A) Distribution of the 106 lncRNAs that particularly expressed in both N-Hn and S-Hn CEN groups: 62 of them are detected in 2 CEN individuals, while 11 lncRNAs express in ≥4 CENs; (B) Description of the 11 CEN-specific lncRNAs.
Since the 11 CEN-specific lncRNAs are only expressed in few numbers of CEN individuals, their FPKM values can’t be used for functional prediction via co-expression analysis. Previous studies demonstrated that lncRNAs of related function often have similar Kmers profiles despite lacking linear homology [24]. We generated Kmers profiles for the 27 817 annotated human lncRNAs (GENCODE database, V23) to cluster with CEN-specific lncRNAs through the SEEKR pipeline [24]. ENST00000521663 and ENST00000444998 were the top lncRNA transcripts that separately cluster with 675 and 125 human lncRNAs with a Pearson’s coefficient r ≥ 0.5 (Table 1 and Supplementary Table S7 available online at http://bib.oxfordjournals.org/). Using the same threshold, ENST00000624526 and ENST00000565584 were clustered with 27 and 6 lncRNA transcripts, respectively (see Supplementary Table S7 available online at http://bib.oxfordjournals.org/). However, the kmers of the other seven CEN-specific lncRNAs showed no similarities to any other human lncRNAs. Although the functions of the hundreds of clustered human lncRNAs are mostly unexplored with regard to aging/anti-aging, many of them, like Ftx [25], SOX2.OT [26], DNM3OS [27], LINC00240 [28] and TARID [29], have been identified to regulate developmental and carcinomatous processes, suggesting that CEN-specific lncRNAs may associate with development and/or cancer biology which still need exploration.
Top 10 genes that separately clustered with ENST00000521663 and ENST0000044998 by Kmer analysis
| CEN-specific lncRNA | Kmer-clustered lncRNA | Pearson’s r |
|---|---|---|
| ENST00000521663 | ENST00000609803 | 0.7073 |
| ENST00000521663 | ENST00000503488 | 0.6984 |
| ENST00000521663 | ENST00000569460 | 0.6982 |
| ENST00000521663 | ENST00000607607 | 0.6872 |
| ENST00000521663 | ENST00000503073 | 0.6779 |
| ENST00000521663 | ENST00000561632 | 0.6741 |
| ENST00000521663 | ENST00000621546 | 0.6725 |
| ENST00000521663 | ENST00000623249 | 0.6888 |
| ENST00000521663 | ENST00000566446 | 0.6659 |
| ENST00000521663 | ENST00000563003 | 0.6651 |
| ENST0000044998 | ENST00000432735 | 0.9903 |
| ENST0000044998 | ENST00000421927 | 0.9659 |
| ENST0000044998 | ENST00000608229 | 0.5981 |
| ENST0000044998 | ENST00000562617 | 0.5811 |
| ENST0000044998 | ENST00000626826 | 0.5791 |
| ENST0000044998 | ENST00000433310 | 0.5759 |
| ENST0000044998 | ENST00000624969 | 0.5717 |
| ENST0000044998 | ENST00000537616 | 0.5701 |
| ENST0000044998 | ENST00000623833 | 0.5688 |
| ENST0000044998 | ENST00000428709 | 0.5679 |
LncRNAs with potential inheritable expression models
Human longevity often clusters in families enriched in long-lived parents and ancestors like centenarians. Previous studies have demonstrated that about 25% of variation in human longevity is due to genetic factors [30, 31]. Familial effects on life span have also been estimated from population-based studies of Danish, Swedish and Finnish twins, which indicated that life span tends to be less correlated in dizygotic than monozygotic twin pairs [32–35]. To identify lncRNAs that possibly play roles in heritable longevity between CEN and F1 in two groups, we separately compared the lncRNAs expression of CEN and F1 with F1SP. Candidate lncRNAs with potential inheritable expression models were screened out following the workflow that was shown in Figure 3A. Considering all biospecimens were collected from healthy individuals, elders of ‘longevous vs non-longevous’ may not exhibit as distinct expression patterns as ‘diseases vs controls’. Hence, a relax threshold (false discovery rate, FDR < 0.1) was employed to obtain differentially expressed lncRNAs (DElncRNAs).
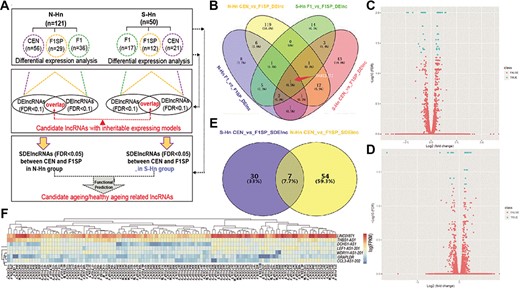
Identification of candidate aging/heathy aging-related lncRNAs (car-lncs). (A) Workflow of analyzing lncRNAs in 171 individuals from longevous families; (B) Venny diagram of DElncRNAs (FDR < 0.1) among different groups and regions (‘N-Hn CEN_vs_F1SP_ DElnc’ means DElncRNAs between CENs and F1SP in N-Hn region, and so on). F1SP as the controls were compared separately with F1s and CENs to get DElncRNAs. In N-Hn region, nine lncRNAs are dysregulated in both F1 and CEN comparing with F1SP group; using the same method, seven dysregulated lncRNAs were found in S-Hn individuals, of which one lncRNA is overlapped with N-Hn’s; (C and D) Volcano plot of lncRNAs expression by comparing CEN and F1SP in N-Hn (C) and S-Hn (D): blue spots are SDElncRNAs; (E) Venny diagram of SDElncRNAs (FDR < 0.05) between CEN and F1SP in N-Hn and S-Hn regions: 61 SDElncRNAs were identified in N-Hn samples and 41 in S-Hn, among which 7 lncRNAs are overlapped; (F) Heatmap was plotted to visualize the expression of 7 overlapped SDElncRNAs in the blood samples of individuals: 100 randomly selected individuals (the number that ahead of ‘_CEN/F1/F1SP’ is a serial number for each sample; ‘F’ and ‘M’ means female and male, respectively). The deeper red indicates higher expression, while the deeper blue indicates lower expression levels.
In the N-Hn group, 141 and 25 DElncRNAs were separately found in CEN and F1 when compared to F1SP, 9 of which overlapped. These nine lncRNAs exhibited the same dysregulated expression tendencies in CEN and F1; four were expressed higher and five were lower in both CEN and F1 when compared to F1SP (Figure 3C and Supplementary Table S8 available online at http://bib.oxfordjournals.org/). It indicated that they might be candidates with potential inheritable expression models in longevous populations, since they exhibit the same pattern of expression in centenarians and their offspring. Using the same method, we found seven overlapped DElncRNAs in the S-Hn group that show possible heritability between F1 and CEN (Figure 3C and Supplementary Table S8 available online at http://bib.oxfordjournals.org/), of which one lncRNA (THBS1-IT1) also surprisingly existed in the candidates of N-Hn group. Multivariate analysis of variance (MANOVA) was used to calculate the influence of gender bias on the expression of these overlapped DElncRNAs and found four of them were significantly affected by sexual difference (P < 0.05) (see Supplementary Table S8 available online at http://bib.oxfordjournals.org/).
THBS1-IT1 is an intronic-lncRNA that is transcribed from the gene body of THBS1, expressing higher in both CEN and F1 than F1SP. Recent studies showed that THBS1 regulates senescence escape in triple-negative breast cancer following chemotherapy treatment [36]. Longevity and improved cardiac aging, as well as up-regulated expression of THBS1, were observed in NLRP3 knockout male mice [37]. Q-RT–PCR assays validated that THBS1-IT1 express significantly higher in CEN and F1 than F1SP in both N-Hn and S-Hn groups (see Supplementary Figure S2 available online at http://bib.oxfordjournals.org/).
Significant differentially expressed lncRNAs in CENs
The most significantly differentially expressed lncRNAs (SDElncRNAs) in CENs were identified using the pipeline shown in Figure 3A. In N-Hn group, 61 lncRNAs were expressed significantly differently (FDR < 0.05) in CENs compared to normal elder controls (F1SP). The expression of 37 lncRNAs in the S-Hn group likewise differed from normal elder controls (Figure 3E and Supplementary Table S9 available online at http://bib.oxfordjournals.org/). Among these SDElncRNAs, seven overlapped in both the N-Hn and S-Hn groups (Figure 3E and F), including three up-regulated (LINC01871, THBS1-AS1, CCL3-AS1-202) and four down-regulated genes (DCHS1-AS1, LEF1-AS1-201, WDR11-AS1-201, and GRAPLDR) in CENs. The blood cDNA samples of individuals from CEN, F1SP and F1 groups were pooled separately for q-RTpcr validation (see Supplementary Figure S2 available online at http://bib.oxfordjournals.org/).
Functional prediction of lncRNAs by co-expression analysis
Co-expression analysis was performed on THBS1-IT1 and seven SDElncRNAs and found that six of them are strongly co-expressed with other genes (|r| > 0.7) (see Supplementary Table S10 available online at http://bib.oxfordjournals.org/). We noticed that THBS1-IT1 and THBS1-AS1, which were highly expressed in CENs, were strikingly co-related with their domestic protein coding gene, THBS1 (Figure 4A). DCHS1-AS1, a highly conserved lncRNA that is transcribed from antisense DCHS1, positively and intensively co-expressed with 808 genes (r > 0.7) and negatively with 40 genes (r < −0.7) (see Supplementary Table S10 available online at http://bib.oxfordjournals.org/). Dchs1 is an atypical cadherin and an evolutionarily conserved regulator of planar cell polarity [38]. Previous studies indicated that DCHS1 gene plays multiple roles in embryogenesis and degenerative diseases like mitral valve prolapse [39]. WDR11-AS1-201 exhibited co-expression with Cttn, which encodes the actin-binding protein cortactin [40]. Unlike THBS1-AS1, DCHS1-AS1 and WDR11-AS1-201, genes that strongly related with LEF1-AS1-201 and LINC01871 were noncoding RNA genes. LEF1-AS1-201 positively coexpressed with LOC100996385 and LINC01871 negatively related to Kcnq1ot1 (Figure 4A). Kcnq1ot1 is a lncRNA whose suppressed expression is highly relevant to aging-related diseases such as type 2 diabetes, atherosclerosis and myocardial infarction [41, 42]. The other two SDElncRNAs (CCL3-AS1-202 and GRAPLDR) did not exhibit strong correlations with any genes. A total of 1261 genes (see Supplementary Table S10 available online at http://bib.oxfordjournals.org/) that closely associated (|r| > 0.7) with the 6 lncRNAs were clustered into Gene Ontology (GO) terms and KEGG pathways, and we found that the most abundant pathways (terms) are metabolic pathways, mitochondria-related and aging degeneration diseases like Alzheimer’s and Parkinson’s diseases (Figure 4B). As increasing studies support that cis-acting LncRNAs can regulate expression of nearby protein-coding genes [43–45], we recruited the genes that locate within 100 Mb upstream or downstream of the eight lncRNAs (gene list, see Supplementary Table S11 available online at http://bib.oxfordjournals.org/), and their co-expression analysis results were included in Supplementary Table S10 available online at http://bib.oxfordjournals.org/.
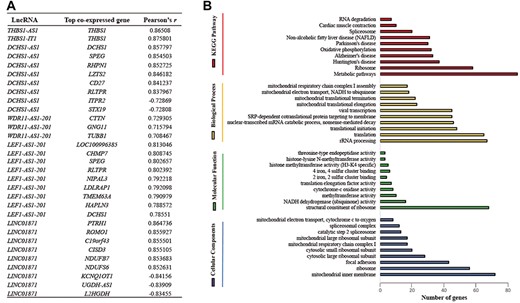
Functional prediction of DElncRNAs by co-expression analysis. (A) List of the top co-expressed genes (ranking by Pearson’s r); (B) Histogram presentation of the most abundant Gene Ontology (GO) terms and KEGG pathways assigned to the 1261 genes that strongly (|r| > 0.7) co-expressed with 6 SDE (DE) lncRNAs.
Recent studies implicated that LINC01871 is a potential mediator of the dysregulated T-cell inflammatory response pathways in Sjögren’s syndrome pathogenesis [46] and the dysregulated expression of LEF1-AS1 is associated with multiple cancers’ progression [47, 48]. Although functions of the SDElncRNAs in aging are still unknown, our co-expression analysis found that their co-expressed genes are strikingly enriched in aging and metabolisms, suggesting that these dysregulated lncRNAs are possibly involved in aging and/or healthy aging processes.
Dynamic expression of candidate healthy aging-related lncRNAs in human diploid fibroblasts
We performed MANOVA analysis to evaluate the effects of grouping and gender difference in the expression of eight lncRNAs include seven SDElncRNAs and THBS1-IT1. Weaker influence of gender than grouping effects was found (see Supplementary Table S12 available online at http://bib.oxfordjournals.org/). The expression of these eight lncRNAs has shown low association (r2 < 0.1) with age (see Supplementary Figure S3 available online at http://bib.oxfordjournals.org/). We hypothesized that these eight lncRNAs are candidate aging/healthy aging-related lncRNAs (car-lncs) in centenarians. To gain a wider knowledge of eight car-lncs’ expression models, we plotted their expression in the 16 tissues of illumina human body maps 2 and found 7 of them exhibited distinct tissue-specific expression (see Supplementary Figure S4 available online at http://bib.oxfordjournals.org/). CCL3-AS1-202 was not detected (FPKM = 0) in any of the 16 tissues.
To explore their functions in cellular senescence process, we first detected their cellular sub-localization in a human diploid fibroblasts (HDF) cell line, HEL-1, with Actin and Neat1 employed as controls. HDF cease growth in culture after a finite number of population doublings (PDs) [49] and express a neutral senescence-associated β-galactosidase activity (SA-β-gal) along with the event of senescence, making them good models for cellular replicative senescence study [50]. Increasing evidence supports that lncRNAs display diverse subcellular distribution patterns and exhibit distinct regulatory effects at their particular site of action [51, 52]. Our results found that DCHS1-AS1 and LEF1-AS1-201 are expressed in both the nucleus and cytoplasm, while the other six lncRNAs, especially GRAPLDR, are mostly detected in nucleus (Figure 5A), suggested the eight car-lncs may participate in molecular regulations via different ways.
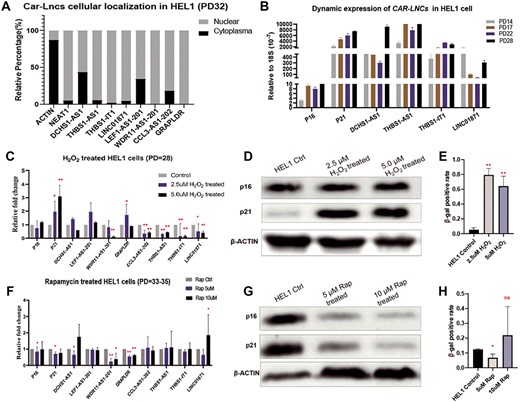
Dynamic expression of eight car-lncs in HEL-1 cells. (A) Subcellular localization of eight car-lncs in HEL-1 cells, and Neat 1 and Actin were employed as nuclear and cytoplasm controls, respectively; (B) the expressions of THBS1-IT1, THBS1-AS1, LINC01871, DCHS1-AS1 as well as p16 and p21 in HEL-1 cells change dramatically from PD14 to PD28; (C–E) Expression of p16, p21 and eight car-lncs in H2O2-induced senescence cells (C): in H2O2-treated cells, CCL3-AS1-202 and p21 express significant higher, while GRAPLDR, THBS1-IT1, THBS1-AS1, DCHS1-AS1 and LINC01871 are down-expressing than controls; (D): p21 protein is higher in H2O2-treated HEL-1 cells by western blot; (E) H2O2 treatment induced higher levels of β-gal activity. (F–H) Expression of p16, p21 and eight car-lncs in HEL-1 cells with rapamycin treatment (F): comparing with controls, p16, p21 and DCHS1-AS1 express lower while WDR11-AS1-201, LINC01871 and GRAPLDR have higher expression in HEL-1 cells that treated with 5 or 10 μM rapamycin; rapamycin inhibited the p16, p21 protein (G) as well as β-gal activity (H).
p16 and p21 are two key regulators involved in different pathways of cellular senescence, and increasing studies support that they can identify senescent cells, thus were utilized as biomarkers of cell aging [53–55]. We found that the expression of p16, p21, DCHS1-AS1, THBS1-IT1, THBS1-AS1 and LINC01871 changed dynamically from early (PD14) to mid PD (PD28) of HEL-1 cells (Figure 5B). With increasing PDs, p16, p21, THBS1-IT1 and THBS1-AS1 expression gradually became higher than their expression in the earlier PDs, while LINC01871 exhibit a ‘u’-shaped change (Figure 5B). DCHS1-AS1 was basically downexpressed in later PDs than earlier ones (Figure 5B). CCL3-AS1-202, GRAPLDR, LEF1-AS1-201, and WDR11-AS1-201 had relatively lower background expression than the other genes and showed slight but not significant changes during the HEL-1 passages (data not shown). In another type of HDF, IMR90 cells, significant overexpression was observed in p16, THBS1-IT1, THBS1-AS1, DCHS1-AS1, LINC01871, LEF-AS1-201 and GRAPLDR during the transition from mid (PD36) to late PD (PD43) (see Supplementary Figure S5 available online at http://bib.oxfordjournals.org/).
In the past decades of aging study, H2O2 has been the most commonly used inducer for stress-induced premature senescence (SIPS), which shares features of cellular replicative senescence [56]. In our study, we observed some similarities between natural cellular passages/senescence (NCPS) and H2O2-induced SIPS, such as the variations of expression of p16, p21 and LINC01871 (Figure 5C–E). In cases of both NCPS and SIPS, p16 and p21 were consistently overexpressed, while LINC01871 was downexpressed, which indicated that LINC01871 may stand at the reversed side against p16 and p21 in cell aging process though more clues are needed to be explored. On contrary to p16, p21 and LINC01871, we found the changes of expression of THBS1-IT1 and THBS1-AS1 are opposite in the two scenarios—they were overexpressed in NCPS but significantly decreased in SIPS (Figure 5C–E), demonstrated that they are possibly playing different roles in responding to natural and induced cellular senescent processes. Although DCHS1-AS1 showed lower-consistent variation trend than other lncRNAs in the process of NCPS, its slight but not significant ‘n’-shaped changes in SIPS suggested that DCHS1-AS1 may be involved in aging process via a more complicated way.
Rapamycin, an inhibitor of mTOR signaling that has been demonstrated to pharmacologically suppress cellular senescence [57], was employed to reverse the cellular senescence. In HEL-1 cells treated with 5 uM rapamycin, we found a lower rate of β-gal–positive cells and lower expression of p16 and p21 protein (Figure 5F–H), revealing that cell aging level was reversed by the drug. Along with p16 and p21, three lncRNAs include WDR11-AS1-201, GRAPLDR, and DCHS1-AS1 and showed significantly decreased expression levels (Figure 5F–H), suggested that they may relate with rapamycin triggered anticellular aging process.
We observed that treatment of higher dosage of rapamycin (10 uM) has not changed the β-gal levels (Figure 5H) but significantly decreased the expression of p16 and p21 protein (Figure 5G). Interestingly, similar phenotypes were found in cells overexpressing LINC01871. Although β-gal is a widely used experimental marker, senescence is reflected in the phenotypic changes of different organelles, and the molecular mechanism of cellular senescence involves p16- and p53-mediated pathways and telomere shortening [58]. Therefore, we tended to believe that ‘nonsignificant change of β-gal’ not equals to ‘unchanged molecular regulations’ in this scenario. In this study, we selected to test aging involved hall-markers (p16 and p21) rather than the strongly co-expressed genes of eight car-lncs is to gain aging-related molecular clues that behind the senescent phenotypes. Taken together, these results suggested that car-lncs, especially DCHS1-AS1, LINC01871, THBS1-IT1, and THBS1-AS1, are dysregulated during NCPS as well as the processes of induced and inhibited cell aging.
Overexpression of THBS1-IT1/THBS1-AS1 attenuates cellular senescence
To further explore the association between car-lncs and aging, we generated lentivirus transfected HEL-1 cell lines that separately overexpressed each lncRNA using pCDH-CMV-puro-GFP vectors (Figure 6A). Interestingly, we found that overexpression of either THBS1-IT1 (pCDH-THBS1-IT1) or THBS1-AS1 (pCDH-THBS1-AS1) in HEL-1 cells can remarkably inhibit p16 and p21 protein as well as the β-gal–positive rate, indicating that up-regulating THBS1-IT1 or THBS1-AS1 can attenuate cellular senescence (Figure 6B–D). Compared to the controls (pCDH-Ctr), overexpression of GRAPLDR (pCDH-GRAPLDR) enhanced the expression of p16 and p21 protein. Conversely, LINC01871 overexpression (pCDH-LINC01871) significantly reduced p21 (Figure 6B). However, overexpression of neither GRAPLDR nor LINC01871 changed the activity of β-gal (Figure 6C). To further validate the roles of THBS1-IT1 and THBS1-AS1 in aging processes, we overexpressed these genes in IMR90 cells and observed significantly diminished β-gal activity in pCDH-THBS1-AS1 (see Supplementary Figure S6 available online at http://bib.oxfordjournals.org/), whereas pcDH-THBS1-IT1 showed a slightly but not significantly lower phenotype than pCDH-Ctr (see Supplementary Figure S6 available online at http://bib.oxfordjournals.org/). In addition, in IMR90 cells that treated with H2O2/rapamycin, p16, p21, THBS1-IT1, and THBS1-AS1 exhibited phenotypes similar to HEL-1 cells (Figure S7), which further supported that these two lncRNAs are involved in regulating cellular replicative senescence as well as in the process of induced/inhibited cell aging (see Supplementary Figure S7 available online at http://bib.oxfordjournals.org/). THBS1-IT1 is highly expressed in CENs, while THBS1-AS1 is overexpressed in both CENs and F1s than F1SPs. Based on our results that overexpression of either of them can decrease cellular senescence, we inferred that their high expression in blood might be the protective elements in CENs.
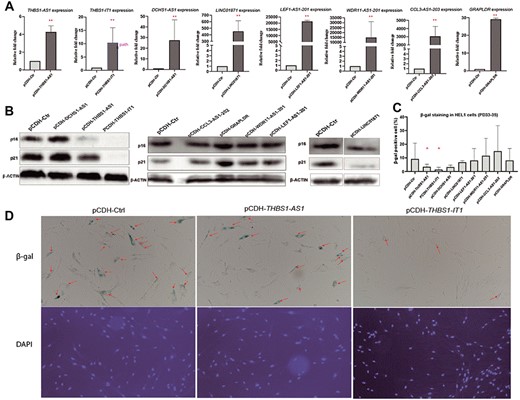
Overexpressing of the eight car-lncs in HEL-1 cells show that higher expression of THBS1-IT1 and THBS1-AS1 can attenuate cellular senescence ((pCDH-ctr: control, pCDH-THBS1-IT1: THBS1-IT1-stable-overexpression cell, and so on) (A): Q-RT–pcr results of eight car-lnc-overexpressing stable cell lines; (B): western blot results of p16 and p21 in eight car-lnc-overexpressing stable cell lines indicate that overexpression of either THBS1-IT1, THBS1-AS1 or LINC01871 significantly decrease the p16 and p21 protein; however, GRAPLDR overexpression promote p16 and p21 protein levels; (C): Decreased β-gal activity was observed in THBS1-IT1/THBS1-AS1-overexpressing cells. (D): Images of β-gal staining and DAPI staining in controls and THBS1-IT1/THBS1-AS1-overexpressing cells. DAPI staining was utilized to dye live and dead cells for counting total cell numbers: red arrow points to β-gal–positive cell.
Since our co-expression analysis predicted that the THBS1-AS1 and THBS1-IT1 are associated with their nearest gene THBS1—a key modulator of endoplasmic reticulum (ER) stress, we tested the variations of THBS1, and four indicators of ER stress response include CHOP, Atf6, BIP and sec61A under the condition of overexpressing THBS1-AS1 and THBS1-IT1 to explore their association with ER-stress signaling. We also tested p53 to gain a better understanding of what genes are involved in THBS1-AS1/THBS1-IT1–related anti-aging process. In IMR90 cells overexpressing THBS1-AS1, the expression of Atf6 was decreased, while CHOP and sec61A were increased. The same changes were observed as well in the scenario of THBS1-IT1. In addition to this, we surprisingly found that THBS1-IT1 can also up-regulate THBS1-AS1 expression and down-regulate THBS1, p53 and BIP (please see Supplementary Figure S8 available online at http://bib.oxfordjournals.org/). ER stress is a highly conserved signaling pathway that fulfills multiple cellular functions and plays vital roles in cell life, death decision and aging [59, 60]. It has been elucidated that the thrombospondin (Thbs) proteins especially Thbs1 and Thbs4 are resident effectors of an adaptive and protective ER stress response [61]. The four ER stress indicators that we have tested in this study are key regulators and sensors of three unfolded protein response (UPR) signal transducers of ER stress, their complex modulations in UPR together with the Thbs-dependent ER-stress respond are determining and maintaining the cellular homeostasis [62, 63]. Our tests demonstrated that THBS1-IT1 and THBS1-AS1 are involved in the intricate process of ER stress response. The dysregulation of ER stress related indicators together with the remarkable changes of p53, p21 and p16 that have been found in cells overexpressing THBS1-IT1 suggested that THBS1-IT1 is an essential lncRNA that possibly plays multiple roles in biological process.
THBS1-IT1 and THBS1-AS1 are highly expressed in CENs, and our results have shown that overexpression of either of them in HEL-1 cells can separately decrease cellular senescence, suggesting that they play some role in anti-aging and might have some potential to be healthy aging protective factors in CENs.
Discussion
In this study, PB samples collected from N-Hn and S-Hn regions of centenarians’ families were subjected to poly-A enriched and ribo-dep sequencing libraries, respectively. Possibly due to the ribo-dep libraries’ ability to acquire lncRNAs that lack canonical polyA-tail structures as well as those samples were collected from two regions and owing different group sizes, the S-Hn group exhibited a larger number of expressed lncRNAs with higher average expression levels (Figure 1A and B).
Gender bias is an element that affects the identification of dysregulated lncRNAs among CEN, F1 and F1SP groups. Consistent with the sex ratio in general CEN populations elsewhere [64], the CENs we recruited consist of more females than males (ratio approximate to 3:1). In our pilot testing, we firstly compared female CENs with female F1SP and found the lists of dysregulated lncRNAs were similar to the results in which 18 male CEN and 1 male F1SP were included (see Supplementary Table S13 available online at http://bib.oxfordjournals.org/). In order to gain the candidate healthy aging-related lncRNAs that were shared in CEN individuals of both male and female, we generally pooled all CENs as one group and compared it with all F1SPs. For the comparison between F1 and F1SP, our goal is to find lncRNAs with potential inheritable expression model. The average ages of F1s and F1SPs are close, so we assumed that two essential factors which include the differences of longevous potential and gender bias are determining the identification 432 of DElncRNAs (FDR < 0.1). To minimize the gender bias, we only focused on those DElncRNAs that also differentially expressed in ‘CEN vs F1SP’ as the majority of CENs and F1SPs are female.
To illustrate lncRNA features in older people, we investigated lncRNAs that only expressed in the CEN group. We found 950 and 1081 lncRNAs that specifically expressed in the CEN individual(s) of N-Hn and S-Hn, respectively. Possibly due to the population difference and the differences of two sequencing library types, only 106 lncRNAs were completely non-expressed in any individual of F1 and F1SP. Finally, the 11 lncRNAs that detected in ≥4 CEN individuals were identified as CEN-specific lncRNAs. The Kmers clustering analysis revealed hundreds of human lncRNAs sharing similar Kmers content with CEN-specific lncRNAs, especially ENST00000521663 and ENST00000444998, and many of the clustered human lncRNAs have been identified to play key roles in tumorigenesis. Recent studies have shown that ENST00000521663, the only transcript of LINC00588, sponges miRNA-1972 and regulates the progression of Osteosarcoma [65]. ENST00000444998 is an isoform of the gene MCM3AP-AS1, which is the only CEN-specific lncRNA that was completely undetected in F1SP and F1 groups but widely expressed in normal tissues from resources of NONCODE database [66] (data not shown). Increasing evidence has revealed that MCM3AP-AS1 is an oncogene/tumor suppressor; it can promote/inhibit tumor growth via targeting miRNAs [67, 68]. The functions of these lncRNAs in aging/anti-aging regulation remain unknown, and our results provide a more comprehensive view of which lncRNAs might be functionally related to CEN-specific lncRNAs.
Further decoding analysis of the lncRNAs revealed eight car-lncs that are particularly dysregulated in CENs and/or F1 compared to F1SP. To explore their association with aging/healthy aging, we generated stable HEL-1 cell lines that separately expressed higher levels of car-lnc and tested the capacity of p16, p21 and β-gal. The level of β-galactosidase (β-gal) in lysosomes increases significantly in senescent cells and is thus widely used as an experimental marker [69]. Considering that aging is a complex interplay of signaling pathways and the β-gal–negative cells in some certain cases are positively expressing other biomarkers of senescence [70], we applied p16 and p21 as extra aging markers to better evaluate the changes of cell aging levels during the treatments of H2O2/rapamycin and the overexpression of eight car-lncs. p16 and p21 are key regulators of two axes, including p53-p21 and p16-Rb, which participate in both replicative and stress-induced cellular senescence [71]. p21 is a p53 target gene and has often been considered critical for establishing senescence, whereas p16 may be more involved in the maintenance of the phenotype [71]. Although the roles of p16 and p21 in aging are complicated and not fully uncovered, increased expression of p16 or p21 has been used as a surrogate marker of senescence [72]. Forced expression of either THBS1-IT1, THBS1-AS1 or LINC01871 in HEL-1 cells can robustly reduce production of p16 and/or p21 proteins; however, overexpression of GRAPLDR induces an increase in p16 and p21. THBS1-IT1, THBS1-AS1 and LINC01871 are more highly expressed in longevous elders (CENs) than normal elders (F1SP), and their overexpression in HDF inhibited cellular senescence markers, which suggested that their up-regulation might be associated with the healthy aging process of CENs. Conversely, GRAPLDR is a low-expressed lncRNA in CENs, and its overexpression exhibited effects opposite to THBS1-IT1, THBS1-AS1 and LINC01871, indicating that high expression of GRAPLDR is a potential risk factor in inducing aging. In addition, the rates of β-gal–positive cells were significant lower in pCDH-THBS1-IT1 and pCDH-THBS1-AS1 than controls. β-gal activity has been the most extensively utilized biomarker for the detection of cellular senescence [73]. Our results therefore demonstrated that overexpression of THBS1-IT1 or THBS1-AS1 can attenuate cellular senescence. We also attempted to silence THBS1-IT1 or THBS1-AS1 using short hairpin RNAs in HEL-1 cells; however, the cells became unstable and unhealthy for unknown reasons (data not shown). Moreover, similar lower β-gal activity was observed in IMR90 cells overexpressing THBS1-AS1, indicating that THBS1-AS1 can also decrease cellular senescence of IMR90 cells.
To explore the potential genes that related with THBS1-AS1 and THBS1-IT1, the expression of THBS1 was tested in IMR90 cells. No significant alteration was observed when THBS1-AS1 was overexpressed; however, THBS1 was significantly decreased in the case of overexpressing THBS1-IT1. The co-expression analysis based on the blood samples of centenarians’ families predicted that they are positively co-expressed with THBS1; however, THBS1 didn’t show any change in response to the overexpression of THBS1-AS1, and an opposite correlation was observed for THBS1-IT1. We hypothesized that the mediations among THBS1-AS1, THBS1-IT1 and THBS1 are complicated and probably varied in different systems at multiple dimensions.
Increasing evidence has suggested that cellular senescence is a potential target for preventing or treating multiple age-related diseases and increasing healthy life span [74]. In recent studies, multiple lncRNAs like Linc-ASEN and SENEBLOC [75, 76] have been identified as promoters or repressors in cellular senescence, and many of them are involved in up-regulating/down-regulating the expression of p21, p53 and/or 16 proteins.
In this study, changes of these key cellular senescence indicators observed as well under condition of overexpressing the car-lncs, which suggested that the dysregulated lncRNAs in longevous group are candidate regulators of cellular senescence and furtherly supported that cellular aging is greatly associated with human longevity.
In the past decade, hundreds of lncRNAs have been identified as aging-related lncRNAs such as NEAT1 [77], PLCD3-OT1 [78], SNHG12 [79] and LincRNA-p21 [80], which have greatly enriched our knowledge to noncoding RNA world in the aging field. Sailing from the perspective of exploring why centenarians rarely get illness, our study implicated that some dysregulated lncRNAs such as THBS1-IT1 and THBS1-AS1 are protective factors of cellular senescence and have the potential to be utilized in clinical trials.
Materials and Methods
Sample collection and sequencing
PB samples were harvested and sequenced as previously described [9]. Briefly, all the samples were harvested and transferred immediately to EDTA-coated tubes for anti-clotting. WBCs were then extracted by spinning at 4000 rpm for 10 min after treatment of red blood lysis buffer (Tiangen) and removal of plasma and serum. WBC samples were stored in liquid nitrogen. Total RNA was isolated by Trizol. Two types of RNA sequencing libraries based on poly (A)–enriched and ribosomal RNA depletion methods were prepared. 121 samples were subjected to the first method, while the other 50 samples were subjected to the second one. Libraries were prepared following the manufacturer’s instructions (KAPA, USA) and sequenced on the Illumina HiSeq 2000 platform or Illumina HiSeq 4000 platform. Data are described in Supplementary Table S1 available online at http://bib.oxfordjournals.org/. The research protocol was approved by the Ethics Committee at Kunming Institute of Zoology, Chinese Academy of Sciences. Written informed consent was obtained from each of the participants prior to the study.
LncRNA analysis
We filtered raw reads with SolexaQA software [81], then mapped clean data to the human genome (hg19) via Tophat2 [82] and retained the reads with unique alignment hits. The FPKM values of 27 817 human lncRNA transcripts that were acquired from the GENCODE data base (v23) were calculated in each individual using cuffdiff/cuffnorm command of Cufflinks packages with default parameters [83]. The same pipeline was utilized for analyzing the raw pair-end data of illumina human body map 2.
As the 121 samples of N-Hn group were sequenced by two platforms (63 samples for Hiseq2000 and the others for Hiseq4000), we performed batch-effect removal analysis via SVA package [84] for the intra-group analysis of N-Hn (see Supplementary Figure S9 available online at http://bib.oxfordjournals.org/). Considering that S-Hn samples were collected from one region (Wanning, Hainan, China), sequenced in a uniform platform (Hiseq 4000) and our PCA analysis suggested that S-Hn data exhibit non-observable clustering (Figure S10), batch effect removal analysis wasn’t applied to S-Hn data.
By assessment of FPKM values, 106 lncRNAs that were expressed (FPKM >0.1) particularly in CENs of both N-Hn and S-Hn regions and completely non-detected (FPKM = 0) in any individual of F1 and F1SP groups were identified as potential CEN-specific lncRNAs. By plotting their distribution in CEN individual(s), we found 11 of them can be detected in ≥4 individuals and were finally regarded as CEN-specific lncRNAs.
For the identification of DElncRNAs and SDElncRNAs, we firstly compared female CENs with female F1SP. Results were similar with ‘all CENs vs all F1SPs’ (see Supplementary Tables S9 and S11 available online at http://bib.oxfordjournals.org/). Hence, we generally pooled all the CENs together and compared with all F1SPs in each region. We utilized cuffdiff command with FDR function in the Cufflinks packages to calculate FDR value among groups [83]. LncRNAs with FDR < 0.1 and FDR < 0.05 were defined as DElncRNAs and SDElncRNAs, respectively.
MANOVA by R platform was applied to evaluate the influences of gender bias and/or grouping on the expression of DElncRNAs and eight car-lncs. Cell compositions of blood samples were analyzed by one-way analysis of variance (ANOVA). Linear regression analysis was employed to assess the association between age and the expression of eight car-lncs.
Co-expression analysis and functional clustering
The co-expression analysis between lncRNAs and mRNA was performed as described in our previous studies [85, 86]. Briefly, FPKM values from 171 individuals were utilized for the analysis and Pearson’s coefficient r was used for assessing the correlation by in-house R script. Genes that show strong correlation (|r| > 0.7) with P-values < 0.01 were subjected for functional clustering by ‘database for annotation, visualization and integrated discovery’ (DAVID) [87] with default parameters.
Kmers clustering analysis
Kmers profiles (k = 4) of lncRNAs were generated and clustered following the SEEKR pipeline [24] with default parameters.
Cell culture
The HEL-1 cells were kindly donated by Dr. Xudong Zhao lab, Kunming Institute of Zoology, Chinese Academy of Sciences, and the IMR90 cells were purchased from American Type Culture Collection. HEL-1 and IMR90 cells were cultured in EMEM media with 10% fetal bovine serum and 1% penicillin/streptomycin (p/s). Cells were counted at each passage by an automated cell counter (Bio-Rad) for accumulating PD. Approximate 10 [6] cells were seeded on 10 cm (diameter) plates every 5 days. The PD for each passage was calculated using the equation: PD = log2(NH/NI), where NH is the cell number of harvests and NI is the plating cell number. Cumulative PDs were summed by PD, and cells that we got first were considered as PD = 0.
Cellular sublocalization assay
Cells were harvested and washed with PBS for two times. Resuspend cell pellets and treat them with lysis buffer A on ice for 8 min. Centrifuge the preparation for 8 min at 2000g then carefully transfer the cytoplasmic fraction (the supernatant) to a new tube. Add 300 μl lysis buffer B to the bottom nucleus residue and incubate for 8 min on ice, then resuspend the nucleic fraction. Nucleus and cytoplasm fractions were treated with TRIzol reagent (11667165001, Invitrogen), for qRT–PCR test. Lysis buffer A contains 100 mM Tris–HCl, 100 mM NaCl, 2.5 mM MgCl2 and 40 μg/ml digitonin. The same components of buffer A plus 0.5% Triton X-100 is the recipe of lysis buffer B.
H2O2/rapamycin treatment
Cells were planted overnight on six well plates following with H2O2/rapamycin (H1009/V900930, Sigma, USA) treatment for 48 h. Cells were then harvested on ice and stored in TRIzol solution (11667165001, Invitrogen) for subsequent RNA isolation.
Stable cell lines generation
To generate stable overexpressing cell lines, full cDNA sequences of candidate lncRNAs were inserted separately into commercial pCDH-CMV-puro-GFP vectors, then transfected to the HEL-1 cells via lentivirus. Cells infected with blank pCDH-CMV-puro-GFP were used as controls. Puromycin (Cat#A1113803, Invitrogen, USA) was utilized for sorting cells. All the stable cell lines–related assays were completed within five passages after infection.
Quantitative RT–PCR (qRT–PCR)
Total RNA from cells and blood samples were extracted using TRIzol reagent (Cat#11667165001, Invitrogen, USA), followed by treatment of DNase I (EN0521, Thermo Scientific, MA, USA). Reverse transcription was performed with iScript™ One-Step RT–PCR kit (Bio-rad, USA) according to the manufacturer’s protocol. Q-RT–PCR with gene-specific primers was performed using iTaq™ SYBR Green Supermix (Bio-rad, USA). The comparative CT method was applied for quantification of gene expression, and values were normalized to 18s or actin. The primers used in the study were shown in Supplementary Table S14 available online at http://bib.oxfordjournals.org/.
Western blot
Cells were lysed by RIPA buffer (Cat#P0013B, Beyotime, China) with protease and phosphatase inhibition cocktails (Thermo Fisher, USA) on ice for 30 min. Proteins were quantified by Bradford assay standards protocol (Bio-rad, USA). Approximate 20 ug of total protein was loaded into mini protein gels (Bio-rad, USA) and subsequently transferred to polyvinylidene fluoride (PVDF) membranes (Cat#162-0177, Bio-Rad, Richmond, CA). After blocking with 5% non-fat milk or bovine serum albumin in PBST, membranes were incubated with the primary antibodies (rabbit-anti-p21, Cat#A1483, ABclonal Biotech, USA; rabbit-anti-p16INK4a, Cat#500262, Zen-Bio, China) and followed by incubating with secondary antibodies (Cat#7054, CST, USA). PVDF membranes that washed by PBS for three times were then subjected for imaging. For the raw images of western blot, see link: https://drive.google.com/drive/folders/1Xqy9Rvl1o-iuXlvuslLHzw1eSPx9wah0?usp=sharing
β-Galactosidase Staining
Data availability
The raw RNA-seq data has been submitted to the Genome Sequence Archive in BIG Data Center (Beijing Institute of Genomics, Chinese Academy of Sciences) (http://bigd.big.ac.cn/gsa), under the accession number CRA000515. For average FPKM values of CEN, F1SP and F1 groups of two regions, see Supplementary Table S15 available online at http://bib.oxfordjournals.org/. The raw pair-end RNA-seq data of human body maps two was downloaded from European Nucleotide Archive database (accession No.: ERP000546).
Statistical analysis
For results of experimental assays, one-way ANOVA test or Students’ t-test was used for comparing groups (* and ** indicate P < 0.05 and P < 0.01, respectively).
11 CEN-specific lncRNAs particularly expressed in centenarian individuals (n ≥ 4) were identified, and Kmer clustering analysis found that some of them like ENST00000521663 and ENST00000444998 are impressively clustered with multiple human diseases-related lncRNAs.
Co-expression analysis suggested that the eight lncRNAs (car-lncs) that collectively dysregulated in CEN and/or F1 groups comparing with F1SP in both N-Hn and S-Hn regions are possibly related with metabolic pathways and aging-related diseases.
In vitro assays found that four car-lncs which include THBS1-IT1, THBS1-AS1, LINC01871, and GRAPLDR are involved in regulating the expression of senescence marker(s), p16 and/or p21, and overexpressing either THBS1-IT1 or THBS1-AS1 can significantly suppress cellular senescence.
This study provided the broad basis for lncRNA studies in the field of human longevity, aging and cellular senescence, and hinted that dysregulated lncRNAs in centenarians are potential elements for improving healthy aging though deep mechanisms remain explored.
Author Contributions
Q.K. conceived and designed the study. J.J. performed all analysis; L.C., L.Y. and M.G. performed the biochemistry assays. J.J. and Q.K. drafted and revised the manuscript. H.Y. helped in revising the manuscript. L.Y. and M.G. collected samples and isolated RNA. All authors read and approved the final manuscript.
Acknowledgments
We would like to acknowledge China Scholarship Council for supporting J.J.’s study in The University of Texas MD Anderson Cancer Center. We also appreciate Dr. Xudong Zhao in Kunming Institute of Zoology, CAS, China, for kindly donating HEL-1 cells and all the members in Dr. Kong laboratories and for their helpful discussions and comments.
Funding
This work was supported jointly and equally by grants from the National Key R&D Program of China (No. 2018YFC2000400, 2018YFE0203700). Additional support was received from the Key Research Program (KFZD-SW-221), Key Research Program of Frontiers Science (QYZDB-SSW-SMC020), Youth Innovation Promotion Association of the Chinese Academy of Sciences, National Natural Science Foundation of China (81671404, 81701394, 91749109), Yunnan Applied Basic Research Project (2017FA038, 2018FB121, 2019FB094), Yunling Scholar of Yunnan Province and Science and Technology Leading Talent Program of the Spring City (Kunming).
Abbreviations
lncRNA, long noncoding RNA; CEN, centenarian; F1, centenarian-children; F1SP, spouses of centenarian children; DElncRNA, lncRNA that differentially (FDR < 0.1) expressed in CEN or F1 group comparing with F1SP; SDElnc, lncRNA that significantly differentially (FDR < 0.05) expressed in CEN comparing with F1SP; HDF, human diploid fibroblasts; car-lncs, candidate aging/health aging–related lncRNAs; SIPS, stress-induced premature senescence; NCPS, natural cellular passages/senescence; MANOVA, multivariate analysis of variance; CEN-specific lncRNAs, lncRNAs that are completely non-expressed (FPKM = 0) in any individuals of F1 and F1SP but exhibit specific expression pattern in the CENs of this study; WBC, white blood cell;
Jianjun Jiang, Ph.D., she was a mentee in Kunming Institute of Zoology, CAS and The University of Texas MD Anderson Cancer Center for exploring roles of noncoding RNAs in human diseases.
Lehua Cheng, a research assistant of Dr. Qingpeng Kong’s lab at Kunming Institute of Zoology, Chinese Academy of Sciences.
Liang Yan, Ph.D., graduated from Fudan University, Shanghai, China, Instructor of The University of Texas MD Anderson Cancer Center, Houston, TX, USA. Dr. Yan is focusing on investigating the deep mechanisms of human cancers.
Mingxia Ge, a Ph.D. candidate of Kunming College of Life Science, University of Chinese Academy of Sciences, Beijing, 100049, China. Her research interests are noncoding RNAs’ studies in the process of aging and longevity.
Liqin Yang, lab manager of Dr. Qingpeng Kong’s lab at Kunming Institute of Zoology, Chinese Academy of Sciences.
Haoqiang Ying, Ph.D., graduated from Boston University School of Medicine, Boston, MA, USA, Assistant Professor of The University of Texas MD Anderson Cancer Center, Houston, TX, USA and focusing on studying metabolisms’ regulation in human diseases especially pancreas cancers.
Qingpeng Kong, Ph.D., he is affiliated to State Key Laboratory of Genetic Resources and Evolution/Key Laboratory of Healthy Aging Research of Yunnan Province, Kunming Institute of Zoology, CAS, Kunming, China; CAS Center for Excellence in Animal Evolution and Genetics, CAS, Kunming China; Kunming Key Laboratory of Healthy Aging Study, CAS, Kunming, China; KIZ/CUHK Joint Laboratory of Bioresources and Molecular Research in Common Diseases, Kunming, China. Dr. Kong’s research fields are human genetics and evolution, aging and longevity studies by population genetics and multi-omics tools.
References
Author notes
Jianjun Jiang and Lehua Cheng Co-first authors
