


Abstract
A very large number of computational methods to predict the change in thermodynamic stability of proteins due to mutations have been developed during the last 30 years, and many different web servers are currently available. Nevertheless, most of them suffer from severe drawbacks that decrease their general reliability and, consequently, their applicability to different goals such as protein engineering or the predictions of the effects of mutations in genetic diseases. In this review, we have summarized all the main approaches used to develop these tools, with a survey of the web servers currently available. Moreover, we have also reviewed the different assessments made during the years, in order to allow the reader to check directly the different performances of these tools, to select the one that best fits his/her needs, and to help naïve users in finding the best option for their needs.
Introduction
The tertiary structure of the proteins can be considered a thermodynamic compromise between the need of keeping the structure quite rigid to preserve its fold and the need of allowing a certain degree of flexibility to promote the function. This fine balance results in an overall marginal stability of the protein in aqueous solution at room temperature, equivalent to a few weak interactions [1–4].
Missense mutations can affect the thermodynamic stability of proteins as well as their flexibility and conformational dynamics [5]. Indeed, despite the fact that proteins are relatively tolerant to substitutions, each residue influences the free energy both of the folded and of the unfolded states. Of course, mutations may exert different effects: it is long known that the most deleterious consequences are usually provoked by nonconservative mutations (i.e. those occurring when a wild-type residue is replaced by one with drastically different physicochemical features), affecting residues involved in networks of interactions, mainly buried in the folded structure [6].
The effects of missense mutations in decreasing protein thermodynamic stability are very well known in clinics: many genetic disorders, cancers and neurodegenerative diseases are caused by unwanted mutations leading to incorrect folding of the corresponding gene products [7]. On the other hand, mutations can also enhance the protein stability, and even this phenomenon, though if less commonly, can lead to a disease [8]. Thus, it is clear that knowing the impact of mutations on protein stability is essential to clarify the relationships among structure, functions and dynamics of that protein. Consequently, it is also fundamental to identify the molecular mechanisms underlying the etiology of diseases associated with that protein, in the view of the development of a personalized medicine approach [9].
The direct measurement of the impact of a large number of mutations on protein’s stability is usually not trivial to be made by experimental methods. Therefore, in order to overcome this limitation, many computational approaches have been developed during the years to predict the thermodynamic stability changes of proteins upon mutations.
In this review, we present an overview of the most recent or up-to-date freely available methods to predict protein thermodynamic stability, and of their problems and pitfalls. We would like to point out that we have deliberately excluded from this review all those tools that predict the phenotypic effect of genetic variants (for review, see, for example, [10]), since they include many other elements than stability to infer these effects, and therefore are beyond the scope of this work. Moreover, we have not even included here the analysis of the tools developed to predict the melting temperature (Tm) of the proteins. Indeed, the thermodynamic stability of a protein is correlated to its thermal stability, but the two terms indicate different aspects. Protein stability is described by the equilibrium of the unfolding reaction (folded ⇆ unfolded). The ΔG of protein unfolding varies nonlinearly with respect to temperature and can be described by a bell-shaped function (Figure 1). Hence, the thermodynamic stability is the value of ΔG at room temperature, whereas the thermal stability corresponds to the value of the Tm, i.e. the temperature at which ΔG = 0 [11]. Information about tools that predict protein Tm can be found in [12].
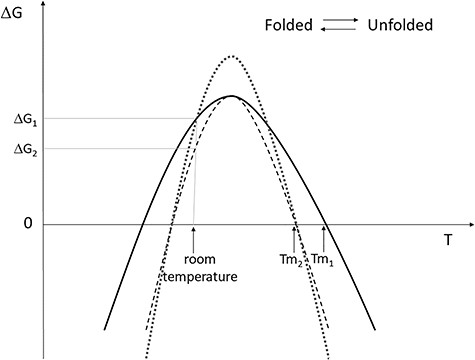
Three examples of protein stability expressed in form of ΔG curve. The equilibrium between folded and unfolded state is described by the ΔG curve. When the ΔG has a positive value, the folded state is predominant. When the unfolded state is predominant, the curve has a negative ΔG value. The ΔG value at room temperature is indicated as the thermodynamic stability of the protein. The thermal stability is given by the Tm value. The Tm value indicates the melting temperature, i.e. the temperature value for which the folded and unfolded states are equally populated. For a given protein stability curve, two melting temperatures exist, also indicated as ‘cold’ and ‘hot’ melting points. The curves presented show some examples of how protein stability can be affected by an amino acid substitution. The wild-type protein stability is described by the continuous line, with thermal stability Tm1 and thermodynamic stability ΔG1. The dotted curve shows one possible effect of a substitution: the thermodynamic stability is unchanged, while the thermal stability decreased to Tm2 value. The segmented curve shows another possible effect of a substitution: both the thermal and thermodynamic stability are decreased. As examples of other possible effects of the amino acid substitution (not shown), the curve may shift on the temperature axis, or may be flattened, or both, consequently the thermal and/or the thermodynamic stability may change.
List of methods to predict the thermodynamic stability changes of proteins upon mutations, based on calculation of free energy potentials, developed or updated in the last 15 years and freely available to users via web servers. All the web servers listed here were available at the time of the submission of the review
| Name and original reference | Input data | Optional settings | Type of approach | Output | Availability |
|---|---|---|---|---|---|
| SRide [24] | Protein structure | – | Structural parameters and evolutionary conservation score to find stabilizing centers | Stabilizing residues in the protein structures | http://sride.enzim.hu/ |
| CUPSAT [27] | Protein structure | Experimental method: thermal or denaturants Prediction for one amino acid or all amino acids | Structural environment-specific atom potentials and torsion angle potentials to calculate energy functions. Mutations and mean force potentials are classified according to different structural regions, including secondary structures and solvent accessibility | Comprehensive information about changes in protein stability for 19 possible substitutions of a specific amino acid mutation. Ability of the mutated amino acids to adapt the observed torsion angles | http://cupsat.tu-bs.de/ |
| Eris [30] | Protein structure | – | Physical force field with atomic modeling, fast side-chain packing and backbone relaxation algorithms. Free energy expressed as a weighted sum of several components (vdW forces, solvation, H-bonding, backbone-dependent statistical energies) | Prediction of energy change of mutant. Options: fixed or flexible backbone; backbone pre-relaxation; e-mail notification | https://dokhlab.med.psu.edu/eris/login.php (accessible to registered users only; free of charge) |
| SDM2 [57] | Protein structure | Single mutation and mutation list. Possibility to predict stability score for a reverse mutation | Updated environment-specific amino acid substitution tables, including residue-occluded packing density and residue depth and other interaction parameters | Stability score analogous to free energy difference between wild-type and mutant protein | http://marid.bioc.cam.ac.uk/sdm2 |
| TKSA-MC [59] | Protein structure | Temperature; pH | Calculation of the electrostatic free energy contribution of each ionizable residue using the Tanford–Kirkwood model with a correction that takes into account the solvent accessibility of these residues (TKSA method) to predict mutations for the enhancement of thermal stability of a protein | Description of the charge positions, the reference pKa, the normalized solvent accessibility surface area, the energy contribution of each residue to the total protein stability and the total energy as a downloadable file | http://tksamc.df.ibilce.unesp.br/ |
| pSTAB [60] | Protein structure. Requirements: protein length between 30 and 300 residues to calculate the effect of mutations on the net charge–charge interaction; ≤ 150 residues to predict folding thermodynamics. No hetero atom(s) or nonstandard amino acid(s). No disulfide bonds. No missing atoms | The user can introduce up to four single-point substitutions with an option for eliminating functionally important residues | Charge–charge interaction energy calculated using a modified Debye–Huckel formalism. Prediction of unfolding curve (for proteins with <150 residues) from the Ising-like WSME statistical mechanical model | List of the top 5000 stable mutants with details on electrostatically frustrated residues and mutational hot spots; optionally, unfolding curve in case of proteins with <150 residues | http://pbl.biotech.iitm.ac.in/pStab/pstab.php |
| PoPMuSiCsym [50, 61] | Protein structure | – | Linear combination of statistical potentials whose coefficients depend on the solvent accessibility of the mutated residue, correcting the bias toward destabilizing mutations imposing physical symmetries under inverse mutations | Prediction of the change in folding free energy upon mutation (ΔΔG). A negative sign corresponds to a mutation predicted as stabilizing | http://www.dezyme.com/en/Software (accessible to registered users only; free of charge for academic users) |
List of methods to predict the thermodynamic stability changes of proteins upon mutations based on machine learning approaches, developed or updated in the last 15 years and freely available to users via web servers. All the web servers listed here were available at the time of the submission of the review
| Name and original reference | Input data | Input data and optional settings | Type of approach | Output | Availability |
|---|---|---|---|---|---|
| I-Mutant 2.0 [21, 23] | Protein structure or sequence | Temperature; pH | SVM-based web server, trained on a dataset derived from ProTherm | Direction of the free energy change and its value for either all possible mutations of a particular residue or only for a specific mutation | http://gpcr2.biocomp.unibo.it/cgi/predictors/I-Mutant2.0/I-Mutant2.0.cgi |
| MUpro [26] | Protein sequence. Protein structure if available | – | SVM- and neural network-based predictors, trained on the same dataset as I-Mutant 2.0. | Prediction of the value of energy change using support vector machine, using regression methods (recommended). Prediction of the sign of energy change using support vector machines and neural networks, using classification methods | http://mupro.proteomics.ics.uci.edu/ |
| I-Mutant 3.0 [31] | Protein structure or sequence | Temperature; pH | SVM-based web server, trained on a dataset derived from ProTherm | ΔΔG value and binary classification (ΔΔG ≥ 0, ΔΔG <0) or ternary classification (ΔΔG < -0.5, −0.5 ≤ ΔΔG ≤ 0.5, ΔΔG >0.5) | http://gpcr2.biocomp.unibo.it/cgi/predictors/I-Mutant3.0/I-Mutant3.0.cgi |
| mCSM [46] | Protein structure | Single mutation, mutation list or systematic mutations on a single residue | Graph-based distance patterns among atoms to represent the residue environment and a ‘pharmacophore count’ vector to account for the atom changes introduced by the mutation. The resulting signature vector is used to train predictive machine learning methods in regression and classification tasks | Prediction of the direction of the change in stability and actual numerical experimental value. Also prediction of change in affinity of protein–protein and protein–DNA complexes upon mutation | http://biosig.unimelb.edu.au/mcsm/ |
| NeEMO [43] | Protein structure | Temperature; pH; amino acid to be substituted (one or more, manually edited) | Calculation of residue–residue interaction networks where nodes represent residues and edges represent different types of physicochemical bonds. These graphs are used to train neural network for the prediction of stability changes | Prediction of ΔΔG changes upon point mutations | http://protein.bio.unipd.it/neemo/ |
| AUTO-MUTE 2.0 (Stability changes tool) [32, 44] | Protein structure (no multiple models, no gaps; no alternative conformations for alpha-carbon atoms) | Temperature; pH; amino acid to be substituted (single or systematic) | Two supervised classification models (random forest and SVM) to predict only the sign of ΔΔG; two regression models (tree regression and SVM regression) to predict the actual value of ΔΔG | Either predicted sign of ΔΔG along with a confidence level or predicted value of ΔΔG with other information about structural features of the mutant | http://binf2.gmu.edu/automute/AUTO-MUTE_Stability_ddG.html |
| INPS-MD [47, 54] | Protein sequence (INPS) or structure (INPS3D) | – | Support vector regression trained on descriptors encoding mutation type (in particular, substitution score, hydrophobicity score, mutability index of native residue, molecular weights of native and mutant residues) and evolutionary information (INPS). Addition of structural features such as relative solvent accessibility of native residue and local energy difference calculated by a contact potential (INPS3D) | Changes in ΔG values upon residue substitution in the protein sequence | https://inpsmd.biocomp.unibo.it/welcome/default/index |
| EASE-MM [51] | Protein sequence of a single domain monomeric protein | – | Combination of five specialized SVM models to predict ΔΔG of mutations. Each SVM combines a different set of features encoding evolutionary conservation, amino acid parameters and predicted structural properties such as secondary structures and different levels of accessible surface areas | Predicted ΔΔG and stability class: ∆∆Gu in (−inf, −1), destabilizing; ∆∆Gu in (−1, −0.5), likely destabilizing; ∆∆Gu in (−0.5, 0.5), neutral; ∆∆Gu in (0.5, 1), likely stabilizing; ∆∆Gu in (1, +inf), stabilizing. Predicted secondary structure and relative accessible surface area of the mutation site | https://sparks-lab.org/server/ease-mm/ |
| STRUM [53] | Protein sequence | Single variation or multiple variation | Gradient boosting regression approach using different features sequence profile scores for evolutionary information, structural profile scores and different energy functions providing accurate environment information | Predicted ΔΔG of single-point mutation | http://zhanglab.ccmb.med.umich.edu/STRUM/ |
| PON-tstab [63] | Protein sequence | Temperature; pH; single variation or multiple variation | Random forests tool based on similarity features, conservation features, amino acid features, variation type features, neighborhood features, and other sequence-based protein features | Predicted ΔΔG of single-point mutation and predicted probability | http://structure.bmc.lu.se/PON-Tstab/ |
| DeepDDG [64] | Protein structure | Single mutations or a list of mutations | Neural network-based predictor in which the parameters are shared for each target residue–neighbor residue pair | Prediction of the change in folding free energy upon mutation (ΔΔG) | http://protein.org.cn/ddg.html |
List of methods to predict the thermodynamic stability changes of proteins upon mutations based on meta-approaches or mixed approaches, developed or updated in the last 15 years and freely available to users via web servers. All the web servers listed here were available at the time of the submission of the review
| Name and original reference* | Input data | Optional settings | Type of approach | Output | Availability |
|---|---|---|---|---|---|
| iStable [40] | Protein structure or sequence | Temperature; pH | Meta-predictor: sequence information and prediction results from several elements predictors. SVM as an integrator | Prediction of protein stability change | http://predictor.nchu.edu.tw/istable/ |
| DUET [45] | Protein structure | Single mutation or systematic | Meta-predictor: consensus prediction of two complementary approaches developed by the same research group (mCSM and SDM) and obtained by combining the results using SVM | Protein stability score | http://biosig.unimelb.edu.au/duet/stability |
| ELASPIC [41, 55] | Protein structure | Single mutation or multiple mutations | Combination of semiempirical energy terms, sequence conservation and structural features to describe mutated position and its surroundings, with homology modeling to train ensemble machine learning methods based on decision trees | Predicted ΔG values of wild-type and mutant protein, predicted ΔΔG value, structures of wild-type and mutant models, alignment file used to create the models | http://elaspic.kimlab.org/ |
| MAESTROweb [49, 52] | Protein structure | Single mutation, mutation sensitivity profile, scan for (de)stabilizing mutations. Possibility to combine mutations in different positions and to take into account multimeric proteins. pH value can be indicated | Statistical energy functions complemented by additional sequence and structure information, combined with multiple linear regression, neural networks and SVM to generate a multi-agent method | Predicted ΔΔG values and a corresponding prediction confidence estimation | https://biwww.che.sbg.ac.at/maestro/web |
| DynaMut [62] | Protein structure | Single mutations; mutation list | Meta-predictor: consensus among different predictors (Bio3D, ENCoM and DUET). The first two predictors are based on normal mode analysis of the conformational variability, the last one is a consensus method based on two approaches calculating statistical potentials | Predicted change in stability along with the variation in entropy energy between wild-type and mutant structures provided for meta-predictor and for the structure-based methods | http://biosig.unimelb.edu.au/dynamut/ |
Computational approaches to predict the impact of missense mutations on protein’s thermodynamic stability
The first example of theoretical calculations to predict the impact of mutations on protein’s stability appeared in literature in late 1980s [13]. The method made free energy calculations using a semiempirical force field, starting from detailed atomic models of the protein structures. Being time-consuming, it was not suitable for large databases of mutations. Faster methods, based on more approximate descriptions of protein structures, simplified force field and a search in a limited conformational space, were developed later [14, 15]. In the 2000s, the landmark for this kind of algorithm was probably the work of Serrano’s group. FoldX empirical energy function [16], later implemented through a web server [17], combined several weighted energy terms developed to allow a fast and quantitative estimation of the difference in the free energy of unfolding (ΔΔG) between native and mutant proteins. The authors reported a prediction error for FoldX below 0.81 kcal mol−1 for 70% of the point mutants included in a very large dataset [16], and after more than 15 years, this tool is still one of the most popular programs for this kind of application.
Since then, a high number of programs have been developed to predict the ΔΔG between a wild-type protein and its missense mutant(s) [18–66]. Tables 1–3 show a list of the tools developed or updated in the last 15 years and freely accessible via web servers, summarizing some of the properties of each tool.
ΔΔG predictions made by these tools are mainly based on two computational approaches. The first (and generally oldest) one calculates the free energy differences by classical equations and geometrical features, chemico-physical parameters or potential energy evaluations. Recently, two methods have been developed for predicting changes in protein stabilities by modulating charge–charge interactions, one using the Tanford–Kirkwood Surface Accessibility model [59] and the other one using an Ising-like statistical mechanical model [60]. Web servers based on potential energy evaluation developed in the last 15 years are listed in Table 1.
The second (and generally more recent) approach deals with artificial intelligence-based methods such as support vector machines (SVM) and neural networks. These methods are usually trained onto a dataset of proteins associated with experimentally determined ΔΔG, taking into account a set of descriptors of the sequence and/or structural features associated with the ΔΔG. One of the first examples of this kind of approach has been the one developed by Capriotti and coworkers in 2004 [21], later implemented in I-Mutant 2.0 [23]. Since then, a high number of predictors based on machine learning approaches have been created, and those developed in the last 15 years and available as web servers are listed in Table 2.
The methods that apply the empirical energy function approach are usually computationally intensive and therefore difficult to be used for large datasets [67], whereas the machine learning approaches are usually more prone to overfitting problems [61].
Additionally, some methods are more appropriately defined as meta-predictors, being based on the consensus among two or more methods. The web servers based on meta-predictors developed in the last 15 years are listed in Table 3.
Most of the web servers listed in Tables 1–3 ask for the protein structure as an input, whereas some of them use only the sequence or combine the sequence/structure information for a better prediction. When the protein structure is taken as input, several structural parameters are derived from it, to describe the spatial environment of the residue subjected to mutation. In most cases, these parameters rely on the solvent accessible surface area (SASA) of the residue, and on the distance patterns or contacts among surrounding atoms, which act as descriptors of the volume of the cavity containing the candidate residue for mutation. Some tools, such as AUTO-MUTE 2.0 [44] and SDM2 [57], replace the evaluation of residue solvent accessibility with other parameters, such as the calculation of attributes derived by Delaunay tessellation (for AUTO-MUTE) or residue-occluding packing density and residue depth (for SDM2). SDM2 introduces also the concept of ‘functional residues’ by identifying those residues involved in catalytic site, ligand binding and protein–protein interactions. In some other cases, for example, MUpro [26], CUPSAT [27] and PoPMuSiC 2.0 [34], the backbone torsion angles and secondary structure specificity are additionally evaluated for predictions. Eris [30] allows to model backbone flexibility, in order to take into account the backbone adaptation in case of small-to-large mutations and to improve the ΔΔG estimation in these cases. Other structural features taken into account by some predictors are the type of interactions between the residue and the surrounding atoms. For example, NeEMO [43] uses residue interaction networks to represent different types of physicochemical bonds among the amino acids of the protein of interest, whereas ELASPIC [55] first calculates the atomic contacts between the residue of interest and its surroundings and then classifies those atomic contacts as hydrophobic, hydrophilic or electrostatic using a distance cut-off to calculate interactions.
Long-range effects are crucial to understand entirely the effects of many mutations in proteins. Indeed, because of long-range correlations, a mutation not only can perturb its surroundings but also other spatially distant parts of the protein [68]. A way to infer these effects is to perform correlation analysis based on elastic network models. To date, only few predictors have incorporated this analysis. ENCoM [42] was the first one, based on normal mode analysis, but unfortunately its web server [48] is currently unavailable. More recently, an original approach has been developed by Rodrigues and coworkers, which integrates normal mode analysis and two methods based on statistical potentials (already integrated in a meta-predictor [45]), in a new consensus predictor for protein stability changes upon mutation (DynaMut) [62].
Evolutionary information is included to check whether an amino acid is conserved among different organisms. Moreover, evolutionary information may help to detect environmental conditions determined by side chains that surround the mutated amino acid and how they must by conserved or balanced during evolution. The direct-coupling analysis is an approach used to take into account residue coevolution: when two residues of a protein interact, the substitution of one of them may destabilize the protein, so another substitution on the other residue may compensate the effect and maintain the right contact and interaction. Computational approaches to direct-coupling analysis can identify residue pairs coevolved, although this might imply that at least two substitutions must be considered [69]. Alternatively, it can be applied for single mutations by using the ‘predicted’ contacts as a proxy for real contacts.
When the tools start from the protein sequence, usually evolutionary information is taken into account by performing multiple sequence alignments, and also adding some kind of description of the ‘sequence environment’ of the mutant residue, by using predictors of structural properties, such as the hydrophobicity scores of wild-type and mutant residues and their molecular weights. Some predictors combine different methods to obtain multiple sequence alignments with structural sequence profiles obtained by low-resolution structure models, to provide more accurate information about the environment of the residue to be mutated. This enhances the robustness and accuracy of the predictor and makes it applicable to many more protein sequences. The same information is often integrated also in structure-based approaches.
An interesting option offered by only a part of the methods is the opportunity of indicating temperature and pH values for the prediction. This option gives the chance to evaluate how the impact of substitution is different at changing temperature and pH, being the environmental conditions not unique in biological systems and, more in general, for possible protein engineering purposes.
Another difference in the input/output of the methods concerns the opportunity to ask for the effect of single amino acid substitution (the simpler case available in all predictors) or a systematic substitution at a given position. While the effect of a selected amino acid substitution is of interest to evaluate natural variants observed in proteins, the systematic substitution is an information more suitable for protein engineering studies aimed to the design of modified proteins that retain or modify their stability properties, according to the specific purpose. To date, only one structure-based web server predictor, MAESTROweb [52] is able to evaluate the effect not only of multiple mutations at the same position but also of multiple mutations occurring in different positions. Moreover, whereas the structure-based methods listed here can manage a single monomer at a time, MAESTROweb can deal even with multiple mutations occurring in different subunits of multimeric proteins.
Problems and pitfalls in predicting the impact of missense mutations on protein’s thermodynamic stability
Methods and tools to predict the effects of mutations on protein stability have been tested by their authors by analyzing different datasets. Additionally, the performances of several predictors among the most popular ones have been assessed several times in the last 10 years in an independent or semi-independent way [39, 61, 67, 70–75], naming as ‘independent’ the assessments in which the authors did not included predictors developed by themselves. Table 4 summarizes the tests performed during these assessments.
Overview of the assessment studies of programs to predict the impact of missense mutations on protein’s thermodynamic stability
| Assessment | Programs assessed | Test set | Metrics for assessment | Problems and comments | Summary of the results of the assessment* | Conflict of interest |
|---|---|---|---|---|---|---|
| Potapov et al [70] | CC/PBSA, EGAD, FoldX 3.0, I-Mutant 2.0, Rosetta, Hunter (unpublished) | 2156 single mutations from FoldX and ProTherm databases. Averaging multiple measurements of the same mutation | Correlation coefficient between computed and experimentally determined values | The metrics used are insensitive to systematic biasesVariability of ΔΔG values in the database (calculated with different experimental methods)The servers allowed a limited number of evaluations | EGAD and Rosetta give many unrealistic predictions if there are clashes in the structuresEGAD does not allow modeling many mutationsBest performing methods: EGAD, CC/PBSA and I-Mutant 2.0 | The authors have developed Hunter program (unpublished, tested in the current assessment) |
| Khan and Vihinen [67] | AUTO-MUTE, CUPSAT, Dmutant, FoldX 3.0, I-Mutant 2.0, I-Mutant 3.0, MultiMutate, MUpro 2.0.4, SCide, Scpred, SRide | 1784 mutations, of which 1154 destabilizing (ΔΔG ≥ 0.5 kcal/mol), 222 stabilizing (ΔΔG ≤ 0.5 kcal/mol), 631 neutral (between −0.5 and 0.5 kcal/mol), from 80 proteins from ProTherm database | Ability to classify mutations into stabilizing (ΔΔG ≤ −0.5 kcal/mol), destabilizing (ΔΔG ≥ 0.5 kcal/mol) and neutral mutations (−0.5 kcal/mol < ΔΔG < 0.5 kcal/mol) | Variability of ΔΔG values in the database (calculated with different experimental methods)SCide, Scpred and SRide predict only destabilizing effects | SCide, Scipred and SRide can predict only destabilizing mutationsOverall performance: best for I-Mutant 3.0, Dmutant and FoldXBest sensitivity for MUpro, I-Mutant 3.0 and CUPSAT. Best specificity for SRideCUPSAT has the highest accuracy, sensitivity and MCC for stabilizing mutations. I-Mutant 3.0, FoldX and Dmutant are the best methods for destabilizing mutations | Authors of the assessment are not involved as co-authors of the programs assessed |
| Li and Fang [39] | MUpro, I-Mutant 2.0, LSF, FoldX, EGAD, PROTS (structure-based), PROTS (sequence-based), PROTS-RF (structure-based), PROTS-RF (sequence-based) | Dataset collected by Potapov et al. (2009) [70] and a dataset including 180 double point mutations from 27 wild-type proteins | Accuracy, AUC, Pearson correlation coefficient, consistency between ΔΔG of direct and reverse mutations (ideally, ΔΔGxy = −ΔΔGyx) | Data for FoldX and EGAD were extracted from Potapov et al. [70] | PROTS-RF outperforms the other methods for single mutations, in particular for the hypothetical reverse mutations test. PROTS-RF performs equally well also in double- and multiple-mutation tests | Authors of the assessment developed PROTS-RF and PROTS |
| Thiltgen and Goldstein [72] | FoldX, Rosetta_ΔΔG_monomer, Eris, I-Mutant 3.0 | 65 pairs of mutations (direct and reverse) from different SCOP families, with available crystallographic structure. No reference to ΔΔG experimental data | Consistency between ΔΔG of direct and reverse mutations (ideally, ΔΔGxy = −ΔΔGyx) | The four methods generate predictions with significantly different magnitudes. Scaling the calculated errors by the root mean square (RMS) of the predicted values for each method would also scale the estimated errors | Eris has the smallest systematic bias, whereas I-Mutant 3.0 has the highest one. Rosetta has significantly lower errors | Authors of the assessment are not involved as co-authors of the programs assessed |
| Usmanova et al. [73] | FoldX4.0, Rosetta_ΔΔG_monomer, Eris, I-Mutant 3.0 | Dataset of mutant proteins differing from 1 to 10 mutations. Resolution lower than 2.5 Å, monomeric, without missing backbone atoms and nonstandard residues. Approx. 10 000 structures globally | Consistency between ΔΔG of direct and reverse mutations (ideally, ΔΔGxy = −ΔΔGyx) | Need of manipulating protein structures before analyzing the stabilityI-Mutant does not allow to check multiple mutations | Bias for single substitution: lowest for FoldX, highest for RosettaFor multiple mutations: the bias increases with the number of introduced mutations but not in a linear way (I-Mutant 3.0 not tested because it does not allow multiple mutations) | Authors of the assessment are not involved as co-authors of the programs assessed |
| Pucci et al.[61] | PoPMuSiC 2.1, PoPMuSiCsym, SDM, CUPSAT, Rosetta, FoldX 3.0, I-Mutant 3.0, iSTABLE, NeEMO, AUTO-MUTE, STRUM, MAESTRO, mCSM, DUET, MUpro | Manually curated dataset obtained from ProTherm formed by 684 mutations, half of which are direct mutations inserted in 15 wild-type proteins and the remaining half are reverse mutations inserted in 342 different mutant proteins. The direct mutations belong to the training dataset of the methods tested, whereas the inverse mutations constitute an independent test set. 3D structures of both the wild-type and mutant proteins are solved by X-ray crystallography with a resolution <2.5 Å. ΔΔG measured at T = 25°C, pH 7 | RMSD and linear correlation coefficient between predicted and experimental ΔΔG0 values for direct and reverse mutations. Linear correlation coefficient between the predicted ΔΔG0 values of the direct and reverse mutations (ideally, ΔΔGxy = −ΔΔGyx) | None reported | All the tested methods are biased toward destabilizing mutations, except PoPMuSiCsym. SDM is the least biased predictor among the othersGenerally, the machine learning methods are more biased than physics-based approachesThe best performing method for direct mutations is MUpro; the best performing methods on inverse mutations are PoPMuSiCsym, MAESTRO, FoldX and PoPMuSiC 2.1 | The authors have developed PopMuSiCsym program tested in the current assessment |
| Strokach et al. [74] | Provean, ELASPIC, FoldX, Rosetta ddg_monomer, Rosetta cartesian_ddg, Amber TI | Frataxin protein with eight mutants [76] | Mean absolute error between predicted and experimentally determined values, considering only those mutations with ΔΔG < 4 kcal/molPearson’s and Spearman’s correlation coefficients. Balanced accuracy and AUC for ROC calculated considering mutations with an experimental ΔΔG > 1 kcal/mol as destabilizing and mutations with an experimental ΔΔG ≤ 1 kcal/mol as neutral | Very small dataset. Evaluation of a tool (PROVEAN) that predicts whether a mutation is likely to be deleterious (no direct prediction of ΔΔG of mutations) | Provean scores have the strongest correlation with experimental DDG values. Amber TI predictions have the worst correlationELASPIC has the lowest mean absolute error between predicted and experimental value (MAE), followed by FoldX. Rosetta’s cartesian_ddg protocol has the highest MAEProvean has the highest Pearson’s r, followed by Rosetta’s cartesian_ddg. Rosetta’s cartesian_ddg has the highest balanced accuracy, Provean and Amber TI the worst | The authors have developed ELASPIC program tested in the current assessment |
| Fang [75] | MUpro, I-Mutant 2.0, STRUM, mCSM, DUET | 125 mutations of 9 wild-type proteins in ProTherm database for which both wild-type and mutant protein structures were available | Percent of inconsistence, percent of correctly predicted signs for direct and reverse mutations. Pearson’s and Fechner’s correlation coefficients of the experimental and predicted ΔΔG. AUC curve for performance | None reported | All algorithms tested have a percent of inconsistency higher than 70%, being mCSM the worst. All algorithms predicted the signs of forward mutations with accuracy higher than 80% being MUpro the best, but the accuracy for reverse mutations was less than 30%. Thus, all tested algorithms are prone to overfitting. | Authors of the assessment are not involved as co-authors of the programs assessed |
*The reader is recommended to refer to the original assessment article for further details.
The focus of the papers of Khan and Vihinen [67] and of Potapov and coworkers [70] was to test the ability of the predictors to give an estimate of the real ΔΔG between wild types and mutants and to predict correctly the stabilizing/destabilizing effects caused by a mutation. In both cases, the authors created a reference database of single-point mutations (excluding those included in the training sets of the predictors evaluated) and extracted experimental information about thermodynamic parameters of protein stability from ProTherm database [77]. When multiple experimental measurements were available for a single mutation, Potapov et al. calculated an average value, whereas Khan and Vihinen selected only one representative case (no explanation was provided on the criteria used to select the representative). It is important to note that experimental uncertainty affects the highest possible accuracy that predictors may obtain, as it has been highlighted and addressed in two recent articles [78, 79].
In [70], four published predictors (FoldX 3.0 [16], EGAD [22], I-Mutant 2.0 [23] and CC/PBSA [33]) were evaluated, together with Rosetta [80] (a method that was not tailored to predict stability of proteins) and with an unpublished predictor developed by the authors themselves. All these programs start from protein structure to predict changes in stability, introducing the mutations with different protocols. Mutations were classified following two criteria, being stabilizing/destabilizing and being or not hot spot mutations (|ΔΔG| > 2 kcal/mol), and were divided in three classes (mutations involving Gly and Pro, mutations to alanine and all other types of mutations). In addition, two-state exposure to solvent was taken into account. Results were evaluated on the basis of the accuracy, sensitivity and specificity of each predictor. The average error in the prediction of ΔΔG (1.2 kcal/mol) was found to be much higher than the experimental error, and all predictors were found to underestimate the experimental results. The percentage of mutations correctly identified as stabilizing or destabilizing varies among the different methods (69–79%). The best performing method was found to be EGAD, but this predictor was also the one with the highest number of unrealistic predictions, together with Rosetta. In that assessment [70] CC/PBSA and I-Mutant 2.0 were found to be the best programs in predicting a stabilizing or destabilizing effect for a mutation. Combining the results from different predictors did not improve the correctness of the output.
In [67], 11 predictors, either sequence- or structure-based, were evaluated: Scpred [15], FoldX 3.0 [16], Dmutant [18], SCide [19], I-Mutant 2.0 [23] and 3.0 [31], SRide [24], MuPro 2.0.4 [26], CUPSAT [27], MultiMutate [28] and AUTO-MUTE [32], of which only two (FoldX and I-Mutant 2.0) were in common with the former study and three (SCide, SRide and Scpred) were able to predict only destabilizing effects caused by mutations. In this assessment, the statistical analysis to evaluate the quality of the prediction of the different tools was more thorough, and the authors took into account not only general results but also the performances of predictors with respect to the structural class of the protein, to the SASA and to the volume of the mutated residue. Moreover, this study classified the mutations in stabilizing mutations (ΔΔG < −0.5 kcal/mol), destabilizing mutations (ΔΔG > 0.5 kcal/mol) and neutral mutations (−0.5 < ΔΔG < 0.5 kcal/mol), considering that the experimental error for measuring ΔΔG was estimated as ±0.48 kcal/mol [81].
Also in [67], the authors noticed that no program performed as well as reported by their authors and that there was no agreement in the predictions among the different programs. Matthew’s correlation coefficient (MCC) values calculated for the predictors were comprised between 0.27 (I-Mutant 3.0 structure-based predictor) and − 0.39 (MUpro). This range indicates a very poor result, considering that a value of MCC = 1 is associated with the best possible prediction, whereas values near 0 indicate random prediction. CUPSAT was found the method with the highest accuracy, sensitivity and MCC for stabilizing mutations, whereas I-Mutant 3.0 (structure-based predictor), FoldX and Dmutant were the best methods to predict destabilizing effects of mutations. No significant differences were found among the predictors with respect to the secondary structures in which the mutation is inserted, whereas CUPSAT, Dmutant, FoldX, I-Mutant 3.0 and MultiMutate were the best predictors for proteins with few secondary structures. In addition, this assessment noted that there was generally no agreement among the predictors nor between the predictors and the experimental data.
Li et al. [71] introduced hypothetical reversed mutations to test predictors of protein thermostability. Instead of comparing the performances of the predictors toward the ‘true’ experimental ΔΔG values, the authors tested the consistency of predictions between direct and inverse mutations. In this way, the limitations of the previous assessments due to inconsistencies in the ΔΔG values obtained with different experimental approaches and conditions were overcome, and systematic bias was distinguishable from random errors. In their article, the authors presented PROTS, a novel fragment-based protein thermostability potential in two different versions (PROTS_SEQ uses sequence information and PROTS uses structure information), developed as an integrated analysis of both thousands of thermophilic and mesophilic protein structures and a large dataset of point mutations for which changes of melting temperatures were experimentally determined. The authors performed a comparison of the performances of PROTS and PROTS_Seq to other predictors, i.e. MUpro, I-Mutant 2.0, LSE, FoldX and EGAD. The hypothetical reverse mutations approach was used to compare predictions of ΔTm and ΔΔG, by considering that both variations are expected to be opposite in case of reversed mutation. The same approach was used again in 2012 by Li and Fang [39] to compare the same predictors with two new versions of PROTS, based on random forest algorithm, able to manage not only single- but also multiple-point mutations. In the assessments made by Fang and coworkers, the predictor developed by these authors outperformed the others tested, especially in terms of robustness in the tests conducted using the hypothetical reverse mutation approach.
In 2012, another assessment was made [72], based on the principle described for the first time in [71], for four tools, two of which (FoldX and I-Mutant 3.0) already tested in the past, together with a new version of Rosetta, and another method (Eris) [30]. The authors created a database of 65 pairs of proteins with known crystal structures, from different SCOP families [82], where the members of each pair differ for a single mutation. Mutations were classified into structure-preserving and structure-modifying on the basis of the root mean square deviation (RMSD) between the backbone atoms of the two proteins in each pair, and also SASA and secondary structures were taken into account. The results of that assessment showed that the new version of Rosetta was the best predictor and I-Mutant 3.0 was the one with the lowest random error and the highest systematic bias. The authors argued that the result depended on the fact that I-Mutant 3.0 is based on a machine learning approach that was trained with a database of mutations biased toward destabilizing effects. The performances of the methods were essentially unaffected by the structural change induced by the mutation, and similarly to the previous assessments, all methods performed best on exposed mutations with respect to buried ones.
During 2018, two other assessments were made almost simultaneously. One [73] was made essentially on the same programs analyzed in [72], except that FoldX 3.0 was replaced by the more recent version 4.0. Also the approach was the same as in the assessment made in 2012, but the authors used a larger database made by a set of PDB pairs of proteins which differ from 1 to 10 residues, collecting approximately 8000 pairs, at a resolution higher than 2.5 Å, excluding proteins with missing backbone atoms and nonstandard residues. The authors measured the bias of the predictors as a function of the number of the mutations introduced and found, in agreement with [72], that all programs are biased for single substitutions, being FoldX the less biased and Rosetta the most biased one. The bias increases at increasing number of mutations, but the increment of the bias is less pronounced when multiple mutations are added.
The other assessment performed in 2018 [61] was made by the group developing PoPMuSiC predictor and is probably the most complete assessment made on this kind of tools so far. Fifteen widely used ΔΔG predictors, of which five previously assessed (CUPSAT, FoldX 3.0, I-Mutant 3.0, AUTO-MUTE, MUpro) and the others more recently developed (PoPMuSiC v. 2.1 [34] and PoPMuSiCsym [50], iSTABLE [40], NeEMO [43]; DUET [45], mCSM [46]; MAESTROweb [52]; STRUM [53]; SDM [57]), together with another version of Rosetta [83], were tested to quantify their bias in predicting the stability changes upon mutations. All were structure-based predictors except MUpro. The authors used the same assessment approach as in [72, 73], but they calculated also the RMSD and linear correlation coefficient between predicted and experimental ΔΔG values for the direct and inverse mutations in their reference dataset. The dataset used as a reference was formed by 684 mutations, half of which were direct mutations inserted in 15 wild-type proteins and the remaining half were inverse mutations inserted in 342 different mutant proteins. This dataset was manually curated and obtained by selecting from the ProTherm database those mutations for which the 3D structures of both wild-type and mutant proteins were solved by X-ray crystallography at a resolution better than 2.5 Å and with ΔΔG values measured at T = 25°C and pH = 7.
Once again, the results confirmed the existence of the bias with respect to the training dataset (i.e. the group of direct mutations) for all the predictors except PoPMuSiCsym, the tool explicitly developed by the assessors in order to avoid this bias. PoPMuSiCsym, FoldX 4.0, MAESTRO and PoPMuSiC 2.1 were also the less biased predictors with respect to the group of inverse mutations. The authors noticed that machine learning approaches are usually more biased with respect to methods based on physics, probably because the composition of their training dataset appears to be unbalanced toward destabilizing mutations. The bias is amplified for the mutations in the core of the protein with respect to those on the surface.
After the publication of these two assessments [61, 73], the bias problem was also investigated in a Letter to the Editor of Bioinformatics [84], in which Montanucci and co-authors added the test on INPS-MD, highlighting the very good performance of their tool, specifically designed to take into account antisymmetry problem.
During 2019, two other assessments have been published [74, 75], confirming the high interest for these predictors. Strokach and coworkers (the developers of ELASPIC [41, 55]) focused on three predictors (including ELASPIC) that they used in the context of the ‘CAGI5 frataxin challenge’ [76] to predict the ΔΔG for eight mutations in human frataxin protein and on three additional predictors not used for CAGI5 challenge. Two of them (FoldX and Rosetta) were assessed also in the past, whereas the third one (Amber TI) is a protocol to simulate the transition from the wild type to the mutant protein and to calculate the ΔΔG of that transition [85]. This assessment is limited by the very small dataset of mutations used to test the performances of the predictors (one protein with eight mutations). The evaluation of the performances of the predictors was made using different metrics (mean absolute error either general and considering only those mutations that have an experimental ΔΔG < 4 kcal/mol; Pearson’s and Spearman’s correlation coefficients; average of the recall for neutral mutations and for destabilizing mutations; AUC, i.e. the area under the receiver operating characteristic (ROC) curve). The authors classified ELASPIC as the method with the best accuracy in predicting the ΔΔG of individual mutations, despite a mean square error close to 1 kcal/mol. Rosetta was the best performing method in terms of distinguishing between neutral and destabilizing mutations. In their assessment, the authors also found that predictors based on protein structures achieved a relatively little improvement with respect to sequence-based predictors, with a higher computational cost.
Finally, a very recent assessment by Fang focused on the performances of five very popular machine learning-based methods (MUpro, STRUM, mCSM, DUET, I-Mutant 2.0) [75]. Fang evaluated these predictors with several statistical metrics such as the percent of inconsistence of predictions, the percent of correctly predicted signs and the AUC. This assessment has highlighted that most of 70% of predictions of all predictors are inconsistent (e.g. a mutation and its reverse hypothetical mutation have the same sign, meaning that a mutant protein is simultaneously more and less stable than the wild type). mCSM resulted the one with the worst performance. Moreover, while the accuracy in predicting the change in stability for the mutation was generally above 80%, this accuracy dropped down to 30% for the corresponding inverse hypothetical mutation. These data are in agreement with the problem of overtraining of all these predictors toward a biased dataset. In agreement with previous assessments, the reasons for these discouraging results were found essentially in the data and features used to train the algorithms. A comment to the Fang assessment has been very recently reported to highlight that INPS-MD [54], a stability predictor developed to specifically take into account the antisymmetric property and not considered in this last assessment, has performances very stable with respect to the direct and inverse mutation, indicating that when a machine learning method is properly trained and when the antisymmetry is taken into account, it is possible to obtain consistent results for both direct and inverse variations [86].
Problems and pitfalls in the sets of experimental data of protein mutations
In addition to the weaknesses of the methods developed to predict the effect of mutations on protein stability, another main source of errors in this field is the lack of proper experimental data that can be used as a reference. Recently, two articles by Vihinen’s group [63, 87] evaluated in details the benchmark datasets used to train and test the predictors developed during the last 15 years. In particular, these authors focused on ProTherm [77], a database that collects published experimentally determined thermodynamic parameters of protein stability, because they pointed out that all the existing machine learning methods have been trained by using data extracted from this single database, publicly available through the VariBench database [88]. Indeed, ProTherm contains not only thermodynamic data but also manually and automatically curated information on proteins, experimental methods and conditions, literature information, cross-links to structural information that facilitates the analysis of structure–thermodynamic relationship of proteins, as well as mutational information and is constantly updated by the curators. However, the deep analysis made by Vihinen and coworkers confirmed that the data contained in this resource and, as a consequence, in the sub-selections used to train the predictors are affected by several problems [63]. First, none of these datasets is fully representative in describing the distribution of protein folds, domains, enzyme classification, GO annotation levels and the distribution of the coding genes to chromosomes. Moreover, in ProTherm database, several ΔΔG values were erroneously reported with respect to the original data, others were reported with the wrong unit, others were measured in unphysiological conditions (extreme pressure, temperature, salt concentration etc.), and others were data for unfolded proteins and for very short peptides. Furthermore, several data were incorrect with respect to the protein’s sequence or structure [63].
In order to encompass all these limitations, Vihinen and coworkers have recently created a new, high-quality, cleaned dataset with the following criteria: data were added only for proteins with correct sequence and structure, using a single representative measurement made in physiological-like conditions (pH between 5 and 9, low pressure, salt concentration lower than 0.2 M) and using the differential scanning calorimetry as a method of reference [88]. This new database (freely available at http://structure.bmc.lu.se/VariBench/stability.php) contains 1564 entries from 99 proteins from different organisms. Two hundred and thirty-three stabilizing and 864 destabilizing mutations are included, as well as 467 mutations that do not affect stability. Only 29% of the entries of the original ProTherm database are present as such into this new resource, which is candidate to be the best suited one to test and train prediction methods [88].
In our ongoing research, we are dealing with the effect of mutations in proteins involved in rare diseases, and we are continuously trying to improve the prediction of their effects on the stability [89–91]. In order to test the performances of several stability predictors to select the best one(s) for our current activities (manuscript in preparation), we selected this new promising dataset, which can be considered the best curated one for this kind of applications. We focused on a subgroup of proteins with an explicit PDB reference, for a total of 78 proteins (of which, 12 with associated NMR structure) carrying globally 1432 mutations. Regrettably, despite the appreciable and remarkable effort made to create a cleaned reference database, we noticed that it is still far from being ideal. For example, this dataset includes five cytochrome, five lysozyme and five ribonuclease proteins from different organisms, meaning that almost 20% of its content is related to only three different protein folds. The list of 172 mutations associated with Phage T4 lysozyme alone (PDB code 2LZM) accounts for more than 12% of all the mutations in the subset analyzed. The mutations associated with other three proteins (130 to barnase form B. amyloliquefaciens, PDB file 1BNI; 92 to Gene V protein from Enterobacteria phage f1, PDB file 1VQB; and 80 to chymotrypsin inhibitor 2 from barley, PDB file 2CI2) account together for another 21.2%; thus, about one-third of the mutations analyzed is associated with only four different proteins. Moreover, there are cases in which multiple mutations involve the same position on the protein sequence (e.g. in Gene V protein, only 28 different residues are involved in the 92 mutations associated with this protein, and in Phage T4 lysozyme, the 172 mutations affect 79 different sequence positions). The distribution of the type of residues affected by mutation is biased not only in the original database but also in this cleaned one: 161 mutations (11.3%) deal with the wild-type residue Val, and the first three more mutated residues together (V, D, T) account for more than 28% of all mutations in the dataset. The situation is even worse looking at the type of residues in which the original residue is mutated: more than one quarter of mutations (375) involve a residue that is mutated to Ala, and the first three more represented mutations in this case account together for more than 40% of this dataset. Finally, in some proteins, only a single type of amino acid is involved in mutations: for example, the three mutations reported in chitosanase from Streptomyces (PDB code 1CHK) involve only Trp residues and the eight mutations in RNase Sa3 from Kitasatospora aureofaciens (PDB code 1MGR) involve only Tyr residues. In other proteins, the wild-type residues are mutated in a single amino acid type: for example, in bovine pancreatic trypsin inhibitor (PDB code 1BPI), all mutations reported in the dataset change the original residue into Ala. While the reason of this bias is clear (Ala scanning is commonly used to rapidly identify residues important for protein function, stability and shape), on the other hand, it represents a pitfall in terms of possibility of generalization of the results in the field of the development of stability predictors.
The quality of the structures indicated as references in the dataset could potentially affect the performance of the predictors that extract structural features from them. In this cleaned dataset, despite an average resolution of 1.98 Å, many proteins show one or more of the following drawbacks: a high percentage of Ramachandran outliers, missing atoms and residues, missing values for Rfree, high percentages of residues with poor fit to electron density, high thermal factors, structures classified as wild type but including modifications for experimental reasons and low geometric quality of the chains.
Given this situation, it is not surprising that, when Yang and coworkers used this new database to train a new sequence-based, machine learning (two-layer random forest) predictor of protein stability, the new predictor still showed a performance lower than those recently reported for some other tools [63]. Therefore, it is evident that more efforts are still needed in order to create new reference datasets of thermodynamic data in which experiments are reported rigorously, the associated protein structures are of very high quality, the redundancy is kept to the minimum and a better balance between destabilizing and stabilizing mutations is reached.
Strategies suggested for improving the prediction of protein thermodynamic stability
General recommendations to the developers of predictors for protein thermodynamic stability can be extracted by the results of independent or semi-independent assessments made in the past. We would like to summarize here those that, on the basis of the state-of-the-art literature, are, in our opinion, of outmost importance and/or not yet fully addressed.
First of all, it is mandatory to deal with datasets of reference with high-quality data, not only in terms of experimental determination of ΔΔG but also well balanced for protein composition (including possibly representatives of different structural families), type of mutations (not only taking into account a good balance between stabilizing and destabilizing mutations but also in terms of type of residues involved) and number of mutations carried out by a single protein. This is probably one of the most challenging factors, given that the data about protein mutations in literature are extracted from experiments that have been made with aims very far from the development of an unbiased dataset of mutant proteins; for this reason, we feel that simply including new data from literature, as suggested by some assessors [61, 75], is not sufficient. Probably the only way to encompass this limitation would be to recruit scientists in order to perform ad hoc, standardized experiments with reliable techniques on a de novo designed dataset of proteins that meet all the requirements to become the reference for this kind of predictors. This would require the development of a community effort similar to what have been made in the field of the prediction of protein structure with CASP [92]. Given the importance of this kind of predictors and the active interest in this field, we hope that this effort will be started and supported by the structural bioinformatics community.
Additionally, the developers must check very carefully the quality of the structural data used to extract features or to train the predictors. High resolution is often the only parameter taken into account to discriminate between good and bad structures, but it is not sufficient to identify structures of high quality. Nowadays it is well known that many other parameters concur in identifying good structures [93] and all of them must be taken into account when protein structures are used as a starting point for any other application, including training/test datasets for predictors.
The introduction of symmetry constraints to satisfy the required equation ΔΔGXY = -ΔΔGYX where X and Y are direct and inverse mutations, respectively, is mandatory to reduce the well-known problem of robustness in predicting the effects of direct and inverse mutations. Special care must be given to train machine learning methods, which appear to be the trend methods for such applications in the future but which tend to be more biased than physics-based methods. This point has been stressed in several assessments [39, 61, 71, 73, 75], and developers have started taking into account this suggestion [84, 86]. We recommend that this point be taken into account by all those who develop a new predictor, regardless of the approach used.
Another well-known problem for machine learning predictors is the tendency of adding many different features in order to take into account all possible factors related to the thermodynamic stability of proteins. Both Pucci and coworkers [61] and Fang [75] agree in deprecating this approach, because in this way the risk of overfitting is greatly increased and the robustness of the predictors is decreased. Additionally, Fang groups the features relevant to protein stability changes in four different types and concludes that most predictors lack features related to changes in the space surrounding the mutation site, because they are difficult to obtain, given that it is necessary to know the structure of mutant protein to have this information. Since the inclusion of these features could represent an improvement of the reliability of this kind of predictors, developers could evaluate if modeling the mutations in the protein structure could provide sufficient improvement in their predictors by taking into account these phenomena.
To date, only one structure-based web server predictor [52] is able to evaluate not only the effect of a single mutation but also of multiple mutations occurring simultaneously in different protein positions and even of multiple mutations occurring in different subunits of multimeric proteins. Few other predictors are capable of dealing with multiple mutations (e.g. FoldX [16], PROTS-RF [39], DDGun [66], and Rosetta [80]), but, being not implemented as web servers, they are not easily accessible to naive users. Some assessors in the past have solicited the development of predictors able to deal with multiple mutations [61], but it seems that so far only a few researchers has answered this appeal. We would like to stress it again, because it would be very useful to implement this possibility in these predictors, considering that these latter cases occur frequently in genetic diseases, in which many patients are compound heterozygous. Indeed, it cannot be assumed that the effect of different mutations occurring in different subunits of the same protein is simply the sum of the effect of the single mutations. Therefore, methods that allow to simulate the real reciprocal influence of two or more mutations on the overall protein stability would be very useful also to interpret, at molecular level, the effects of these combined mutations.
Conclusion
The interest in the development of tools for the prediction of how protein mutations can affect the thermodynamic stability of proteins is still high, and after three decades from the first examples, there is still room for progress in this field. While the assessments on the reliability of the methods raised a number of issues, the progress in the field is evident, and these methods can already provide useful indications when no experimental results are available. This makes us optimistic for their widespread applications in the near future. For the present, however, our take-home message to the users is to be aware of the high number of predictors available to date in this field and of the different approaches to perform predictions, with their problems and pitfalls, before performing a blind prediction using these tools.
Despite nearly 30 years of work and different algorithms implemented so far, methods to predict the effect of mutations on thermodynamic stability of proteins appear to be still an active field of research for computational biology.
The future predictors must be developed by using more reliable datasets of experimental thermodynamic data and of reference structures, including the minimum number of features really necessary to describe those phenomena underlying the effects of mutations on protein’s thermodynamic stability, and taking into account the problem of antisymmetry.
It is of outmost importance to develop predictors that could take into account multiple mutations occurring simultaneously, in order to better predict the effect of these combined mutations on protein stability.
Users must check carefully the approach and the performances of the predictor(s) they would like to use and possibly use more predictors based on different approaches to increase the reliability of their results.
Funding
This work was supported by the University of Salerno, Fondi di Ateneo per la Ricerca di base [grant numbers ORSA170308, ORSA180380 to A.M.] and by the Italian Ministry of University and Research, FFABR 2017 program and PRIN 2017 program [grant number: 2017483NH8 to A.M.]
Prof. Anna Marabotti is an associate professor of the University of Salerno. Her main research focus is the analysis and prediction of structures and structure–function–dynamics relationships of proteins involved in rare diseases.
Dr. Bernardina Scafuri is a postdoctoral researcher in the research group of Dr. Anna Marabotti at the University of Salerno. She is actively involved in studies of proteins of different sources using structural bioinformatics approaches.
Dr. Angelo Facchiano is a senior researcher at the Institute of Food Sciences, CNR Italy. His research interests include biochemistry, genetics and molecular biology, bioinformatics and computational biology.
