


Abstract
Tumor-infiltrating immune cells (TIICs) have been recognized as crucial components of the tumor microenvironment (TME) and induced both beneficial and adverse consequences for tumorigenesis as well as outcome and therapy (particularly immunotherapy). Computer-aided investigation of immune cell components in the TME has become a promising avenue to better understand the interplay between the immune system and tumors. In this study, we presented an overview of data sources, computational methods and software tools, as well as their application in inferring the composition of tumor-infiltrating immune cells in the TME. In parallel, we explored the future perspectives and challenges that may be faced with more accurate quantitative infiltration of immune cells in the future. Together, our study provides a little guide for scientists in the field of clinical and experimental immunology to look for dedicated resources and more competent tools for accelerating the unraveling of tumor-immune interactions with the implication in precision immunotherapy.
Introduction
The tumor microenvironment (TME) is a spatially organized landscape with dynamic and mixture content of malignant, nontransformed cells (cells of hematopoietic origin and cells of mesenchymal origin) and noncellular components located both in the center and at the invasive margins [1, 2]. There is increasing evidence that the complex interplay between tumor cells and microenvironmental constituents in the TME plays an essential role in tumor growth, invasion and metastasis [1–3]. Emerging data has indicated that tumor-infiltrating immune cells represented a significant component of the TME, and their distribution and abundance in the TME induce both beneficial and adverse consequences for tumorigenesis as well as outcome and therapy (particularly immunotherapy) [4–6]. For example, tumor-infiltrating lymphocytes (TILs) reflect the host antitumor immune response, and its presence and abundance are emerging as the potential predictor of immunotherapeutic response and prognosis in several types of cancer [7, 8]. Tumor-associated macrophages (TAMs) and regulatory T-cells (Tregs) served as suppressors of the anti-tumor immune response, and their presence in the TME is associated with an unfavorable prognosis [9, 10]. Tumor-infiltrating B cells (TIL-B) were found to modulate innate and/or adaptive anti-tumor immunity. Thus, the immunotherapeutic outcome may be enhanced by targeting TIL-B activity [11]. Furthermore, other cellular factors secreted by TICs can also enhance the carcinogenicity of cancer and promote the development of tumors [12].
Therefore, the systematic and precise characterization of immune contexture in the TME is of utmost importance and has become a promising avenue to better understand tumor-immune interactions with the implication in precision immunotherapy. Traditional conventional methods for quantitative analysis of immune contexture in tumor samples comprise making microscopic counting by pathologists using hematoxylin and eosin- (H&E-) or immunohistochemistry (IHC)-stained tumor sections [13–15]. Despite the benefits of traditional microscopy-based techniques, these modalities for evaluation of immune contexture were limited by the lack of phenotypic markers and tissue disaggregation, leading to bias and variability [16]. Therefore, efficient and accurate quantitative evaluation for immune contexture in tumor samples remains a significant challenge. A large number of omics studies have shown that cell-type-specific genomic and molecular features were presented in different immune cell subpopulation and enabled a specific genomic/molecular profiles associated with specific immune cell subpopulation [17, 18], which opened a new horizon to characterize immune contexture. With the rapidly increasing larger-scale available omics data from genomics to epigenetics, considerable efforts have been devoted to infer the composition of tumor-infiltrating immune cells through immunoinformatics algorithms and computational approaches, which provided significant support to experiments to dissect the immune contexture in tumor samples.
In this study, we presented an overview of the computer-aid quantitative analysis of immune contexture in tumor samples. Data sources accessible for immunoinformatics’s study were introduced in detail. Then existing computational methods and software tools, as well as their application in inferring the composition of tumor-infiltrating immune cells were summarized and reviewed. Finally, we explored the future perspectives and challenges that may be faced with more accurate quantitative infiltration of immune cells in the future.
Databases and knowledge bases
Various immunology databases and knowledge bases were constructed and developed to record and store information on all aspects of the immune system, which can be separated to three categories based on the purpose of users: (i) immune cell expression profiles; (ii) immune cell signature genes and (iii) immune cell flow cytometry data (Table 1).
Immune cell expression profiles
RefDIC (the Reference Database of Immune Cells, http://refdic.rcai.riken.jp/document.cgi) [19] is a public resource dedicated to mRNA and protein profiling data for immune cells. Every aspect of the mRNA/protein profile of immune cells can be retrieved in RefDIC.
Overview of data sources accessible for immunoinformatics study
| Categories | Databases | Contents | URLs | References |
|---|---|---|---|---|
| Immune cell expression profiles | RefDIC | Cross-reference information from the transcriptome and proteome of immune cells | http://refdic.rcai.riken.jp/document.cgi | Hijikata et al. [19] |
| ImmGen | The expression data of all cell types in the lymphatic lineage and myeloid from mice | http://www.immgen.org/ | Heng et al. [20] | |
| ImmuCo | A database of gene co-expression in immune cells | http://immuco.bjmu.edu.cn | Wang et al. [21] | |
| ImmuSort | A database on gene plasticity and electronic sorting for immune cells | http://immusort.bjmu.edu.cn/ | Wang et al. [22] | |
| Immune cell signature genes | Immunome | Immune-associated coding genes, proteins, domain structures and ontology terms from human | http://bioinf.uta.fi/Immunome/ | Ortutay et al. [26] |
| IIDB | The Innate Immune Database | http://db.systemsbiology.net/IIDB | Korb et al. [23] | |
| ImmPort | The Immunology Database and Analysis Portal | http://www.immport.org/immport-open/public/home/home | Bhattacharya et al. [58] | |
| MSigDB | Immune gene sets | https://www.gsea-msigdb.org/gsea/msigdb/ | Liberzon et al. [27] | |
| InnateDB | Mammalian innate immune genes, networks and pathways | http://www.innatedb.com/ | Breuer et al. [28] | |
| IEDB | The Immune Epitope Database | http://www.iedb.org/ | Vita et al. [29] | |
| IEDB-AR | Computational tools focused on the prediction and analysis of B and T cell epitopes | http://tools.iedb.org/ | Dhanda et al. [30] | |
| IRIS | Functional annotations, sequence data and chromosomal positions of functional human immune genes | http://www.immunegene.org | Bhattacharya et al. [25] | |
| Immune cell flow cytometry data | 10KIP | Diverse human immunology reference | http://10kimmunomes.org/ | Zalocusky et al. [31] |
| Cytobank | Manage, analyze and share your flow and mass cytometry data on the web | https://www.cytobank.org/ | Chen et al. [32] | |
| FlowRepository | storage, analysis and representation of flow cytometry datasets | http://flowrepository.org/ | Spidlen et al. [33] |
ImmGen (the Immunological Genome Project, http://www.immgen.org/) [20] is a public resource containing the innate and adaptive immune system of the mouse, which investigated the expression data of all cell types in the lymphatic lineage and myeloid within strictly standardized conditions.
ImmuCo (http://immuco.bjmu.edu.cn) [21] is a database of gene co-expression and correlation in immune cells, which contained 20 283 human and 20 963 mouse genes from the Affymetrix Human Genome U133 Plus 2.0 and Mouse Genome 430 2.0 microarrays from 11 human and 7 mouse cell types data.
ImmuSort (http://immusort.bjmu.edu.cn/) [22] is a database on gene plasticity and electronic sorting for immune cells, including 10,422 and 3929 microarrays in 31 human and 17 mouse immune cell groups from public databases. Global differential gene expression data across thousands of experimental conditions in immune cells were provided in ImmuSort.
Immune cell signature genes
IIDB (the Innate Immune Database, http://db.systemsbiology.net/IIDB) [23] is a repository of genomic annotations and experimental data for more than 2000 mouse genes related to immune response behavior and can also calculate predicted transcription factor binding sites. The core of IIDB is the Toll-like receptor (TLR) genes, which are an essential part of innate immunity.
ImmPort (the Immunology Database and Analysis Portal, https://www.immport.org/) is a web portal that mainly stores data and knowledge from mechanistic studies and clinical trials on human subjects and immunology studies on model organisms [24]. The ImmPort was composed of four components, including private data, shared data, data analysis and resources, for data archiving, dissemination, analyses and reuse.
IRIS (the Immunogenetic Related Information Source, http://www.immunegene.org) [25] contains searchable information of 1562 immune genes, including chromosomal location, sequence data and a curated functional annotation.
Immunome (http://immunome.com/) [26] is a database for genes and proteins of the human immune system, which stores information on immune-associated coding genes, proteins, domain structures and ontology terms.
MSigDB (the Molecular Signatures Database, https://www.gsea-msigdb.org/gsea/msigdb/) [27] defines immune gene sets directly from microarray gene expression data for immunological studies.
InnateDB (http://www.innatedb.com/) [28] is a publicly available knowledge base of the genes, proteins, experimentally verified interactions and signaling pathways involved in the innate immune response of humans, mice and bovines to microbial infection. This database also provided integrated bioinformatics and visualization tools for the systems-level analysis of the innate immune response.
IEDB (the Immune Epitope Database, http://www.iedb.org/) [29] catalogs immune data for all species studied, including antibody data on allergies, infections, allogeneic transplants and autoimmune-related diseases, T cell data and MHC binding data. IEDB-AR (Immune Epitope Database Analysis Resource, http://tools.iedb.org/) has been proposed as a companion website to the IEDB that provides computational tools focused on the prediction and analysis of B and T cell epitopes [30].
Immune cell flow cytometry data
10KIP (10 000 Immunomes Project, http://10kimmunomes.org/) is an open and interactive online resource comprising curated, integrated and normalized immunology measurements from more than 10 000 normal subjects [31]. The 10KIP enables visualization and analysis across many studies for immune system differences across age and sex, rapid hypothesis generation and the creation of custom control cohorts.
Cytobank (https://www.cytobank.org/) is a platform to help users handing big cytometric data, including analyze, visualize and archive multiparameter cytometric data [32].
FlowRepository (http://flowrepository.org/) is a public resource for storage, analysis and representation of flow cytometry datasets associated with peer-reviewed manuscripts [33].
Computational principles and algorithms for inferring immune contexture
In this section, we reviewed more than 20 computational methods and tools in inferring immune contexture proposed in recent years. Computational principles and algorithms used in these computational methods and tools could be divided into four categories: (i) machine learning-based principles; (ii) gene set enrichment analysis-based principles; (iii) linear regression-based principles and (iv) nonlinear programming-based principles.
Machine learning-based principles
Machine learning is an essential branch of artificial intelligence. The support vector regression (SVR) [34] is a standard machine learning algorithm and has been applied in calculating the composition of tumor-infiltrating immune cells. The schematic workflow of machine learning-based principles is illustrated in Figure 1.
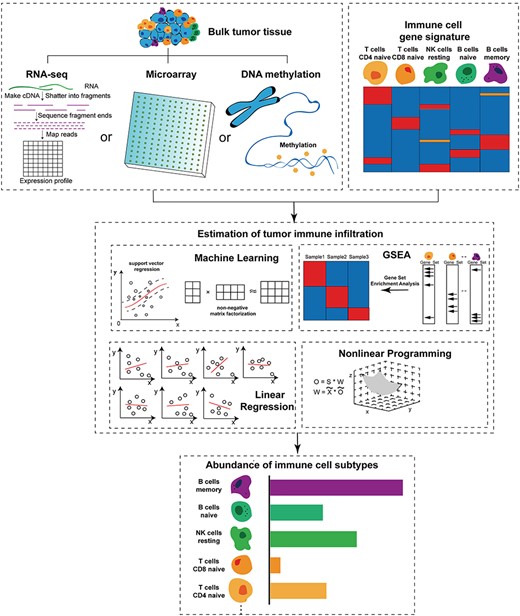
Schematic workflow of computational principles for in silico quantitation of immune contexture in the tumor microenvironment.
Finally, the above formula calculates the optimal loss function |${l}_{\varepsilon }$| to further estimate |$S$|.
Gene set enrichment analysis-based principles
Gene set enrichment analysis (GSEA) determines whether a priori defined gene set shows statistically significant differences in biological data [35]. GSEA derives its function by focusing on gene sets such as chromosomal location and regulation, the groups of genes that have the common biological function. When analyzing expression data of tumor tissue, GSEA ranked according to the degree of correlation between gene expression data and immune cell genes. Second, when each position in the ranking list encounters the corresponding set of immune genes, the running total statistics will increase. Otherwise, it will decrease. Finally, the maximum deviation from zero of the running-sum statistics is chosen as the enrichment score (ES). Each ES represents the relative abundance of a specific immune cell type in the tumor tissue. A higher ES indicates that the abundance of this immune cell type is higher in tumor tissue samples than other immune cell types. Compared with the traditional GSEA method, there is another particular GSEA method called single sample GSEA (ssGSEA), which calculates an ES to represent a particular gene set of a particular sample that is coordinately down- or up-regulated in a single sample. ssGSEA ranked the genes by their expression data, and the ES was obtained by calculating the difference between gene rank and empirical cumulative distribution functions [35, 36]. The schematic workflow of gene set enrichment analysis-based principles in calculating the composition of tumor-infiltrating immune cells is illustrated in Figure 1.
Linear regression-based principles
The relationship between one or more independent and dependent variables is modeled using the least square function called a linear regression equation. This function is a linear combination of one or more model parameters called regression coefficients. Cases where there is only one independent variable are called simple regression, and cases where there is more than one independent variable are called multiple regression. This, in turn, should be distinguished by multiple linear regressions predicted by multiple dependent variables, not a single scalar variable. In linear regression, data is modeled using linear predictive functions, and unknown model parameters are also estimated by data. These models are called linear models. Linear regression is the first type of regression analysis that has been strictly studied and widely used in practice. This is because models that depend linearly on their unknown parameters are more accessible to fit than those that depend nonlinearly on their position parameters, and the statistical properties of the resulting estimates are more comfortable to determine. Linear regression models often use a least-square approximation to fit. However, they may also use another method to fitting, such as minimizing the fitting of the defect in some other specifications (such as minimum absolute error regression), or in the bridge back to minimize the least square loss function of punishment. On the contrary, the least-squares approximation can be used for fitting the nonlinear model. Therefore, although the ‘least squares’ and ‘linear model’ are closely connected, they cannot delimit equal-sign. The schematic workflow of linear regression-based principles in calculating the composition of tumor-infiltrating immune cells is illustrated in Figure 1.
Nonlinear programming-based principles
Nonlinear programming studies the extreme value problem of an n-ary function under the constraints of a set of equations or inequalities and at least one of the objective function and the constraint is a nonlinear function of an unknown quantity. The schematic workflow of nonlinear programming-based principles in calculating the composition of tumor-infiltrating immune cells is illustrated in Figure 1.
|$k$| is the number of immune cell type, |${\overline{g}}_k$| represents the mean expression level of immune cell gene markers for a given immune cell type |$k$|.
|${t}_1$| is the maximum expression level of immune gene marker and |${t}_2$| is the minimum expression level of immune gene marker. At last, R package ‘quadprog’ was used to solve the quadratic programming question.
Computational applications and tools for inferring immune contexture
In this section, more than a dozen computational applications and tools for inferring immune contexture based on the above four computational principles proposed in recent years are reviewed and summarized in Table 2.
Overview of computational tools for quantitative analysis of tumor-infiltrating immune cells from multi-omics data
| Categories | Methods | Tools | Data types | Availability | References |
|---|---|---|---|---|---|
| Machine learning | Support vector regression | CIBERSORT | Microarray | http://cibersort.stanford.edu/ | Newman et al. [37] |
| CIBERSORTx | scRNA-seq | https://cibersortx.stanford.edu/ | Newman et al. [38] | ||
| MethylCIBERSORT | DNA methylation | https://zenodo.org/record/1284582#.Xk_SJXZn254 | Chakravarthy et al. [39] | ||
| ε-SVR | Microarray | https://github.com/holiday01/deconvolution-to-estimate-immune-cell-subsets | Chiu et al. [40] | ||
| ABIS | RNA-seq, Microarry | https://github.com/giannimonaco/ABIS | Monaco et al. [18] | ||
| Gene set enrichment analysis | GSEA | TIminer | RNA-seq, Mutation | http://icbi.imed.ac.at/software/timiner/timiner.shtml | Tappeiner et al. [41] |
| ssGSEA | ESTIMATE | RNA-seq, Microarry | https://sourceforge.net/projects/estimateproject/ | Yoshihara et al. [43] | |
| ImmuCellAI | RNA-seq, Microarry | http://bioinfo.life.hust.edu.cn/web/ImmuCellAI/ | Miao et al. [44] | ||
| xCELL | RNA-seq | https://xcell.ucsf.edu/ | Aran et al. [42] | ||
| Linear regression | Constrained least square regression | TIMER | RNA-seq, Microarray, Mutation | https://cistrome.shinyapps.io/timer/ | Li et al. [46] |
| EPIC | RNA-seq | http://epic.gfellerlab.org, https://github.com/GfellerLab/EPIC | Racle et al. [47] | ||
| DeMix | Microarry | http://odin.mdacc.tmc.edu/∼wwang7/DeMix.html | Ahn et al. [48] | ||
| quanTIseq | RNA-seq | http://icbi.at/quantiseq | Finotello et al. [49] | ||
| Maximum likelihood over the residual sum of squares | MMAD | RNA-seq | http://sourceforge.net/projects/mmad/ | Liebner et al. [50] | |
| Mean expression of marker genes | MCP-counter | RNA-seq, Microarray | http://github.com/ebecht/MCPcounter | Becht et al. [51] | |
| Nonlinear programming | Quadratic programming | DSA | RNA-seq, Microarray | https://github.com/zhandong/DSA | Zhong et al. [53] |
| PSEA | RNA-seq, Microarray | http://www.bioconductor.org/packages/release/bioc/html/PSEA.html | Kuhn et al. [52] |
Machine learning-based applications and tools
CIBERSORT (http://cibersort.stanford.edu/) proposed by Newman et al. is the most popular used tool to estimate the abundances of different tumor-infiltrating immune cells by using support vector regression to solve the deconvolution problem [37]. The original CIBERSORT tool enables estimation of tumor-infiltrating immune cells from gene expression microarray data of bulk tissue using expression signature matrix of 22 immune cells (called LM22). The latest release of CIBERSORTx (https://cibersortx.stanford.edu/) extends the previous version to infer cell type abundance and cell type-specific gene expression from single-cell RNA-sequencing data for dissecting bulk clinical specimens [38].
Considering the limitation of CIBERSORT/CIBERSORTx in DNA methylation data, Chakravarthy et al. developed a CIBERSORT-based pipeline and R package, MethylCIBERSORT, for accurate estimates of tumor purity and cellular composition of tissue mixtures based on genome-wide DNA methylation data [39]. The results from benchmarking comparison indicated that methylation data coupled to CIBERSORT might perform well relative to expression-based CIBERSORT.
Chiu et al. proposed a new immune cell deconvolution method and R package (https://github.com/holiday01/deconvolution-to-estimate-immune-cell-subsets), which used ε-SVR as the core algorithm to quantify the composition of infiltrating immune cells in bulk tumor tissue based on gene expression profiles [40]. The method provides the reference gene expression signature matrix of nine types of immune cells including memory CD8+ T cells, macrophage M2 cells, macrophage M1 cells, naïve CD8+ T cells, T helper cells, regulatory T cells, naïve CD4 T cells, natural killer cells (NK cells) and dendritic cells (DCs). Unlike the ν-SVR in CIBERSORT, the ε-SVR cannot control the ratio of the support vectors to be used in the last model. This indicates that the deconvolution model based on the ε-SVR can provide better flexibility in combining different predictive variables without setting the lower limit of support vectors.
Monaco et al. presented a Shiny app of ABsolute Immune Signal (ABIS) deconvolution on RNA-seq and microarray data to adequately estimate the infiltration ratio of specific immune subsets in bulk tumor data (https://github.com/giannimonaco/ABIS) [18]; ABIS generated normalized signature matrices for a set of immune by characterizing 29 different immune cell types of the peripheral blood mononuclear cell (PBMC) of healthy donors using RNA-seq and flow cytometry. The limitations of ABIS is to require TPM expression values for RNA-seq data and is to need quantile normalization using genes presented in the ABIS-Microarray signature matrix and the ‘target quantiles microarray’ for microarray data.
Gene set enrichment analysis-based applications and tools
Tappeiner et al. developed an analytical pipeline, TIminer (Tumor Immunology miner, http://icbi.i-med.ac.at/software/timiner/timiner.shtml) to dissect tumor-immune cell interaction for RNA-seq and somatic DNA data [41]. TIminer is a user-friendly pipeline capable of performing integrative tumor immunogenomic analyses, including genotyping of human leukocyte antigens (HLAs), predicting the bulk tumor neoantigens, characterization of different tumor-infiltrating immune cells and quantification of tumor immunogenicity within expression matrix.
Aran et al. proposed a gene signature-based web tool, xCell (https://xcell.ucsf.edu/), to infer 64 immune and other cell types in bulk tumor tissue, including hematopoietic progenitors, adaptive and innate immune cells from RNA-seq data, extracellular matrix cells and epithelial cells [42]. The xCELL uses curve fitting methods to make linear comparisons between cell types and to isolate them using novel overflow compensation techniques in transcriptome data from 1822 pure human cell types. For each cell type, the infiltration ratio score was calculated through four main steps: (i) the ssGSEA was used independently for each sample according to 489 gene characteristics of 64 cell types; (ii) ES scores for all gene sets of the same cell type were averaged; (iii) the ES score is converted to the abundance value according to the special platform; (iv) the overflow compensation techniques were used to correct for strong correlations between different cell types. Although the correlation with direct measurements is far from perfect, xCell provides an accurate, sensitive way to identify enrichment of multiple cell types in a mixture, allowing the detection of subtle differences in the enrichment of specific cell types in the bulk tumor tissue with high confidence.
Yoshihara et al. presented a new method and R package, ESTIMATE (Estimation of STromal and Immune cells in MAlignant Tumour tissues using Expression data, https://sourceforge.net/projects/estimateproject/) for inferring tumor purity in tumor tissue [43]. The ESTIMATE used ssGSEA to study the presence of nontumor components (stromal and immune cells) in tumor tissue samples and identified specific characteristics associated with stromal and immune cell infiltration in tumor tissue. Finally, stromal and immune cell scores were estimated to predict the extent of their infiltration within RNA-seq data or microarray data.
The Immune Cell Abundance Identifier (ImmuCellAI, http://bioinfo.life.hust.edu.cn/web/ImmuCellAI/) was recently proposed by Miao et al. to focus on the prediction of T cell subtype abundance [44]. ImmuCellAI can accurately predict the abundance of 24 immune cells (18 T-cell subtypes and 6 other immune cells) from RNA-seq and microarray data from various sources (e.g. tumor, adjacent or normal tissue and peripheral blood). The core algorithm of ImmuCellAI is based on the feature gene set enrichment score instead of the traditional deconvolution method. The ssGSEA is used to calculate the enrichment score of the total expression deviation of the signal gene sets, which were assigned to each immune cell type. The bias caused by the shared marker genes among different immune cell types was corrected using the compensation matrix and least square regression.
Linear regression-based applications and tools
Tumor Immune Estimation Resource (TIMER) developed by Li et al. is a comprehensive computational tool for systematic analysis and visualization of immune infiltrates across diverse cancer types by using constrained least-square fitting on the informative immune signature genes [45, 46]. Besides the estimation of the abundance of six immune cell types (B cell, CD4 T cell, CD8 T cell, neutrophil, macrophage and dendritic cell) in the TME could be estimated from RNA-seq data, microarray data and DNA mutation data, the TIMER also contains six functional modules (including Gene, Survival, Mutation, SCNA, Diff Exp and correlation) to help the user for dynamically exploring and visualizing the interactions between tumor-infiltrating immune cells and primary tumor genomic changes.
Racle et al. developed a new tool, named Estimating the Proportion of Immune and Cancer cells (EPIC, http://epic.gfellerlab.org/) that can estimate the proportion of immune and cancer cells from bulk tumor RNA-seq data [47]. Experimental measurements of several human tumors demonstrated the prediction accuracy of EPIC. EPIC provided two characteristic matrices for immune cells based on RNA-seq data: (i) six circulating immune cell types (CD4 T cells, CD8 T cells, B cells, NK cells, monocytes and neutrophils) from RNA-Seq profiles data; (ii) five major tumor-infiltrating immune cell type (CD4 T, CD8 T, B, NK and macrophages) from the single-cell RNA-Seq data in melanoma patients.
Ahn et al. provided an R package named ‘deconvolution for mixed cancer transcriptomes using raw measured data’ (Demix, http://odin.mdacc.tmc.edu/_wwang7/DeMix.html), to decompose a relatively pure tumor molecular matrix from a mixed clinical tumor tissue expression matrix using deconvolution (i.e. for immunophenotypic analysis of large tumors) from tumor microarray data [48]. Infiltrating immune cells are considered as a confounding factor in the tumor microenvironment, and Demix extracts tumor expression markers from heterogeneous samples by identifying cancer subtypes and tracing the site of origin.
Finotello et al. developed a computational pipeline, quanTIseq, to quantify the tumor immune contexture from bulk RNA-sequencing data [49]. The quanTIseq takes input FASTQ files of RNA-seq reads from tumor samples or other cell mixtures to quantify the fractions of 10 immune cell types and other uncharacterized cells in the bulk tumor tissue [49]. At the same time, the quanTIseq also provides explicitly a complete process for analyzing RNA-seq data, including (i) read data for preprocessing; (ii) quantification of gene expression; (iii) normalization of gene expression, re-annotation of genes and deconvolution.
Liebner et al. introduced a computational tool named microarray microdissection with an analysis of differences (MMAD, http://sourceforge.net/projects/mmad/), to perform microdissection of tumor microenvironment from microarray data [50]. The MMAD has the following features: (i) besides estimating the fraction of different immune cell types in the tumor microenvironment, the MMAD also can estimate the gene expression profile matrix of corresponding cell types; (ii) the deviation of microarray data normalization is adjusted accordingly; (iii) in the process of model optimization, the corrected Akaike information standard was used to control the over-fitting of the model; (iv) compared gene expression values and cell composition in different samples.
Becht et al. proposed a Microenvironment Cell Populations-counter (MCP-counter, http://github.com/ebecht/MCPcounter) method and R package, which robustly estimates the absolute population abundance of eight tissue-infiltrating immune cell types and two stromal cell populations in heterogeneous bulk tumor tissues from transcriptomic data [51]. MCP-counter annotated the data with specific markers, some of which correspond to microenvironmental cell populations, and the rest from nonhematopoietic or cell cancer cell lines.
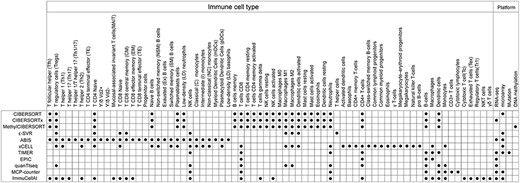
Comparison of immune cell types and platforms applicable to existing computational tools.
Nonlinear programming-based applications and tools
Kuhn et al. developed a computational method and R package, called population-specific expression analysis (PSEA, http://www.bioconductor.org/packages/release/bioc/html/PSEA.html), which allows the quantification of the abundance of each cell population of tissues from RNA-seq data or microarray data [52]. In PSEA, marker gene information is used as a normalization factor in deconvolution analysis of gene expression value matrix. Therefore, the gene expression profile estimated by PSEA is not the absolute gene expression value, but the average expression value relative to the marker genes of each cell type.
Zhong et al. proposed a Digital Sorting Algorithm and R package [53] (DSA, https://github.com/zhandong/DSA) to extract specific gene expression profiles of different cell types from the mixture matrix using quadratic programming, which does not require the frequencies of different cell types as prior knowledge.
Discussion and conclusions
During the past years, cancer immunotherapy has gained much attention and opened a new era of cancer treatment, such as chimeric antigen receptor (CAR) T cell therapy and checkpoint blockade (CPB) therapy [54, 55]. However, a substantial fraction of cancer patients achieve limited responses to current immunotherapies [56]. Clinical investigation and studies have also recently begun to highlight the importance of tumor-infiltrating immune cells as significant contributors to the complex immune response in cancer [57]. The complex interaction between cancer cells and infiltrating immune cells is closely associated with clinical outcome and immunotherapy response of cancer patients. However, the composition and density of infiltrating immune cells in the TME vary in different types of tumors. The specific differences in tumor immune contexture can reflect the heterogeneity of clinical samples. Therefore, the quantitative characterization of infiltrating immune cells in the TME not only can help to figure out the development and mechanism of the human immune system in tumors more effectively but also guide the rational design of immunotherapies in precision immune-oncology.
Although conventional technologies like immunohistochemistry or immunofluorescence staining can study the distribution and localization of markers in formalin-fixed paraffin-embedded tissue sections, they are universally applicable to clinicians and researchers due to the limitation of the high costs, specially built laboratories and complex experimental procedures. These limitations have pushed immunologists and cancer researchers toward the use of computer-aid technologies in combination. The rapidly increasing quantity and quality of bioinformatics databases and resources of multi-omics data generated from high-throughput technologies have necessitated immunoinformatics as an active field of cancer immunology. Computer-aided quantitative analysis of infiltrating immune cells has become a promising avenue for facilitating the unraveling of tumor-immune interactions. To compensate for this dearth, considerable efforts have been devoted to developing computational models, algorithms and tools for systematically characterizing the landscape of infiltrating immune cells in the TME through fully taking advantage of genomic, transcriptomic and epigenomic data.
In this work, we first summarized data and knowledge sources available for the immunoinformatics study. Then we present a detailed overview of previously proposed computational methods, tools and applications for quantitative analysis of infiltrating immune cells in the TME. Based on the core idea implemented, these computational methods could be divided into four categories: (1) machine learning-based principles; (2) gene set enrichment analysis-based principles; (3) linear regression-based principles and (4) nonlinear programming-based principles. Nonlinear programming-based principles do not require the frequencies of different cell types as prior knowledge and only use, whereas the other three principles rely on prior knowledge of marker genes of different immune cell subsets and molecular profiles (Figure 1). Machine learning-based principles can computationally estimate the absolute proportion of immune cell infiltration in tumor tissue, whereas gene set enrichment analysis-based principles can infer the relative proportion of infiltrating immune cells in tumor tissue.
Although the performance of each computational method is very significant according to the report in their papers, one emerging critical issue is that these methods used the different data sources and were suitable for different immune cell subpopulations (Figure 2) lacking benchmark performance evaluation. CIBERSORT is constructed based on idealized mixtures. Unlike actual tumor tissue mixtures, idealized mixtures used well-defined components and have little contribution to the unknown cell content. Compared with three other deconvolution methods (linear least-squares regression (LLSR), quadratic programming (QP) and perturbation model for gene expression deconvolution (PERT)) under all the same test conditions, CIBERSORT is superior to other methods [37]. Compared with CIBERSORT, the Methyl CIBERSORT method supports DNA methylation data. TIMER was originally only available for microarray data but now also for RNA-seq data. Compared with TIMER, CIBERSORT faces the problem of statistical collinearity. Although TIMER uses multiple cofactors for correction, the ability of TIMER for locating or capturing tumor cell heterogeneity is limited due to the use of transcriptome profiles from whole tissues at a single time point [41]. Compared with CIBERSORT using LM22 for deconvolution, ABIS uses absolute deconvolution based on RNA-seq data to calculate the infiltration of 29 different cell types. TIminer and quanTIseq not only performed the quantitative assessment of immune cells but also provided methods for studying infectious diseases, inflammation or autoimmunity. ESTIMATE and xCELL method can robustly perform quantitative analysis of infiltrating immune cells under the influence of noise based on the ssGSEA, but the correlation with direct measurement results is not perfect and needs to be strengthened [42, 43]. The ImmuCellAI not only can be applied to estimate the abundance of 18 T-cell subsets but also can predict patient response of CPB therapy [44]. EPIC quantified the proportion of infiltrating immune cells utilizing the immune signature genes which are low or not expressed in tumor cells, thereby overcoming some limitations of reference gene expression profiles from circulating immune cells used in previous computational approaches [47]. When different tumor subtypes exist, Demix is only suitable for samples with the same subtype. MMAD can flexibly perform deconvolution on microarray data but is not suitable for RNA-seq data. Unlike CIBERSORT, MCP-counter is used to estimate the absolute abundance of specific immune cell types in multiple samples, while CIBERSORT estimates the relative proportion of immune cell types in a single sample. In two nonlinear programming-based DSA and PSEA, the estimated results of DSA are closer to the absolute abundance measured by pure immune cell population than PSEA.
Although multiple computational approaches have been developed for the quantification of tumor-infiltrating immune cells, further efforts are still needed for improving accuracy, reliability and usability. Existing methods are often limited to only a single omics layer at a time, which may result in biologically irrelevant variations. Thus incorporating multiple omics data into the modeling process will reveal complementary insights into the immune contexture in the tumor microenvironment. With the growth of the single-cell omics data, we foresee a rapid inclusion of the spatiotemporal localization of immune cells to the existing computational methods for continuous improvements in sensitivity and affordability. Although distinct limitations and weakness exist, the implementation of efficient and reliable computational methods and tools to assist the characterization of infiltrating immune cells in the TME is essential to advance the field as precision immuno-oncology further.
The deficiencies of traditional measurements limit the precise assessment of TIICs. These limitations have pushed immunologists and cancer researchers toward the use of computer-aid technologies in combination.
The rapidly increasing quantity and quality of bioinformatics databases and resources of multi-omics data generated from high-throughput technologies have necessitated immunoinformatics as an active field of cancer immunology.
Great efforts have been devoted to developing computational models, algorithms and tools for systematically characterizing the landscape of infiltrating immune cells in the TME through fully taking advantage of genomic, transcriptomic and epigenomic data.
The implementation of efficient and reliable computational methods and tools to assist the characterization of infiltrating immune cells in the TME is essential to advance the field as precision immuno-oncology further.
This study provides a little guide for scientists in the field of clinical and experimental immunology to look for dedicated resources and more competent tools for accelerating the unraveling of tumor-immune interactions with the implication in precision immunotherapy.
Acknowledgements
Not applicable.
Funding
This study was supported by the National Natural Science Foundation of China (Grant No. 61973240) and the Scientific Research Foundation for Talents of Wenzhou Medical University (QTJ18029 and QTJ18024). The funders had no roles in study design, data collection and analysis, decision to publish or preparation of the manuscript.
Authors’ contributions
J.S. and M.Z. designed the study; Z.C.Z., S.Q.B., C.C.Y. and P.H. collected and reviewed literature. J.S., M.Z. and Z.C.Z. drafted the manuscript. All authors read and approved the final manuscript.
Conflict of Interest statement
The authors have declared no conflicts of interest.
Ethics approval and consent to participate
Not applicable.
Consent for publication
Not applicable.
Zicheng Zhang is a graduate student at the School of Biomedical Engineering, Wenzhou Medical University. His research interests include bioinformatics and immunoinformatics.
Siqi Bao is a graduate student at the School of Biomedical Engineering, Wenzhou Medical University. Her research interests include bioinformatics and translational medicine.
Congcong Yan is a graduate student at the School of Biomedical Engineering, Wenzhou Medical University. Her research interests include bioinformatics and disease systems biology.
Ping Hou is a graduate student at the School of Biomedical Engineering, Wenzhou Medical University. Her research interests include bioinformatics and cancer epigenetics.
Meng Zhou is an associate professor at the School of Biomedical Engineering, Wenzhou Medical University. His research interests include bioinformatics and computational precision medicine.
Jie Sun is an associate professor at the School of Biomedical Engineering, Wenzhou Medical University. Her research interests include cancer bioinformatics and translational medicine.
