


Abstract
Protein dynamics is central to all biological processes, including signal transduction, cellular regulation and biological catalysis. Among them, in-depth exploration of ligand-driven protein dynamics contributes to an optimal understanding of protein function, which is particularly relevant to drug discovery. Hence, a wide range of computational tools have been designed to investigate the important dynamic information in proteins. However, performing and analyzing protein dynamics is still challenging due to the complicated operation steps, giving rise to great difficulty, especially for nonexperts. Moreover, there is a lack of web protocol to provide online facility to investigate and visualize ligand-driven protein dynamics. To this end, in this study, we integrated several bioinformatic tools to develop a protocol, named Ligand and Receptor Molecular Dynamics (LARMD, http://chemyang.ccnu.edu.cn/ccb/server/LARMD/ and http://agroda.gzu.edu.cn:9999/ccb/server/LARMD/), for profiling ligand-driven protein dynamics. To be specific, estrogen receptor (ER) was used as a case to reveal ERβ-selective mechanism, which plays a vital role in the treatment of inflammatory diseases and many types of cancers in clinical practice. Two different residues (Ile373/Met421 and Met336/Leu384) in the pocket of ERβ/ERα were the significant determinants for selectivity, especially Met336 of ERβ. The helix H8, helix H11 and H7-H8 loop influenced the migration of selective agonist (WAY-244). These computational results were consistent with the experimental results. Therefore, LARMD provides a user-friendly online protocol to study the dynamic property of protein and to design new ligand or site-directed mutagenesis.
Introduction
In protein dynamics, the forces, mechanics and motions are integrally associated with its structure in determining both the function and ability for adaptation to a diverse set of conditions. The ligand-driven protein dynamics, also known as induced-fit (IF) hypothesis, is central to the understanding of biology at the molecular level [1–3]. In the IF hypothesis, ligand entry and binding may drive the transitions of proteins from an ‘inactive’ conformation to an ‘active’ conformation [4]. Therefore, ligand recognition, especially migration process, may significantly influence the internal atomic fluctuations of protein, thereby modulating its function. It is likely to dramatically impact our views and strategies in drug design, enzyme catalysis and molecular evolution [5, 6]. For example, Ariotti et al. found a novel switch region regulating H-ras membrane orientation and signal output based on protein dynamic analysis [7]. De Fabritiis et al. generated a complete picture of the free-energy surface along the unbinding pathways of benzamidine in trypsin, triggering the discovery of three representative transition states [8]. Hence, studying protein dynamics, especially profiling the influence of ligand on protein dynamics, is a core issue in biology.
The broad availability of X-ray structures of proteins renders well-established techniques to derive and to reveal important dynamic information in proteins [9]. Molecular dynamics (MD) simulations have been proven to be valid for understanding the relationship between protein structure and dynamics at the atomic level [6, 10–12]. The conventional molecular dynamics (CMD) simulations are the most widely used to describe the binding mode of ligand and the variation of protein internal dynamics. Steered molecular dynamics (SMD) with external forces applied on the ligand may shed novel light on how ligand motion alters protein flexibility, conformation and function. A wide range of computational tools have been designed for post-processing of MD trajectories to explore protein dynamics, such as Bio3d [13], MDTraj [14], MDAnalysis [15] and MD-TASK [16]. In addition, normal mode analysis (NMA), assuming the system is stabilized by harmonic potentials, provides information on the equilibrium modes accessible to a system [17, 18]. These methods, taking flexibility explicitly into account, may be used for better understanding of the relationships between structure and function [19–21]. However, the usability of these tools is occasionally restricted by command line dependencies, installation obstacles or nontrivial user interfaces, which pose challenges, especially for nonexpert users.
Therefore, practical web servers have been developed to investigate protein dynamics, including NMSim [22], DynaMine [23] and TRAPP [24]. In NMSim, multiscale modeling is performed on protein conformational changes based on normal mode geometric simulations. DynaMine provides predictions for the fast backbone movements of proteins based on their amino-acid sequence by statistical analysis of NMR chemical shift data. Moreover, TRAPP provides capabilities for a wide-ranging interactive analysis of pocket dynamics through integrated a range of tools. These web servers provide highly user-friendly interface based on different methods. However, limited attention has been paid to the development of toolkits for the easy and consistent investigation and visualization of ligand-driven protein dynamics has received less attention, which requires a daunting level of effort and expertise. Therefore, it is particularly challenging to perform such computations.
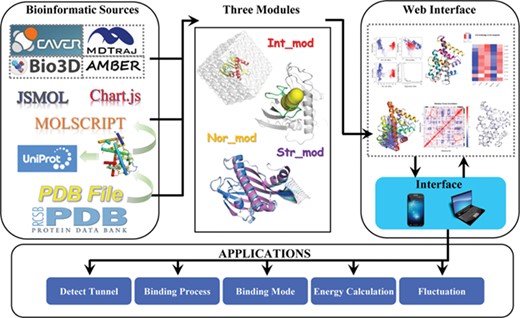
In this study, we present LARMD (http://chemyang.ccnu.edu.cn/ccb/server/LARMD/ and http://agroda.gzu.edu.cn:9999/ccb/server/LARMD/) by integrating with CAVER3.0 [25], AMBER16 [26, 27], MDTraj [14], R [13], ChemAxon, JSmol, Chart.js and MolScript [28], aiming to solve the problem of profiling ligand-driven protein dynamics. It provides an automatic protocol for conformational sampling and analysis. In addition, a practical case of estrogen receptors (ERs) associated with sexual maturation and gestation was used to show the application of LARMD in detail. ERβ, a well-known potent tumor suppressor, plays a crucial role in the treatment of cancers, such as breast cancer, prostate cancer and ovarian cancer [29–32]. Moreover, we explored the activation mechanism of ERβ-selective agonists by using LARMD. Furthermore, its performance was assessed based on experimental data of 34 proteins involving 80 ligands. These complexes were selected based on size, flexibility and channel shape. Consequently, it shows that the integration of bioinformatic tools may be helpful to directly present dynamic processes and to give rise to reasonable hypotheses. This web-based toolkit may simplify the challenges concerning the analysis and visualization of the correlations between protein structure and dynamics in ligand recognition.
Results and discussion
Available bioinformatic tools to study protein dynamics
A variety of tools are available for conformational dynamics, which could be categorized into two classes: conformational sampling tools and conformational analysis tools. NMA might be used to perform conformational sampling and to calculate fluctuation of protein. MD also may be used for conformational sampling, during which parameter calculation and conformational stability analysis are required. The system stability may be evaluated by root mean square deviation (RMSD), radius of gyration (Rg) and fraction of native contacts (Q). Among them, the RMSD is the root mean square deviation of atomic positions which is used to measure the average distance between the atoms of superimposed ligand and proteins over time [33]. Rg is defined as the root mean square distance from each atom of the protein to their centroid [34]. Q captures the transition states for the proteins with a folding free energy barrier [35]. Routinely, it is required to explore the conformational dynamics of a molecular system as well as the energetics of ligand binding. Root mean square fluctuation (RMSF) reports on the fluctuations that take place on a per residue basis during the simulation. B-factor is directly related to the mean square isotropic displacement of the atom. Principal component analysis (PCA) is considered as an effective tool to cluster conformations. Dynamic cross-correlation is a popular method to evaluate residue correlation based on the trajectories of MD [36]. The network is extensively utilized to describe topology and dynamics of proteins. Based on it, the system is perceived as a set of interacting elements, which are bound together by links [37]. Meanwhile, hydrogen bond analysis and binding affinity calculation are applied in the protocol. In addition, ligand binding tunnel identification should be included in the SMD simulation. The typical tools are summarized in Table 1.
The methods and tools available to study protein dynamics
| Classification | Methods | Content | Public software | Online tools |
|---|---|---|---|---|
| Conformational sampling | Tunnel identification | Tunnel information | trj-cavity [38], CAVER [25], CAVER Analyst [39] | GCMC/BD [40], CASTp [41], MolAxis [42], PoreWalker [43] |
| MD | CMD, AMD, TMD, SMD, REMD | AMBER, CHARMM [44], LAMMPS [45], NAMD [46] | MDWeb [47] | |
| NMA | Gaussian network model (GNM), anisotropic network model (ANM) | Bio3d [13], MDTraj [14] | ElNémo [48], WEBnm@ [49], Molmov NMA [50], NOMAD-Ref [51], ProDy [52], iMODS [53], iGNM 2.0 [54], DynOmics ENM [55], AD-ENM | |
| Conformational analysis | System stability analysis | RMSD, Rg, RMSF, B-factor | Cpptraj [56], Bio3d, MDTraj, MDAnalysis [15] | |
| PCA | Principal Components | Bio3d, pyPcazip [57], Cpptraj | ProDy | |
| Dynamic cross-correlation | Correlated and anti-correlated residues | Bio3d, MD-TASK [16], CONAN [58] | ||
| Network analysis | Residues communities | Bio3d, MD-TASK | NAPS [59] | |
| Hydrogen bond analysis | Hydrogen bond information | Cpptraj, HBAT [60], MDAnalysis | COGNAC [61] | |
| Binding free energy | Docking Score, free energy perturbation (FEP), thermodynamic integration (TI), Bennett acceptance ratio (BAR), Jarzynski relationship, umbrella sampling | MM/PBSA [62], ParseFEP [63], pymbar [64], WHAM [65] | BAPPL [66] |
The online tools are not used in the protocol. Therefore, the public softwares were compared and reviewed here. For tunnel identification, there are three available local softwares. Trj-cavity is implemented within the GROMACS framework. CAVER Analyst is the graphical application. CAVER is the command line version of CAVER Analyst, which is easier to be applied in the web server. AMBER, CHARMM, LAMMPS and NAMD are widely used softwares with popular force fields in MD simulation [67, 68]. At the same time, there are many methods for performing free energy calculations, such as docking scoring, molecular mechanics Poisson–Boltzmann surface area (MM/PBSA), free energy perturbation (FEP), thermodynamic integration (TI) and the multistate Bennett acceptance ratio estimator (MBAR). Among them, relatively inexpensive MM/PBSA was applied in many web servers, including ACFIS [69], AMMIS [70] and farPPI [71]. For hydrogen bond analysis, HBAT is a tool used to analyze the hydrogen bonds present in a PDB structure, which is not as powerful as the Cpptraj module of AMBER. From Table 1, we found that Bio3d contains utilities for the analysis of MD trajectory and protein structure. It is easy to be integrated into the web server to perform PCA, dynamic residue cross-correlation analysis and network analysis.
The modules and usage of LARMD
LARMD contains three computational modules. Nor_mod is a module for fast evaluation of the dynamic regions of a specific protein with the observed robustness of the global modes [17]. Int_mod aims to investigate the fluctuation of the protein, while Str_mod is used to determine the influence of ligand migration on protein dynamics. Moreover, the widely used software is integrated into three modules, including CAVER3.0, AMBER16, MDTraj and Bio3d (Figure 1). LARMD is characterized by the easy preparation of the inputs of all modules, and some items are optional to meet the purpose of individual projects. The download of output structure files and related data is provided. To visualize and analyze the result on the webpage, the plug-ins and software, such as JSmol, Chart.js and MolScript, are used [28]. How Nor_mod, Int_mod and Str_mod work together to make the online study of ligand-driven protein dynamics possible is shown in Figure 1.
The workflow of LARMD. Int_mod, Str_mod and Nor_mod run in parallel mode.
This server consists of six essential web pages, ‘Home’, ‘Submit’, ‘Jobs’, ‘Help’, ‘Citation’ and ‘Contact’ (Figure 2). To be specific, a brief introduction and the framework of LARMD are offered at ‘Home’ webpage. ‘Submit’ is used for submitting a job. To make this server more user-friendly, the work will be started by uploading a PDB file or entering a PDBID (Figure 2A). The electrostatic field of the receptor may be prepared with PDB2PQR Server under different pH values before uploading [72]. The customization on the settings is achieved by clicking the ‘Advanced Options’ button, and the solvent model and MD time are adjusted in Int_mod and Str_mod. In addition, the input files prepared for minimization and MD are uploaded through ‘Upload infiles’ on the submitting job webpage. If a complex structure is submitted to LARMD, all the nonstandard residue(s) will be listed to point out for energy calculation and trajectory analysis (Figure 2B). The job will be formally submitted after the confirmation of this information (Figure 2C). ‘Jobs’ shows the status and the result of each job. Additionally, the results of fluctuation, deformation energy, residue correlation and protein structure network derived from NMA, binding free energy and energy decomposition of the complex will be provided in Nor_mod (Figure 2D). The PCA, conformation cluster and dynamic residue cross-correlations are shown in Int_mod (Figure 2F). In addition, Int_mod may also be used to investigate the interaction mode between ligand and protein. Hence, if a complex structure is submitted, the hydrogen bond analysis, the binding free energy and energy decomposition will be performed in Int_mod (Figure 2E). The tunnel for ligand migration and work profile from SMD based on the Jarzynski relationship are generated in Str_mod [73] (Figure 2G). Results from each module at LARMD may be visualized directly on interactive interfaces or downloaded as images in high-resolution or vector format. Meanwhile, ‘Help’ provides detailed guideline and joint problems for application. ‘Citation’ shows the related papers. Users may send messages to us at ‘Contact’ webpage.
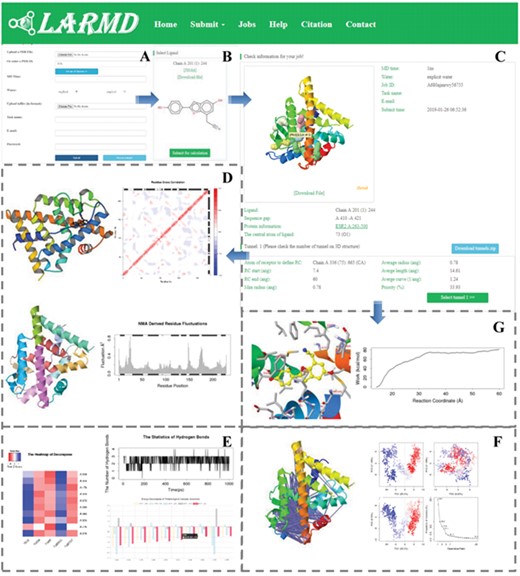
Screenshots of the LARMD. A. The job submitted webpage. B. The ligand selected webpage. C. The checking job webpage of Str_mod. D. The results of Nor_mod, including residue fluctuation, residue correlation and protein structure network. E. The results of energy calculation, decomposition and hydrogen bond analysis. F. PCA and dynamic residue cross-correlations. G. The energy profile with ligand unbinding and conformation analysis derived from Str_mod.
Case study on the selective activation of ER
ER belongs to the nuclear receptor superfamily, which is activated by the hormone estrogen (17β-estradiol) [74]. ERα and ERβ are two highly homologous subtypes of ER. ERα is mainly present in the ovary, uterus, mammary gland, bone and male reproductive organs. On the contrary, ERβ is mostly found in the epithelium of prostate, bladder, colon, immune system and adipose tissue. The differentiated functions and expression patterns have attracted great efforts to discover subtype-specific ligands with high selectivity [75, 76]. From a clinical perspective, ERβ-selective agonists might be accompanied with fewer side effects, which, therefore, might be a suitable treatment for several inflammatory diseases, cardiovascular disease, Alzheimer’s disease, hot flashes and some types of cancer [77]. Hence, it is of great significance to investigate the mechanism of ERβ-selective agonists for drug discovery. In this case study, (WAY-244)-ERβ/ERα complex crystal structures (PDBID: 1x78 and 1x7e) were submitted to LARMD [78]. WAY-244 is a derivative of benzofuran with high selectivity (75.9-fold) to ERβ over ERα [79]. The default values were applied in this case. The results are shown on the ‘Jobs’ webpage as public examples with task names (‘ER_Nor_mod’, ‘ER_Int_mod’ and ‘ER_Str_mod’).
Case study part 1: analysis of protein dynamics of ERβ
To investigate the selective activation of ERβ, we explored the functional motions and structural flexibilities of ERβ based on NMA, which is particularly useful in analyzing the low-frequency modes of action. Hence, Nor_mod was used for this task. In brief, the PDB file (PDB ID: 1x78) of monomeric (WAY-244)-ERβ was uploaded. The ligand ‘Chain A 201 (1): 244’ was chosen for analysis. Its residue name is 244 with the residue sequence number 201 in chain A. The gene name of ERβ (ESR2) was shown, and the corresponding UniProt link (https://www.uniprot.org/uniprot/Q9TTE5) may be clicked. Chain A with the residue sequence number ranging from 263 to 500 was used to perform NMA. Of note, there was a gap between residue 410 and 421 in chain A. As a result, disulfide bonds and cofactors were not found. Finally, the job would be submitted after the confirmation of this information.
A total of 10 normal modes and their frequencies were calculated for ERβ. The NMA-derived residue fluctuation was shown in Supplementary Figure 1A and B. As was shown, there were three peaks around position 25 (Ala287), 150 (Ser422) and 175 (Ser447). To be specific, the first peak at the loop was near the N terminal, the second peak was caused by the gap between residue 410 and 421 and the third peak indicated the extreme flexibility of the H10–H11 loop. To further confirm the accuracy of the calculation, the NMA-derived residue fluctuation of ERβ was also compared with the B-factor from the crystal structure (Supplementary Figure 2). Also, the calculated fluctuation is able to capture the main feature of B-factor. The correlation between calculated residue fluctuation and experimental B-factor is 68%. Different from fluctuations, deformation analysis is used to measure local flexibility in the protein structure, which is atomic motion relative to neighboring atoms. The deformation energy of residues near the flexible area was higher than others (Supplementary Figure 1C). The atomic fluctuations of a certain system are always correlated with one another; hence, the correlation is assessed by examining the magnitude of all pairwise cross-correlation coefficients. Based on the results shown with the dynamic cross-correlation map (DCCM) and 3D structure ( Supplementary Figure 1D and E), there was no strong anti-correlated or correlated residues in short or long distance. To simplify the model, the residues with a high degree of correlated motion were clustered in the same community. As a result, the residues in the ERβ were divided into 15 communities based on network analysis, as shown in Supplementary Figure 3A. The helix H11 was separated into two communities, with low correlation with other communities (Supplementary Figure 3B) [13]. Based on previous analysis, we concluded that this protein was extremely stable, except for the H10–H11 loop, which influenced the energy distribution of protein and separated the helix H11 into two communities. In addition, a previous study has revealed that the flexibility of helix H11 represented a physiological response [80]. Taken together, Nor_mod provided a convenient method to visualize modes, to analyze residue fluctuations, to calculate deformation energy and to analyze the protein structure network.
Case study part 2: influence of WAY-244 binding on protein dynamics of ERβ
To obtain better understanding on the influence of WAY-244 binding on protein dynamics, we analyzed the binding modes of WAY-244 in the crystal structure of ERβ and ERα. WAY-244 forms a T-shaped π–π interaction with Phe356 in ERβ, which corresponds to Phe404 of ERα (Figure 3A and B). In addition, WAY-244 is likely to form four hydrogen bonds with Glu305, Leu339, Arg346 and His475 in ERβ (Figure 3A and Supplementary Figure 4A). These interactions are similar in ERβ and ERα. Only the hydrogen bond with the oxygen atom in the backbone of Leu387 (corresponding to Leu339 in ERβ) is replaced with the carboxyl of Glu353 (corresponding to Glu305 in ERβ) in ERα (shown in Figure 3B and Supplementary Figure 4B). Therefore, the overall binding modes of WAY-244 are similar in the two crystal structures.
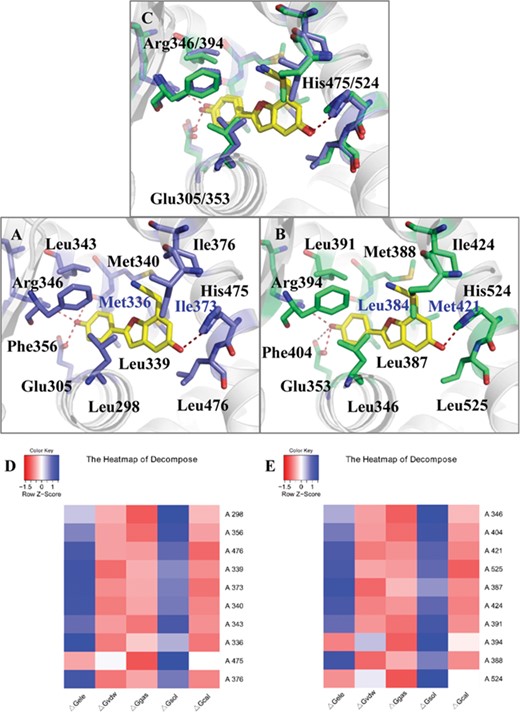
The binding modes of (WAY-244)-ERβ (PDBID:1x78, A) and (WAY-244)-ERα (PDBID:1x7e, B) based on crystal structures, calculated binding mode (C) and decomposition result of ERβ and ERα (D, E). The cartoon was colored with white, WAY-244 was colored with yellow and important residues of ERβ and ERα were colored with purple (A) and green (B). Two different residues in the binding domains were highlighted with blue residue names (ERβ: Met336, Ile373; ERα: Leu384, Met421). The crystal structures rotated 180° in the horizontal direction were shown in Supplementary Figure 4. The residues with the contribution in the top 10 were arranged from top to bottom according to the energy (‘△GB’) from large to small, and values were centered and scaled in the row direction presented in heat-map colored from red (−1.5) to blue (1) (D, E).
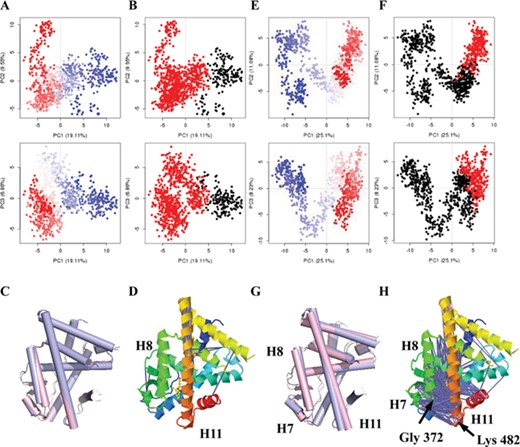
The PCA cluster of conformations and dynamic residues cross-correlation results of (WAY-244)-ERβ from Int_mod (A, B, C and D) and Str_mod (E, F, G and H). PCA results for a trajectory with trajectory frames colored from blue to white to red in time order (A, E). The snapshots were divided into two clusters (black and red) according to top 3 PC-spaces shown in the PC subspace (B, F). Two conformations from two clusters were superimposed. They were shown in C and G. The conformation of the first type was shown in light blue, and the conformation of the second type was shown in light pink. The residue correlation was shown based on the 3D structure of (WAY-244)-ERβ (D, H), with the cartoon colored with rainbow from the N-terminus (blue) to the C-terminus (red). The pink lines depict a pair of residues with correlation coefficient >0.8, and the blue lines depict a pair of residues with correlation coefficient <−0.4. Corresponding DCCMs were shown in Supplementary Figure 8.
In order to further analyze the dynamic properties of these interactions, CMD through Int_mod was used to explore the binding mode of (WAY-244)-ER. The job submission was similar to Nor_mod. In consideration of the same conformation analyses of two systems, only the corresponding result of ERβ was shown here. The RMSD, Rg and Q values were used to check the stability of the MD trajectory. As a result, the average RMSDs of CA atoms in ERβ and heavy atoms in ligand versus the starting structure were 1.17 ± 0.23 and 0.24 ± 0.08 Å (Supplementary Figure 5A). They were normally distributed around 1.25 and 0.24 Å (Supplementary Figure 5B and C). The Rg value fluctuated between 17.6 and 18.0 Å (Supplementary Figure 5D), and the Q value was larger than 95% (Supplementary Figure 5E). Based on the analysis of RMSD, Rg and Q values, the MD trajectory of (WAY-244)-ERβ reached equilibrium, which, therefore, could be used for further analysis.
PCA and dynamic cross-correlation analysis were performed to evaluate the allosteric effect of ERβ under WAY-244 binding based on MD trajectory. Previous experience suggests that around three principal components are generally sufficient to capture approximately 50% of the total variance in a given family of structures from a standard MD trajectory. Thus, a handful of principal components are sufficient to provide a useful description while still retaining most of the variance in the original distribution [13]. However, it is still difficult to describe all the atomic motions based on the top three principal components. The residue-wise loadings for PC1, PC2 and PC3 were similar to the residue fluctuation derived from Nor_mod (Supplementary Figure 6A–C), indicating that the PCA result was reasonable. Therefore, the snapshots were divided into two clusters (black and red) according to top 3 PC spaces shown in PC subspace (Figure 4B). The conformation was changed from the first type to the second type in order of MD time (colored from blue to white to red, Figure 4A and B). Furthermore, the clustering information of snapshots may be downloaded from the webpage, including the snapshot number and classification number. Therefore, the typical conformations from the two clusters may be compared. The two typical conformational clusters were not significantly different (Figure 4C). Hence, the PCA result of (WAY-244)-ERβ indicated no significant allostery. To further validate the PCA method and compare the accuracy of the residue fluctuation derived from Nor_mod and Int_mod, the correlations between the calculated result and B-factor from the crystal structure were calculated based on 80 complexes of 34 proteins (Supplementary Table 1, Supplementary Figure 7). It seems that the B-factor derived from Int_mod was mostly closer to the experimental data. The correlation of the calculated B-factor and experimental B-factor ranging from 12 to 80% was centered at 60%, which is higher than that of the PC1 residue-wise loadings from Int_mod (centered at 55%). The density plots of the PC1 residue-wise loadings and B-factor were similar, indicating that the PCA result is reasonable. The accuracy of residue fluctuation derived from Nor_mod was relatively lower (centered at 50%). However, Nor_mod showed its potential in some systems, especially β-lactamase, androgen receptor and c-SRC kinase. Meanwhile, we found that the residue fluctuation of the protein with a long loop was hard to predict, such as Arginase-1 and dihydroorotate dehydrogenase A. Furthermore, there were only a few strong anti-correlated residues in short distance (Figure 4D and Supplementary Figure 8A).
To further reveal the influence of WAY-244 on protein from the energy perspective, we subsequently performed the binding free energy calculation, hydrogen bond analysis and free energy decomposition. Consequently, the binding free energy of (WAY-244)-ERβ (△GPB = −9.14 kcal/mol, △GGB = −15.27 kcal/mol) was higher than that of (WAY-244)-ERα (△GPB = −7.02 kcal/mol, △GGB = −13.13 kcal/mol), in accordance with the experimental result (IC50ERβ = 14 nM, IC50ERα = 1063 nM, Supplementary Table 2). Hydrogen bond analysis revealed that the hydrogen bonds with two oxygens of carboxyl at the side chain of Glu305 were in dynamic equilibration, and the hydrogen bond between ligand and the Nδ atom of His475/His524 (ERβ/ERα) was very stable. In addition, Arg346/Arg394 (ERβ/ERα) formed a hydrogen bond with ligand intermittently (Supplementary Table 3). Notably, the lost hydrogen bond between WAY-244 and Leu339 of ERβ (Leu387 of ERα) was not stable. Hence, the hydrogen bond numbers fluctuated between two and three (Supplementary Figure 9).
There were two different residues in the binding pockets of ERβ and ERα (Met336/Leu384 and Ile373/Met421 of ERβ/ERα, highlighted in blue residue names in Figure 3A and B and Supplementary Figure 4A and B). To compare the residue contribution for WAY-244 binding, the result of energy decomposition was provided (Figure 3D and E). The residues with decomposition energy ranked in the top 10 were shown through a heat-map and bar diagram. To be specific, in the heat-map, residues were arranged from top to bottom with the energy contribution (△G) changing from large to small. The energies were centered and scaled in the row direction with color from red (−1.5) to blue (1). Met336 of ERβ was found among the top 10 residues (Figure 3D); however, Leu384 at the same position of ERα was not included in the top 10 (Figure 3E). It might be caused by the van der Waals (VDW) contribution of Met336 (△Gvdw = −0.92 kcal/mol, Supplementary Figure 10A). While Leu384 with a shorter side chain may weaken this function in ERα (△Gvdw = −0.54 kcal/mol). Another different residue was Ile373/Met421 of ERβ/ERα. The energy contribution of this residue ranked the fourth and third in ERβ and ERα, respectively. In spite of the effects of the shorter side chain of Ile373 on the hydrophobic interaction, the distance between this residue and ligand was shorter. Therefore, the VDW interaction was not decreased too much (Met: −1.61 kcal/mol, Ile: −1.31 kcal/mol) relatively. Besides, Leu298/Leu346, Phe356/Phe404, Leu476/Leu525, Leu339/Leu387, Ile373/Met421, Met340/Met388, Leu343/Leu391, Met336/Leu384 and Ile376/Ile424 were hydrophobic amino acids with the contribution ranking in top 10 in the decomposition result. Furthermore, the VDW (△Gvdw) of almost top 10 residues were higher than electrostatic contribution (△Gele), indicating the necessity of VDW for the WAY-244 binding.
Case study part 3: influence of WAY-244 migration on protein dynamics of ERβ
Previous studies have shown that the ligand selectivity might be influenced by not only the residues in the pocket but also the residues in the ligand migration tunnel [81–83]. Therefore, Str_mod was used to calculate WAY-244’s migration process. Due to the great similarity of the tunnels between ERβ and ERα, only the detailed result of ERβ was analyzed here. In this case, the calculated data of the top five tunnels selected based on the priority for the unbinding of WAY-244 in ERβ were shown (Figure 2C). The names of tunnels could be checked by moving the mouse on the 3D structures. Among the top five tunnels, the top three ones were similar to the result of previous work (Supplementary Figure 11A and B) [78]. The radius of tunnel No. 2 was the largest (Supplementary Table 4), and the length of this tunnel was also the longest. Despite the similarity of the radius between tunnel No. 3 and tunnel No. 1, the length of tunnel No. 3 was the shortest. Thus, tunnel No. 3 was more suitable for SMD calculation. The distance between the geometric center atom (73: O1) of WAY-244 and Chain A Glu305: CA of ERβ was chosen as reaction coordinate (RC) for SMD, which was changed from 11.3 to 60 Å.
To further elucidate the impacts of WAY-244 migration on protein dynamics of ERβ, Rg, native contacts, the work and PCA analysis were performed on the SMD trajectory. In brief, Rg and native contact analysis were first performed to determine whether the folding status of ERβ was largely influenced by the migration of WAY-244. Rg fluctuated between 17.60 and 17.90 Å (Supplementary Figure 12A). The Q value from native contact analysis was larger than 95% (Supplementary Figure 12B). The calculated result showed that the folding status of the receptor was not largely changed. The work profile was subsequently calculated along the unbinding process of WAY-244 to approximate the free energy profile. It reached maximal value and stabilized at 80 kcal/mol when all the hydrogen bonds were broken (RC = 33 Å, Supplementary Figure 13A and B). Meanwhile, the work profile of (WAY-244)-ERα was compared with (WAY-244)-ERβ. For (WAY-244)-ERα, in the early stages of SMD, the line was very smooth and approximately linearly trending. When the ligand completely dissociated from the protein, the work profile reached the peak at the position of RC = 40.0 Å. Its work (70 kcal/mol, Supplementary Figure 13C and D) was lower than that of (WAY-244)-ERβ, which is consistent with the binding free affinity from the experiment (IC50ERβ = 14 nM, IC50ERα = 1063 nM). Meanwhile, the reliability of the work profile from Str_mod and MM/PB (GB) SA derived from Nor_mod and Int_mod was checked through comparing with the binding affinity data from calculation and experiment. Their accuracy was higher than 75% (85.29 and 73.53% for MM/PBSA and MM/GBSA results from Nor_mod, 76.47 and 82.35% for MM/PBSA and MM/GBSA results from Int_mod, 76.47% for work profile derived from Str_mod, Supplementary Table 1), indicating that the calculated data can be used to predict. However, it is hard to distinguish the ligands with small difference in activity clearly, such as the ligands in calcium-dependent protein kinase, protein kinase B and indoleamine 2,3-dioxygenase 1. Furthermore, to evaluate the allosteric effect of ERβ under WAY-244 migration, essential dynamic (ED) conformations were extracted from the SMD simulation trajectory based on PCA. Compared with the PCA analysis in CMD, the variance of PC1 was increased from 19.1 to 25.1%, suggesting that PC1 from SMD could better represent than that from CMD (Figure 4E). Residue-wise loadings for PC1, PC2 and PC3 were different in MD and SMD, indicating that the WAY-244 migration influenced the vibrations of residues. The comparison on residue loading of PC1 derived from CMD and SMD trajectory indicated that the loadings for residues around position 110 (Gly372 in helix H8) and 210 (Lys482 in helix H11) were improved in the SMD process (Supplementary Figure 6D, E and F). We found that conformation was changed from the first cluster (black) to the second cluster (red) and further recovered to the first cluster (colored from blue to white to red according to MD time, Figure 4E and F). Two typical conformations from two clusters were superimposed and are shown in Figure 4G. A three-helix bundle, helix H7, helix H8 and helix H11, unwinds with ligand dissociation. Besides, the strong anti-correlated residues were found between helix H7, helix H8 and helix H11 in dynamic cross-correlation analysis (Figure 4H and Supplementary Figure 8B).
To reveal the atomic activation mechanism of ERβ and ERα, the intermediate states of the SMD were further analyzed (Supplementary Figure 14 and 15). For ERβ, at first, the steric clash between the residues Ile373 and Ile376 in helix H8 and the acetonitrile group of WAY-244 caused the movement of the H7-H8 loop at RC = 19 Å. It broke the hydrogen bond between the carbonyl group of Glu371 and the Nε atom of His475 in helix H11. Afterwards, a hydrogen bond was formed between the benzofuran hydroxyl of WAY-244 and Glu371 at RC = 21 Å. While the ligand was moving out, the π–π interaction with His475 changes from benzofuran to benzene ring between RC = 21 and 25 Å. The unbinding process of ERα is similar to ERβ. However, Met421 of ERα is different from Ile373 in the corresponding position of ERβ on the tunnel, which may improve the ligand selectivity (Supplementary Figure 15). Furthermore, the reported structure–activity relationship and structure-based analysis showed that Ile373/Met421 of ERβ/ERα is one of the major determinants for subtype selectivity [84, 85]. At the same time, Minutolo et al. described it as a structural ‘inlet’ [86]. In addition, helix H8, helix H11 and H7-H8 loop are likely to play important roles on WAY-244 migration, which is consistent with residue-wise loadings of PCA and correlation result. Therefore, PCA and dynamic residues cross-correlation analysis are convenient tools for visualization of the conformation change.
Case study part 4: the ERβ-selective activation mechanism of WAY-244
Here, computational methods, including NMA, CMD and SMD, were used to investigate the ERβ-selective activation mechanism of WAY-244 based on the LARMD server. As a result, the binding modes of (WAY-244)-ERβ and (WAY-244)-ERα were stabilized by hydrogen bonds with His475/His524, Glu305/Glu353 and Arg346/Arg394 of ERβ/ERα. In addition, two different residues (Met336/Leu384 and Ile373/Met421 of ERβ/ERα) in the pocket could affect the binding affinity and further improve the selectivity of WAY-244, especially Met336 of ERβ (Leu384 of ERα). Among them, the different residue (Ile373/Met421) is on the unbinding tunnels for ERβ and ERα. The helix H8, helix H11 and H7-H8 loop play important roles for WAY-244 escaping, especially residue Glu371/419, Ile373/Met421, Ile376/424 and His475/524 of ERβ/ERα. The H7–H8 loop acts as a ‘transmitter’ to control the ligand unbinding from the binding site. These results are consistent with previous conclusions [78, 87]. Moreover, previous work has revealed that the ligands with two opposing phenolic hydroxyl groups may participate in hydrogen bond networks with Glu305, Arg346 and His475. The differences in the size and flexibility of Met336/Leu384 and Ile373/Met421 in the domain of ERβ/ERα are the major determinants for subtype selectivity [84, 85, 88]. Furthermore, Met336 is the primary determinant of ERβ selectivity for subtype ligands, as shown by site-directed mutagenesis and structural modeling [89]. Meanwhile, the mutations at Gly521, His524, Leu525, Met528 and Cys530 in helix H11 around the unbinding tunnel of ERα have also been revealed to exert the greatest effects on E2-induced transcription [90, 91]. Our calculated result is in good agreement with the experimental results, indicating the validity of LARMD.
Conclusion
In the present study, we developed a computational protocol, LARMD, by the integration of several bioinformatic tools for profiling ligand-driven protein dynamics. Of note, the LARMD web server was developed for nonexpert users with an easy-to-use and interactive interface for visualization, generation and analysis of protein dynamics. In addition, multiple output styles, including tables, heat-map, histogram, dynamic diagram and 3D-structure viewer, are of great help for the clear explanation of the results. In the case study concerning the selective activation of ERβ, we observed that Met336 and Ile373 are the determinant residues for ERβ-selective ligand WAY-244. Helix H8, helix H11 and H7-H8 loop of ERβ also play essential roles for WAY-244 unbinding and contribute to ligand selectivity. Collectively, we believe LARMD is a useful tool for solving the problem of how to study the ligand-driven protein dynamics to reveal molecular interaction mechanism.
Methods
Detection and calculation of tunnel
The tunnels for Str_mod were calculated by CAVER3.0 [25]. The atom in the geometric center of ligand was used to define RC. Another atom of receptor used to define RC and starting and ending RC values was calculated based on the result of the tunnel. The top five tunnels were selected according to the priority calculated through CAVER3.0. The priority was given to wide paths with a reasonable length. In addition, the maximal radius, average radius, average length and average curve of these tunnels were extracted.
MD simulation
The 3D structure may be directly downloaded from a widely used data resource, such as Protein Data Bank (https://www.rcsb.org/, PDB) [92], or obtained from a dock software and web server. The bcc charges were assigned for ligand atoms using the antechamber module of the AMBER16 program [26, 27]. The Tleap module in the AMBER16 program was used to construct the coordinate and topology files of the complex. The AMBER ff14SB force field [93] and gaff force field [94, 95] were used for amino acid residues and ligands, respectively. If ‘water’ is set as ‘explicit’ (the default value for Int_mod and Str_mod is ‘explicit’ and the default value for Nor_mod is ‘implicit’), Na+ or Cl− is added to the system as counter ions. The molecules are solvated in an octahedron box of TIP3P waters [96] extended at least 10 Å in each direction from the solute [97].
The Sander module in the AMBER16 program was further utilized to perform the four-step minimization before the MD simulation [98]. Firstly, all atoms were fixed except for waters, ions and hydrogens. Secondly, only the backbone atoms of the protein were fixed. Thirdly, the residues around the ligand within 6 Å distance (holo) were minimized or the restrictions of backbone atoms (apo) were reduced. Finally, all the atoms were relaxed. In all minimization processes, the 2000 steps steepest descent method and 3000 steps conjugated gradient method were used, followed by application of the Pmemd module in the MD simulation [98]. Firstly, the system was heated from 10 to 300 K in 30 ps. The following release process was similar to the minimization. Finally, all the atoms were relaxed in 300 K and 1 atm by applying periodic boundary conditions. The time (default value ‘1 ns’) for equilibration was set by users. For Str_mod, the minimized and release processes were the same as those of Int_mod. The restraint file for RC was derived from the result of CAVER3.0. The final result was the average value of work profiles from 10 independent trajectories [99, 100].
The analysis of the trajectory
All the snapshots from the trajectory of Int_mod and Str_mod with a time interval of per picosecond by using the Cpptraj module in the AMBER16 program were provided [56]. RMSD, Rg, RMSF, B-factor and Hydrogen Bond were simultaneously analyzed through this module. Furthermore, the distribution of receptor and ligand RMSD were shown with histogram using R package [101]. The number of hydrogen bonds and the information of hydrogen-bonding acceptor and hydrogen-bonding donor between ligand and receptor at each picosecond were calculated using an in-house program. In addition, MDTraj was used to calculate nonnative contact [14], and Bio3d was utilized to analyze PCA and residue cross-correlation [13]. Meanwhile, fluctuation of each residue and atom, deformation energy and network derived from NMA were calculated based on Bio3d for Nor_mod [13].
Free energy calculation
The binding free energy (ΔGbind) was calculated based on binding energy (ΔEbind), solvation entropy (–TΔSsol) and conformational entropy (–TΔSconf) [102] following Eq. 1. The enthalpy and the entropy were calculated by the MM/PB (GB) SA method [62] and empirical method, respectively [103, 104]. ΔGbind = ΔEbind – TΔSsol – TΔSconf
In order to gain a detailed profile of protein–ligand interactions and the contribution of each residue, the binding energy was decomposed per residue by using the decomposition module of the AMBER16 program.
Web server configuration
The LARMD server runs on a Linux Supercomputer Cluster containing the Intel processors with 25 computational nodes. Each node contains 40 CPU cores and four GPU cards. The webpage was constructed by using PHP (version 5.0) supported by Apache HTTP Server (version 2.2.21). To be specific, the information and results of each task are stored in a MySQL database (version 14.12). The nonstandard residue(s) in the complex detected is (are) generated into 2D images by the molconvert tool in ChemAxon6 software (https://chemaxon.com/). In addition, JSmol (http://www.jmol.org/) applet was used to visualize the molecular structure [105], and Chart.js (https://www.chartjs.org/) was used to show interactive histograms on the webpage. MolScript was used to generate dynamic diagrams [28]. Google Chrome, Firefox and IE10 (or later version) are recommended as the optimal view resolution of 1024*900. Torque-6.0.1 and Maui-3.3.1 are used to submit jobs. The autoflow was developed by Python 2.7.
Author Contributions
G.-F.Y. and G.-F.H. conceived of the web server; J.-F.Y. and F.W. developed the tools and implemented the server architecture; G.-F.Y., G.-F.H., Y.-Z.C. and J.-F.Y. wrote the manuscript.
Key Points
The ligand-driven protein dynamics, a big challenge due to the complicated operation steps, plays an important role in in-depth drug design. Herein, we built up a suite of web tools (LARMD) to solve the problem. The selective activation mechanism of ER was studied as a case.
LARMD is an automated web protocol to profile ligand-driven protein dynamics.
Multiple outputs, including result tables, heat-map, histogram, dynamic diagram and 3D-structure viewer, are helpful for clearer exhibition and better understanding.
LARMD is a free and open web server without need of registration.
Met336 and Ile373 are the determinant residues for WAY-244 selective binding in ERβ.
The helix H8, helix H11 and H7-H8 loop contribute to WAY-244 migration in ERβ.
Acknowledgements
We thank Prof. C. Y. Hu from University of Hawaii for the advice during the writing and critical reading of the manuscript.
Funding
This work was supported in part by the National Key R&D Program (2017YFD0200501) and the National Natural Science Foundation of China (No. 21772059, 91853127, and 31960548).
Jing-Fang Yang is a postdoctor at College of Chemistry, Central China Normal University (CCNU); the direction of her thesis is computational molecular simulation.
Fan Wang is a Postdoctoral Fellow at College of Chemistry of CCNU. He received his PhD degree in Computational Chemistry from University of Amiens, France.
Yu-Zong Chen is Professor in Department of Pharmacy, National University of Singapore. He is an academic advisor and faculty curriculum committee of Computational Biology, and he received his PhD degree from University of Manchester.
Ge-Fei Hao is a professor in College of Chemistry at CCNU before. Now, he was employed by Guizhou University as “Cheung Kong Scholar” Young Professor.
Guang-Fu Yang is Professor in Chemical Biology. He is the group leader and received the PhD degree in Pesticide Science from Nankai University, Tianjin, China.
References
Author notes
Co-first authors.
