


Abstract
The methodologies for evaluating similarities between gene expression profiles of different perturbagens are the key to understanding mechanisms of actions (MoAs) of unknown compounds and finding new indications for existing drugs. L1000-based next-generation Connectivity Map (CMap) data is more than a thousand-fold scale-up of the CMap pilot dataset. Although several systematic evaluations have been performed individually to assess the accuracy of the methodologies for the CMap pilot study, the performance of these methodologies needs to be re-evaluated for the L1000 data. Here, using the drug–drug similarities from the Drug Repurposing Hub database as a benchmark standard, we evaluated six popular published methods for the prediction performance of drug–drug relationships based on the partial area under the receiver operating characteristic (ROC) curve at false positive rates of 0.001, 0.005 and 0.01 (AUC0.001, AUC0.005 and AUC0.01). The similarity evaluating algorithm called ZhangScore was generally superior to other methods and exhibited the highest accuracy at the gene signature sizes ranging from 10 to 200. Further, we tested these methods with an experimentally derived gene signature related to estrogen in breast cancer cells, and the results confirmed that ZhangScore was more accurate than other methods. Moreover, based on scoring results of ZhangScore for the gene signature of TOP2A knockdown, in addition to well-known TOP2A inhibitors, we identified a number of potential inhibitors and at least two of them were the subject of previous investigation. Our studies provide potential guidelines for researchers to choose the suitable connectivity method. The six connectivity methods used in this report have been implemented in R package (https://github.com/Jasonlinchina/RCSM).
Introduction
The Library of Integrated Network-Based Cellular Signatures (LINCS) Program has released over 1.3 million transcriptomic profiles using the L1000 technology [1]. The L1000 data is more than a thousand-fold scale-up of the CMap pilot dataset and comprises of more than 20 000 unique perturbagens in multiple human cell lines. This large catalogue of L1000 data provides enormous opportunities for understanding mechanisms of actions (MoAs) of unknown compounds and finding new indications for existing drugs.
The methodologies for evaluating similarities between gene expression signatures of different perturbagens are critically important for applying an existing therapeutic to a new disease indication and discovering potential MoAs of unknown compounds. A nonparametric, ranked-based Kolmogorov–Smirnov (KS) statistic was used for connecting disease gene expression signatures to drug expression profiles in the initial CMap paper [2]. Several CMap methodologies were modified from this initial method [3–5]. Another KS-like method proposed by the Gene Set Enrichment Analysis (GSEA) group [6] was utilized as the core portion of many methods for drug repurposing. Iorio et al. [4] developed an automatic and robust approach to predict similarities in drug effects and MoAs based on this GSEA method. Subramanian et al. [1] also utilized the weighted KS enrichment statistic to compute similarities in their studies. In addition to KS-like methods, a number of alternatives have been proposed by researchers. The methodologies have been extended based on signed-rank statistic (ZhangScore) [7], eXtreme Sum score (XSum) [8] and many other modules [9–18].
Using the CMap pilot dataset, systematic evaluations have been performed to assess the accuracy of these methodologies. Iskar et al. [19] performed quantitative evaluation of CMap methods for identifying compounds that have the same indications. Cheng et al. [20] used the Anatomical Therapeutic Chemical (ATC) classification as the benchmark to compare similarity metrics using two data processing methods and further [21] extended this work by evaluating various CMap similarity metrics across different feature sizes. Cheng et al. [8] also evaluated the CMap performance on predicting drug–disease relationships based on the partial area under the receiver operator characteristic (ROC) curve at false positive rates of 0.1 and 0.01 (FPR = 0.1 and 0.01). The early retrieval performance was measured because it is only practical for researchers to investigate a few of top hypotheses. However, for the large amount of newly generated L1000 data, there is almost no systematic evaluation of the methodologies in place.
The quality of the benchmark set is vital for quantitatively estimating the accuracy of these methods. Previous studies [4, 8, 19, 20] have utilized the ATC classification, which is based on the therapeutic and chemical properties of compounds, as the true positives. In this study, the drug–drug relationships were compiled from a more comprehensive library of clinical compounds that had been curated by the Drug Repurposing Hub database [22]. The compounds in this database were comprehensively annotated based on the FDA Orange Book, prescribing labels, ClinicalTrials.gov, PubMed and other Internet resources. Therefore, the drug–drug relationships based on this database are supposed to be more accurate in terms of MoAs for calculating the AUC values.
Herein, we compiled the benchmark standard of the drug–drug relationships from Drug Repurposing Hub and evaluated six popular published methods for the prediction performance of drug–drug relationships by measuring the AUC0.001, AUC0.005 and AUC0.01 in nine core cell lines of the L1000 project. ZhangScore achieved a higher level of accuracy than other methods at the gene signature sizes ranging from 10 to 200. For such a diversity of chemical perturbations, genetic perturbations and cell types of the L1000 data, our study provides potential guidelines for researchers to choose the suitable connectivity method.
Methods
Data sources and compilation of true drug–drug relationships (benchmark standard)
We downloaded the level 5 data of L1000 (GCTx format) from the Gene Expression Omnibus (accession number: GSE92742), which contains 473 647 replicate-consensus signatures (RCSs) generated by the official data pre-processing pipeline. The level 5 data of L1000 have been normalized, and the LINCS team suggests their direct use without extra processing. Each RCS represents the moderated z-score value of 12 328 genes for one profile. The GCTx file was parsed by an R package [23], and all the names of RCSs related to treatments of small molecules for nine touchstone cell lines (A375, A549, HA1E, HCC515, HEPG2, HT29, MCF7, PC3 and VCAP) were obtained (the touchstone cell lines were defined by Subramanian et al. [1]).
A total of 6113 compounds with annotation information, including compound name, clinical phase, MoAs and protein targets, were downloaded from the Drug Repurposing Hub database (https://clue.io/repurposing, archived version: 5/16/2018). We sorted 4356 compounds that had both information of MoAs and protein targets. After filtering out compounds that did not share MoAs or targets with any of the 4356 remaining compounds, 1919 compounds were reserved for compilation of the benchmark set. Two compounds that share the same MoAs and protein targets are defined as true positive compound pairs. Otherwise, they are defined as true negative compound pairs.
Intersecting the names of replicate-consensus signatures and the 1919 compounds from the Drug Repurposing Hub database, we obtained the positive drugs used to compile the true drug–drug relationships for each cell lines. There were 493 (900 RCSs), 490 (1619 RCSs), 485 (1029 RCSs), 453 (910 RCSs), 341 (544 RCSs), 490 (841 RCSs), 591 (2721 RCSs), 581 (1754 RCSs) and 485 (1350 RCSs) compounds for A375, A549, HA1E, HCC515, HEPG2, HT29, MCF7, PC3 and VCAP cell lines, respectively. The replicate-consensus signatures corresponding to these compounds for each cell line were extracted from the GCTx file.
Pairwise similarity evaluating algorithms
In this study, six methods (GSEAweight0 [6], GSEAweight1 [6], GSEAweight2 [6], KS [2], XSum [8] and ZhangScore [7]) were utilized to measure the similarities between drug pairs. Figure 1 shows the similarities and differences of these methods. The core algorithms of GSEAweight0, GSEAweight1, GSEAweight2 and KS were all derived from the KS-like statistic. The rank-based weights are set to all genes in one gene signature in ZhangScore. The method of XSum was focused on the top genes ranked by fold changes of gene expression. These algorithms are briefly described as follows:
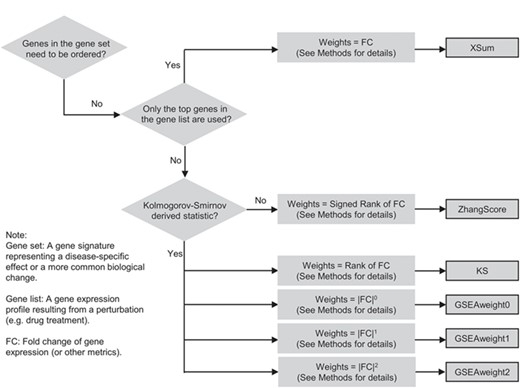
A classification diagram showing the similarities and differences of the six connectivity methods.
GSEAweight0, GSEAweight1 and GSEAweight2: the GSEAPreranked algorithm of the GSEA package [6] contains three scoring schemes for calculating weighted KS enrichment statistic (ES): p = 0, p = 1 and p = 2. Here, we calculated the ES0 (p = 0), ES1 (p = 1) and ES2 (p = 2) for GSEAweight0, GSEAweight1 and GSEAweight2, respectively. We used the GSEAweight0 method as an example to show the calculation process.
Enrichment score (ES):
1. Start with a ranked list of genes (L = {g1, g2, …, gN}) that are in (‘hits’) or not in (‘misses’) a gene set (S), using gene expression fold change (FC) as the metric.
2. Phit (S, i) = |$\sum_{j=1}^i\frac{{\Big|{FC}_{g_j}\Big|}^p}{N_R},{g}_j\in S;$|where NR = |${\sum}_{j=1}^N{\Big|{FC}_{g_j}\Big|}^p,{g}_j\in S;$| i = 1, 2, …, N; p = 0, 1 and 2 for GSEAweight0, GSEAweight1 and GSEAweight2, respectively.
3. Pmiss(S, i) = |$\sum_{j=1}^i\frac{1}{\Big(N-{N}_H\Big)},\Big(\ {g}_j\in L\Big)\cap \Big(\ {g}_j\notin S\Big);$| i = 1, 2, …, N; where N is the number of genes in L, and NH is the number of genes in S.
4. ES = the maximum deviation from zero of Phit − Pmiss.
For drug pair A–B:
UpInDrugA = Top N up-regulated genes from replicate-consensus signature of drug A.
DownInDrugA = Top N down-regulated genes from replicate-consensus signature of drug A.
ES0up = the ES0 score between UpInDrugA and complete replicate-consensus signature of drug B.
ES0down = the ES0 score between DownInDrugA and complete replicate-consensus signature of drug B.
GSEAweight0(A-B) = ES0up − ES0down if ES0up and ES0down have different algebraic sign; otherwise, GSEAweight0(A-B) = 0.
For drug pair B–A, the GSEAweight0(B-A) could be calculated the same way.
The final similarity score for drug A and drug B: GSEAweight0(A&B) = (GSEAweight0(A-B) + GSEAweight0(B-A))/2.
ZhangScore: this was part of the method proposed by Zhang et al. [7]. We only considered the condition when gene signatures were unordered.
For drug pair A–B:
UpInDrugA and DownInDrugA are defined as above.
R = complete replicate-consensus signature of drug B.
s = UpInDrugA∪DownInDrugA.
ZhangScore(A-B) = |$\sum_{i=1}^mR\Big({g}_i\Big)s\Big({g}_i\Big)/\sum_{i=1}^m\Big(M-i+1\Big)$|, where gi represents the ith gene in R, s (gi) is 1 for up-regulated genes or −1 for down-regulated genes and R (gi) is this gene’s signed rank in R. m is the length of s, and M is the length of R.
For drug pair B–A, the ZhangScore(B-A) could be calculated the same way.
The final similarity score for drug A and drug B: ZhangScore(A&B) = (ZhangScore(A-B) + ZhangScore(B-A))/2.
KS: KS(A-B) and KS(B-A) are calculated as described by Cheng et al. [8].
Kolmogorov–Smirnov (KS) statistic:
1. Start with ranked list of genes (L = {g1, g2, …, gN}) and a gene set (S) with t genes.
- 2. Construct a vector V of the position (1, 2, …, N) of each gene based on L and sort the genes in S in ascending order such that V(j) is the position of gene j, where j = 1, 2, …, t. Compute the following two values:$$ a={\max}_{j=1}^t\left[\frac{j}{t}-\frac{V(\,j)}{N}\right] $$$$ b={\max}_{j=1}^t\left[\frac{V(\,j)}{N}-\frac{\left(\,j-1\right)}{t}\right] $$
3.
$$KS = \Big\{\begin{array}{@{}c}a,\mathrm{if}\ a>b,\\ {}-b,\mathrm{if}\ b>a.\end{array}\Big.$$
For drug pair A–B:
UpInDrugA and DownInDrugA are defined as above.
KSup = the KS score between UpInDrugA and complete replicate-consensus signature of drug B.
KSdown = the KS score between DownInDrugA and complete replicate-consensus signature of drug B.
KS(A-B) = KSup − KSdown if KSup and KSdown have different algebraic signs; otherwise, KS(A-B) = 0.
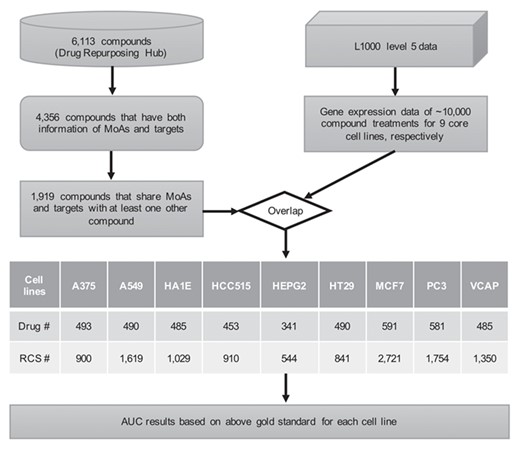
Workflow of connectivity method evaluation for L1000 data. MoAs: mechanisms of actions. RCS: replicate-consensus signature. AUC: area under the curve.
For drug pair B–A:
The KS(B-A) could be calculated the same way.
The final similarity score for drug A and drug B: KS(A&B) = (KS(A-B) + KS(B-A))/2.
XSum: XSum(A-B) and XSum(B-A) are also calculated as described by Cheng et al. [8].
For drug pair A–B:
UpInDrugA and DownInDrugA are defined as above.
ChangedByDrugB = Top N up-regulated and N down-regulated genes from replicate-consensus signature of drug B.
XUpInDrugA = UpInDrugA ∩ ChangedByDrugB.
XDownInDrugA = DownInDrugA ∩ ChangedByDrugB.
sum (XUpInDrugA) = sum of drug B gene expression fold change values in the set of XUpInDrugA.
sum (XDownInDrugA) = sum of drug B gene expression fold change values in the set of XDownInDrugA.
XSum(A-B) = sum (XUpInDrugA) − sum (XDownInDrugA).
Statistical results of AUC0.01 (partial ROC curve at the FPR = 0.01). The highest AUC0.01 values for each cell line at each gene signature size are in bold. n: the number of genes in the gene signature. ROC curve: receiver operating characteristic curve. FPR: false positive rate
| Scoring method | n | Cell line | ||||||||
|---|---|---|---|---|---|---|---|---|---|---|
| A375 | HA1E | HT29 | VCAP | HEPG2 | MCF7 | A549 | HCC515 | PC3 | ||
| GSEAweight0 | ||||||||||
| 10 | 4.46E-04 | 3.63E-04 | 4.34E-04 | 2.56E-04 | 3.84E-04 | 4.23E-04 | 7.80E-04 | 8.15E-04 | 4.78E-04 | |
| 40 | 4.50E-04 | 4.33E-04 | 4.32E-04 | 3.61E-04 | 5.01E-04 | 4.58E-04 | 9.05E-04 | 7.29E-04 | 5.19E-04 | |
| 100 | 4.48E-04 | 4.36E-04 | 4.45E-04 | 3.82E-04 | 5.10E-04 | 4.28E-04 | 8.80E-04 | 6.45E-04 | 5.15E-04 | |
| 200 | 4.23E-04 | 3.98E-04 | 4.14E-04 | 3.41E-04 | 4.25E-04 | 4.04E-04 | 7.41E-04 | 5.29E-04 | 4.89E-04 | |
| 500 | 3.56E-04 | 3.45E-04 | 3.86E-04 | 3.18E-04 | 3.62E-04 | 3.55E-04 | 5.90E-04 | 4.02E-04 | 4.40E-04 | |
| 1000 | 3.35E-04 | 3.16E-04 | 3.54E-04 | 2.83E-04 | 3.12E-04 | 3.05E-04 | 4.32E-04 | 3.34E-04 | 3.57E-04 | |
| GSEAweight1 | ||||||||||
| 10 | 4.44E-04 | 3.87E-04 | 4.30E-04 | 2.26E-04 | 3.64E-04 | 3.85E-04 | 7.47E-04 | 9.89E-04 | 4.95E-04 | |
| 40 | 4.46E-04 | 4.91E-04 | 4.67E-04 | 3.23E-04 | 4.53E-04 | 4.21E-04 | 9.39E-04 | 9.36E-04 | 4.80E-04 | |
| 100 | 4.61E-04 | 4.62E-04 | 4.65E-04 | 3.85E-04 | 5.59E-04 | 4.42E-04 | 9.73E-04 | 8.84E-04 | 5.15E-04 | |
| 200 | 4.45E-04 | 4.46E-04 | 4.62E-04 | 4.01E-04 | 5.13E-04 | 4.30E-04 | 9.11E-04 | 8.15E-04 | 5.18E-04 | |
| 500 | 4.25E-04 | 4.22E-04 | 4.20E-04 | 3.57E-04 | 4.59E-04 | 4.18E-04 | 7.74E-04 | 6.36E-04 | 4.96E-04 | |
| 1000 | 3.79E-04 | 3.92E-04 | 3.93E-04 | 3.20E-04 | 4.11E-04 | 3.81E-04 | 6.47E-04 | 4.73E-04 | 4.56E-04 | |
| GSEAweight2 | ||||||||||
| 10 | 3.10E-04 | 3.38E-04 | 3.59E-04 | 1.82E-04 | 2.06E-04 | 2.60E-04 | 5.98E-04 | 8.24E-04 | 3.77E-04 | |
| 40 | 4.19E-04 | 4.63E-04 | 4.00E-04 | 2.57E-04 | 3.01E-04 | 2.69E-04 | 7.79E-04 | 9.81E-04 | 2.97E-04 | |
| 100 | 4.37E-04 | 4.82E-04 | 4.15E-04 | 3.04E-04 | 4.38E-04 | 3.50E-04 | 9.39E-04 | 9.84E-04 | 3.61E-04 | |
| 200 | 4.40E-04 | 4.76E-04 | 4.54E-04 | 3.54E-04 | 4.67E-04 | 4.18E-04 | 9.67E-04 | 9.97E-04 | 4.40E-04 | |
| 500 | 4.57E-04 | 4.59E-04 | 4.64E-04 | 4.18E-04 | 5.01E-04 | 4.48E-04 | 9.63E-04 | 9.20E-04 | 5.14E-04 | |
| 1000 | 4.35E-04 | 4.44E-04 | 4.37E-04 | 3.59E-04 | 4.64E-04 | 4.26E-04 | 8.70E-04 | 7.70E-04 | 5.07E-04 | |
| KS | ||||||||||
| 10 | 4.46E-04 | 3.63E-04 | 4.34E-04 | 2.57E-04 | 3.84E-04 | 4.23E-04 | 7.80E-04 | 8.15E-04 | 4.78E-04 | |
| 40 | 4.51E-04 | 4.34E-04 | 4.33E-04 | 3.61E-04 | 4.98E-04 | 4.58E-04 | 9.06E-04 | 7.30E-04 | 5.18E-04 | |
| 100 | 4.50E-04 | 4.36E-04 | 4.45E-04 | 3.83E-04 | 5.11E-04 | 4.28E-04 | 8.81E-04 | 6.44E-04 | 5.14E-04 | |
| 200 | 4.23E-04 | 3.98E-04 | 4.14E-04 | 3.40E-04 | 4.26E-04 | 4.05E-04 | 7.40E-04 | 5.29E-04 | 4.89E-04 | |
| 500 | 3.57E-04 | 3.47E-04 | 3.86E-04 | 3.19E-04 | 3.65E-04 | 3.55E-04 | 5.90E-04 | 4.02E-04 | 4.40E-04 | |
| 1000 | 3.34E-04 | 3.16E-04 | 3.54E-04 | 2.83E-04 | 3.11E-04 | 3.06E-04 | 4.31E-04 | 3.32E-04 | 3.55E-04 | |
| XSum | ||||||||||
| 10 | 3.88E-04 | 2.84E-04 | 3.70E-04 | 2.41E-04 | 3.06E-04 | 2.62E-04 | 7.65E-04 | 8.75E-04 | 4.10E-04 | |
| 40 | 4.60E-04 | 3.44E-04 | 4.01E-04 | 2.77E-04 | 3.71E-04 | 3.88E-04 | 8.32E-04 | 8.55E-04 | 3.98E-04 | |
| 100 | 4.73E-04 | 3.58E-04 | 3.20E-04 | 2.81E-04 | 3.83E-04 | 3.73E-04 | 7.97E-04 | 5.60E-04 | 4.33E-04 | |
| 200 | 4.27E-04 | 3.35E-04 | 2.96E-04 | 2.69E-04 | 3.69E-04 | 3.68E-04 | 7.22E-04 | 3.72E-04 | 4.20E-04 | |
| 500 | 4.02E-04 | 3.22E-04 | 3.13E-04 | 2.41E-04 | 3.71E-04 | 3.52E-04 | 6.24E-04 | 3.38E-04 | 4.05E-04 | |
| 1000 | 3.78E-04 | 3.06E-04 | 2.99E-04 | 2.29E-04 | 3.44E-04 | 3.43E-04 | 5.22E-04 | 3.08E-04 | 3.39E-04 | |
| ZhangScore | ||||||||||
| 10 | 4.21E-04 | 4.06E-04 | 4.53E-04 | 2.90E-04 | 4.36E-04 | 3.45E-04 | 6.98E-04 | 7.92E-04 | 4.41E-04 | |
| 40 | 4.94E-04 | 4.29E-04 | 4.48E-04 | 3.67E-04 | 4.55E-04 | 4.38E-04 | 7.56E-04 | 8.09E-04 | 5.29E-04 | |
| 100 | 5.38E-04 | 4.61E-04 | 4.73E-04 | 3.80E-04 | 5.50E-04 | 4.55E-04 | 8.91E-04 | 9.74E-04 | 5.13E-04 | |
| 200 | 5.72E-04 | 5.33E-04 | 5.37E-04 | 4.61E-04 | 5.18E-04 | 4.54E-04 | 8.93E-04 | 9.66E-04 | 5.25E-04 | |
| 500 | 4.16E-04 | 4.06E-04 | 4.14E-04 | 3.53E-04 | 4.12E-04 | 3.88E-04 | 6.75E-04 | 5.97E-04 | 4.91E-04 | |
| 1000 | 3.54E-04 | 3.28E-04 | 3.76E-04 | 3.12E-04 | 3.26E-04 | 3.25E-04 | 5.08E-04 | 3.97E-04 | 3.97E-04 |
Statistical results of AUC0.005 (partial ROC curve at the FPR = 0.005). The highest AUC0.005 values for each cell line at each gene signature size are in bold. n: the number of genes in the gene signature. ROC curve: receiver operating characteristic curve. FPR: false positive rate
| Scoring method | n | Cell line | ||||||||
|---|---|---|---|---|---|---|---|---|---|---|
| A375 | HA1E | HT29 | VCAP | HEPG2 | MCF7 | A549 | HCC515 | PC3 | ||
| GSEAweight0 | ||||||||||
| 10 | 1.66E-04 | 1.48E-04 | 1.74E-04 | 8.50E-05 | 1.60E-04 | 1.72E-04 | 2.83E-04 | 2.73E-04 | 2.08E-04 | |
| 40 | 1.76E-04 | 1.71E-04 | 1.71E-04 | 1.20E-04 | 1.95E-04 | 1.75E-04 | 3.39E-04 | 2.27E-04 | 2.13E-04 | |
| 100 | 1.80E-04 | 1.65E-04 | 1.76E-04 | 1.33E-04 | 1.99E-04 | 1.73E-04 | 3.36E-04 | 2.03E-04 | 2.08E-04 | |
| 200 | 1.63E-04 | 1.59E-04 | 1.69E-04 | 1.25E-04 | 1.62E-04 | 1.62E-04 | 2.84E-04 | 1.74E-04 | 2.01E-04 | |
| 500 | 1.42E-04 | 1.40E-04 | 1.58E-04 | 1.20E-04 | 1.39E-04 | 1.37E-04 | 2.13E-04 | 1.39E-04 | 1.67E-04 | |
| 1000 | 1.32E-04 | 1.31E-04 | 1.40E-04 | 1.02E-04 | 1.17E-04 | 1.15E-04 | 1.44E-04 | 1.10E-04 | 1.28E-04 | |
| GSEAweight1 | ||||||||||
| 10 | 1.59E-04 | 1.57E-04 | 1.71E-04 | 6.70E-05 | 1.30E-04 | 1.49E-04 | 2.79E-04 | 3.92E-04 | 1.94E-04 | |
| 40 | 1.55E-04 | 1.80E-04 | 1.78E-04 | 9.60E-05 | 1.67E-04 | 1.51E-04 | 3.73E-04 | 3.45E-04 | 1.86E-04 | |
| 100 | 1.64E-04 | 1.69E-04 | 1.76E-04 | 1.20E-04 | 2.05E-04 | 1.72E-04 | 3.85E-04 | 3.00E-04 | 2.03E-04 | |
| 200 | 1.70E-04 | 1.65E-04 | 1.76E-04 | 1.33E-04 | 1.93E-04 | 1.71E-04 | 3.59E-04 | 2.63E-04 | 2.12E-04 | |
| 500 | 1.68E-04 | 1.62E-04 | 1.73E-04 | 1.23E-04 | 1.79E-04 | 1.66E-04 | 3.01E-04 | 1.99E-04 | 2.08E-04 | |
| 1000 | 1.48E-04 | 1.51E-04 | 1.64E-04 | 1.22E-04 | 1.59E-04 | 1.48E-04 | 2.55E-04 | 1.65E-04 | 1.85E-04 | |
| GSEAweight2 | ||||||||||
| 10 | 1.18E-04 | 1.28E-04 | 1.35E-04 | 6.00E-05 | 6.30E-05 | 8.80E-05 | 2.23E-04 | 3.16E-04 | 1.20E-04 | |
| 40 | 1.49E-04 | 1.87E-04 | 1.52E-04 | 7.80E-05 | 1.03E-04 | 8.00E-05 | 2.99E-04 | 3.88E-04 | 8.40E-05 | |
| 100 | 1.50E-04 | 1.79E-04 | 1.52E-04 | 9.10E-05 | 1.66E-04 | 1.30E-04 | 3.69E-04 | 3.77E-04 | 1.14E-04 | |
| 200 | 1.51E-04 | 1.70E-04 | 1.68E-04 | 1.04E-04 | 1.75E-04 | 1.54E-04 | 3.84E-04 | 3.71E-04 | 1.69E-04 | |
| 500 | 1.74E-04 | 1.67E-04 | 1.86E-04 | 1.25E-04 | 1.88E-04 | 1.74E-04 | 3.72E-04 | 3.35E-04 | 2.13E-04 | |
| 1000 | 1.74E-04 | 1.65E-04 | 1.79E-04 | 1.27E-04 | 1.86E-04 | 1.70E-04 | 3.39E-04 | 2.60E-04 | 2.14E-04 | |
| KS | ||||||||||
| 10 | 1.65E-04 | 1.48E-04 | 1.74E-04 | 8.50E-05 | 1.60E-04 | 1.72E-04 | 2.83E-04 | 2.74E-04 | 2.08E-04 | |
| 40 | 1.76E-04 | 1.71E-04 | 1.71E-04 | 1.20E-04 | 1.93E-04 | 1.76E-04 | 3.39E-04 | 2.29E-04 | 2.13E-04 | |
| 100 | 1.80E-04 | 1.65E-04 | 1.76E-04 | 1.33E-04 | 1.99E-04 | 1.73E-04 | 3.36E-04 | 2.02E-04 | 2.08E-04 | |
| 200 | 1.63E-04 | 1.60E-04 | 1.69E-04 | 1.24E-04 | 1.63E-04 | 1.62E-04 | 2.84E-04 | 1.73E-04 | 2.01E-04 | |
| 500 | 1.42E-04 | 1.40E-04 | 1.59E-04 | 1.19E-04 | 1.40E-04 | 1.37E-04 | 2.13E-04 | 1.39E-04 | 1.67E-04 | |
| 1000 | 1.32E-04 | 1.30E-04 | 1.40E-04 | 1.03E-04 | 1.17E-04 | 1.15E-04 | 1.45E-04 | 1.10E-04 | 1.27E-04 | |
| XSum | ||||||||||
| 10 | 1.51E-04 | 1.18E-04 | 1.41E-04 | 8.60E-05 | 1.09E-04 | 9.80E-05 | 2.90E-04 | 3.71E-04 | 1.64E-04 | |
| 40 | 1.78E-04 | 1.42E-04 | 1.58E-04 | 9.40E-05 | 1.42E-04 | 1.46E-04 | 3.16E-04 | 3.05E-04 | 1.63E-04 | |
| 100 | 1.76E-04 | 1.46E-04 | 1.32E-04 | 9.70E-05 | 1.52E-04 | 1.46E-04 | 2.76E-04 | 1.60E-04 | 1.54E-04 | |
| 200 | 1.53E-04 | 1.37E-04 | 1.20E-04 | 9.90E-05 | 1.45E-04 | 1.32E-04 | 2.41E-04 | 1.04E-04 | 1.47E-04 | |
| 500 | 1.40E-04 | 1.33E-04 | 1.24E-04 | 9.90E-05 | 1.40E-04 | 1.31E-04 | 1.98E-04 | 1.01E-04 | 1.38E-04 | |
| 1000 | 1.30E-04 | 1.31E-04 | 1.16E-04 | 9.80E-05 | 1.31E-04 | 1.30E-04 | 1.66E-04 | 9.30E-05 | 1.10E-04 | |
| ZhangScore | ||||||||||
| 10 | 1.58E-04 | 1.59E-04 | 1.88E-04 | 1.04E-04 | 1.76E-04 | 1.38E-04 | 2.64E-04 | 2.87E-04 | 1.86E-04 | |
| 40 | 1.94E-04 | 1.72E-04 | 1.91E-04 | 1.25E-04 | 1.72E-04 | 1.74E-04 | 2.57E-04 | 2.87E-04 | 2.22E-04 | |
| 100 | 2.11E-04 | 1.85E-04 | 1.86E-04 | 1.30E-04 | 2.09E-04 | 1.80E-04 | 3.28E-04 | 3.50E-04 | 2.24E-04 | |
| 200 | 2.13E-04 | 2.11E-04 | 2.18E-04 | 1.65E-04 | 1.97E-04 | 1.78E-04 | 3.36E-04 | 3.52E-04 | 2.19E-04 | |
| 500 | 1.67E-04 | 1.57E-04 | 1.72E-04 | 1.29E-04 | 1.64E-04 | 1.57E-04 | 2.67E-04 | 1.95E-04 | 2.07E-04 | |
| 1000 | 1.39E-04 | 1.34E-04 | 1.59E-04 | 1.17E-04 | 1.30E-04 | 1.26E-04 | 1.72E-04 | 1.39E-04 | 1.50E-04 | |
Statistical results of AUC0.001 (partial ROC curve at the FPR = 0.001). The highest AUC0.001 values for each cell line at each gene signature size are in bold. n: the number of genes in the gene signature. ROC curve: receiver operating characteristic curve. FPR: false positive rate
| Scoring method | n | Cell line | ||||||||
|---|---|---|---|---|---|---|---|---|---|---|
| A375 | HA1E | HT29 | VCAP | HEPG2 | MCF7 | A549 | HCC515 | PC3 | ||
| GSEAweight0 | ||||||||||
| 10 | 1.59E-05 | 1.84E-05 | 1.88E-05 | 8.50E-06 | 1.95E-05 | 1.94E-05 | 1.80E-05 | 1.44E-05 | 2.61E-05 | |
| 40 | 2.15E-05 | 1.93E-05 | 2.10E-05 | 7.50E-06 | 2.21E-05 | 1.96E-05 | 1.94E-05 | 9.80E-06 | 2.63E-05 | |
| 100 | 2.12E-05 | 2.06E-05 | 2.18E-05 | 8.49E-06 | 2.13E-05 | 1.94E-05 | 2.38E-05 | 1.11E-05 | 2.30E-05 | |
| 200 | 2.05E-05 | 2.06E-05 | 2.19E-05 | 8.53E-06 | 1.91E-05 | 1.90E-05 | 2.39E-05 | 9.67E-06 | 2.13E-05 | |
| 500 | 1.79E-05 | 2.09E-05 | 2.00E-05 | 1.02E-05 | 1.77E-05 | 1.79E-05 | 1.97E-05 | 8.20E-06 | 1.65E-05 | |
| 1000 | 1.49E-05 | 1.97E-05 | 1.79E-05 | 1.09E-05 | 1.41E-05 | 1.63E-05 | 1.54E-05 | 6.16E-06 | 1.35E-05 | |
| GSEAweight1 | ||||||||||
| 10 | 1.70E-05 | 1.89E-05 | 1.77E-05 | 7.41E-06 | 1.15E-05 | 1.65E-05 | 2.00E-05 | 2.69E-05 | 2.27E-05 | |
| 40 | 2.02E-05 | 1.89E-05 | 1.77E-05 | 6.59E-06 | 1.79E-05 | 1.74E-05 | 2.51E-05 | 2.02E-05 | 2.45E-05 | |
| 100 | 1.97E-05 | 1.96E-05 | 1.96E-05 | 7.00E-06 | 2.06E-05 | 1.97E-05 | 2.45E-05 | 1.46E-05 | 2.39E-05 | |
| 200 | 1.95E-05 | 2.05E-05 | 2.14E-05 | 7.44E-06 | 2.09E-05 | 1.86E-05 | 2.61E-05 | 1.20E-05 | 2.51E-05 | |
| 500 | 1.95E-05 | 2.12E-05 | 2.19E-05 | 8.71E-06 | 2.01E-05 | 1.91E-05 | 2.42E-05 | 1.08E-05 | 2.17E-05 | |
| 1000 | 1.88E-05 | 2.14E-05 | 2.08E-05 | 9.85E-06 | 1.95E-05 | 1.90E-05 | 2.21E-05 | 9.77E-06 | 1.78E-05 | |
| GSEAweight2 | ||||||||||
| 10 | 1.56E-05 | 1.43E-05 | 1.33E-05 | 5.16E-06 | 7.60E-06 | 7.16E-06 | 1.86E-05 | 2.45E-05 | 9.84E-06 | |
| 40 | 1.93E-05 | 1.98E-05 | 1.51E-05 | 5.75E-06 | 1.22E-05 | 5.82E-06 | 2.75E-05 | 3.00E-05 | 6.33E-06 | |
| 100 | 1.89E-05 | 1.92E-05 | 1.68E-05 | 6.95E-06 | 1.75E-05 | 1.37E-05 | 2.62E-05 | 2.34E-05 | 9.40E-06 | |
| 200 | 1.73E-05 | 1.90E-05 | 1.78E-05 | 6.44E-06 | 1.88E-05 | 1.60E-05 | 2.47E-05 | 1.72E-05 | 1.96E-05 | |
| 500 | 2.01E-05 | 2.04E-05 | 2.24E-05 | 7.90E-06 | 2.09E-05 | 1.85E-05 | 2.46E-05 | 1.48E-05 | 2.67E-05 | |
| 1000 | 2.04E-05 | 2.17E-05 | 2.24E-05 | 8.62E-06 | 2.10E-05 | 1.95E-05 | 2.55E-05 | 1.28E-05 | 2.45E-05 | |
| KS | ||||||||||
| 10 | 1.59E-05 | 1.85E-05 | 1.88E-05 | 8.54E-06 | 1.95E-05 | 1.94E-05 | 1.80E-05 | 1.44E-05 | 2.61E-05 | |
| 40 | 2.15E-05 | 1.94E-05 | 2.11E-05 | 7.56E-06 | 2.20E-05 | 1.96E-05 | 1.96E-05 | 9.81E-06 | 2.61E-05 | |
| 100 | 2.12E-05 | 2.07E-05 | 2.17E-05 | 8.48E-06 | 2.13E-05 | 1.95E-05 | 2.40E-05 | 1.11E-05 | 2.28E-05 | |
| 200 | 2.05E-05 | 2.06E-05 | 2.19E-05 | 8.49E-06 | 1.90E-05 | 1.90E-05 | 2.39E-05 | 9.77E-06 | 2.13E-05 | |
| 500 | 1.78E-05 | 2.09E-05 | 1.99E-05 | 1.02E-05 | 1.76E-05 | 1.79E-05 | 1.99E-05 | 8.19E-06 | 1.66E-05 | |
| 1000 | 1.48E-05 | 1.97E-05 | 1.78E-05 | 1.10E-05 | 1.40E-05 | 1.64E-05 | 1.54E-05 | 6.15E-06 | 1.35E-05 | |
| XSum | ||||||||||
| 10 | 1.58E-05 | 1.68E-05 | 1.47E-05 | 6.41E-06 | 1.37E-05 | 1.15E-05 | 2.60E-05 | 3.62E-05 | 2.20E-05 | |
| 40 | 1.98E-05 | 2.15E-05 | 1.68E-05 | 7.91E-06 | 2.17E-05 | 1.70E-05 | 2.50E-05 | 1.57E-05 | 2.16E-05 | |
| 100 | 1.77E-05 | 1.97E-05 | 1.47E-05 | 8.59E-06 | 2.05E-05 | 1.69E-05 | 1.80E-05 | 9.50E-06 | 1.28E-05 | |
| 200 | 1.48E-05 | 1.79E-05 | 1.18E-05 | 8.85E-06 | 1.97E-05 | 1.50E-05 | 1.54E-05 | 6.92E-06 | 1.03E-05 | |
| 500 | 1.40E-05 | 1.67E-05 | 1.29E-05 | 9.58E-06 | 1.85E-05 | 1.48E-05 | 1.36E-05 | 5.70E-06 | 1.01E-05 | |
| 1000 | 1.30E-05 | 1.75E-05 | 1.24E-05 | 1.07E-05 | 1.74E-05 | 1.53E-05 | 1.31E-05 | 4.91E-06 | 8.87E-06 | |
| ZhangScore | ||||||||||
| 10 | 1.87E-05 | 1.68E-05 | 2.17E-05 | 6.15E-06 | 1.56E-05 | 1.32E-05 | 1.87E-05 | 2.27E-05 | 2.08E-05 | |
| 40 | 2.59E-05 | 2.17E-05 | 2.59E-05 | 9.70E-06 | 2.51E-05 | 2.14E-05 | 1.62E-05 | 1.65E-05 | 2.99E-05 | |
| 100 | 2.39E-05 | 2.08E-05 | 1.90E-05 | 8.01E-06 | 1.96E-05 | 1.66E-05 | 1.62E-05 | 1.69E-05 | 2.81E-05 | |
| 200 | 2.36E-05 | 2.34E-05 | 2.03E-05 | 9.36E-06 | 2.36E-05 | 1.77E-05 | 2.22E-05 | 1.78E-05 | 2.77E-05 | |
| 500 | 2.18E-05 | 2.21E-05 | 2.13E-05 | 8.82E-06 | 2.09E-05 | 1.93E-05 | 2.32E-05 | 1.49E-05 | 2.52E-05 | |
| 1000 | 1.78E-05 | 2.09E-05 | 1.94E-05 | 8.18E-06 | 1.68E-05 | 1.72E-05 | 1.62E-05 | 8.80E-06 | 1.68E-05 | |

Comparison of six connectivity methods in nine cell lines. Compounds that have the same MoAs and targets are counted as true positives. AUC0.01 (partial ROC curve at the FPR = 0.01) values were measured for six methods at the gene signature size of 200 in A375, HA1E, HT29, VCAP, HEPG2, MCF7, A549, HCC515 and PC3 cell line, respectively.
For drug pair B-A:
The XSum(B-A) could be calculated the same way.
The final similarity score for drug A and drug B: XSum(A&B) = (XSum(A-B) + XSum(B-A))/2.
For this study, N was set to 5, 20, 50, 100, 250 and 500 in all metrics, so the actual gene signature sizes were 10, 40, 100, 200, 500 and 1000, respectively.
AUC and P values
We utilized the partial area under the ROC curve at false positive rates of 0.001, 0.005 and 0.01 (AUC0.001, AUC0.005 and AUC0.01) to evaluate the performance of these six methods. Different treatment conditions of the same compound were treated as individual profiles when calculating the AUC0.001, AUC0.005 and AUC0.01.
For comparing the partial ROC curves (FPR ranges from 0 to 0.001/0.005/0.01) of different methods, P values were generated by the R package pROC [24]. To determine the statistical significance of the AUC0.001, AUC0.005 and AUC0.01 results for each method, 10 000 runs with random permutations of the true drug–drug relationships were performed to generate non-parametric P values.
Implementation of R package RCSM
The R package RCSM offers functions for measuring the connectivity based on the six methods (GSEAweight0, GSEAweight1, GSEAweight2, KS, XSum and ZhangScore) and return scores, P values and adjusted P values of the specific connectivity method. Parallelization is also available in the package if your computer has multiple cores. This package can be easy installed from the github (https://github.com/Jasonlinchina/RCSM). This user-friendly package allows both computational and experimental researchers to quickly and effectively explore the connectivities between their interested gene signatures and different perturbagens.
Results
Comparison of connectivity methods
To compare the early retrieval performance of the six connectivity methods, we measured the AUC at false positive rates of 0.001, 0.005 and 0.01 (AUC0.001, AUC0.005 and AUC0.01). The benchmark set for constructing the ROC curve was compiled from the Drug Repurposing Hub database, and the work flow of the performance evaluation can be seen in Figure 2. The actual similarity scores (from ZhangScore) of true positive drug pairs are significantly higher than those of the true negative drug pairs, indicating the effectiveness of this benchmark set (Supplementary Figure 1). The AUC0.001, AUC0.005 and AUC0.01 results of six different connectivity methods were measured in each of the nine cell lines. For each method, six sizes (n = 10, 40, 100, 200, 500, 1000 genes) of gene signature were considered to construct the ROC curves. The AUC0.01 values from ZhangScore were the highest in four, three, three and seven of the nine cell lines at the gene signature size of 10, 40, 100 and 200, respectively. Among 36 events (four gene signature sizes ranging from 10 to 200 in nine cell lines), ZhangScore had the highest AUC0.01 values in 17 events (GSEAweight0 in 6 events, GSEAweight1 in 9 events, GSEAweight2 in 5 events, KS in 4 events, and XSum in none), which was the best in all of these six methods (Table 1). Similarly, ZhangScore had the highest AUC0.005 values in 21 events (GSEAweight0 in 5 events, GSEAweight1 in 3 events, GSEAweight2 in 5 events, KS in 4 events, and XSum in 1 event) (Table 2) and the highest AUC0.001 values in 18 events (GSEAweight0 in 8 events, GSEAweight1 in 3 events, GSEAweight2 in 4 events, KS in 6 events and XSum in 3 events) (Table 3). These results indicated that ZhangScore was superior to other methods at the gene signature sizes ranging from 10 to 200. At the gene signature sizes of 500 and 1000, GSEAweight2 outperformed other methods.
Considering that gene signatures with more than 500 genes are uncommon in actual studies, we chose the gene signature with the length of 200 to further compare different methods. The AUC0.01 values from ZhangScore were 5.72e-4 (P < 0.0001), 5.33e-4 (P < 0.0001), 5.37e-4 (P < 0.0001), 4.61e-4 (P < 0.0001), 5.18e-4 (P < 0.0001), 4.54e-4 (P < 0.0001), 8.93e-4 (P < 0.0001), 9.66e-4 (P < 0.0001) and 5.25e-4 (P < 0.0001) in A375, HA1E, HT29, VCAP, HEPG2, MCF7, A549, HCC515 and PC3 cell lines, respectively. When measuring the fold enrichment at the 0.01 false positive rate level, the fold enrichment scores from ZhangScore are 7.96, 7.61, 6.72, 6.77, 7.67, 5.83, 12.1, 13.0 and 6.53 in the above cell lines, respectively. The AUC0.01 and fold enrichment values of ZhangScore were significantly higher than other methods in A375, HA1E, HT29 and VCAP cell lines. In the HCC515 cell line, ZhangScore had a competitive performance with GSEAweight2 and performed better than the four other methods. In HEPG2, MCF7 and A549 cell lines, ZhangScore had a competitive performance with GSEAweight1 and GSEAweight2 and performed better than the three other methods. (Figure 3, Table 4).
Testing with the estrogen gene signature
The estrogen gene signature was first reported by the initial cMAP study [2]. This gene signature consists of 189 Affymetrix probe-set IDs. We obtained 40 up- and 89 down-regulated genes after annotating these Affymetrix probe-set IDs to the Entrez gene IDs used by L1000. Using the R package RSCM our lab developed, we scored the touchstone compounds according to this gene signature in the breast cancer cell line MCF7. The positively correlated and negatively correlated compounds with the estrogen gene signature were counted for each method based on a unified standard (adjusted P value <0.05). The results showed that the ZhangScore could detect more known estrogen receptor agonists (Figure 4a) and more known estrogen receptor antagonists (Figure 4b) than other methods. This suggested that ZhangScore achieved a higher level of accuracy for the estrogen gene signature than other methods.
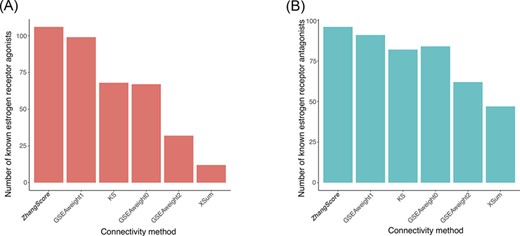
Results for the estrogen gene signature. The known (A) estrogen receptor agonists and (B) estrogen receptor antagonists based on the estrogen gene signature identified by six methods in the MCF7 cell line.
Testing with the gene signature of TOP2A knockdown
The LINCS program has generated over 20 000 gene expression profiles from mRNA knockdown experiments. These large-scale profiles of genetic perturbagens have complemented the CMap pilot dataset. To test ZhangScore for the newly generated gene knockdown data from the L1000 project, we focused on TOP2A (DNA Topoisomerase II Alpha) gene that is associated with the prognosis of multiple cancer types [25, 26]. The gene signature of TOP2A knockdown was derived from the level 5 data of L1000. This signature contains the top 100 up-regulated and top 100 down-regulated genes, which were extracted from the gene expression profile of TOP2A knockdown in a liver cancer cell line HEPG2. ZhangScore was employed to measure the connectivity between this gene signature and the gene expression profiles of the touchstone compounds in the HEPG2 cell line. Table 5 shows the top 10 compounds that mimic the regulatory mechanisms of TOP2A knockdown. Among them, doxorubicin, daunorubicin and irinotecan are well-known TOP2A inhibitors. Two of the other seven newly identified potential TOP2A inhibitors, diflunisal and SIB-1983, were also indicated by other studies. Diflunisal was determined to inhibit topo II ATPase and prevent topo II-mediated DNA cleavage [27]. SIB-1983 was predicted to be a topoisomerase inhibitor based on a computational study [28]. Five other connectivity methods were also employed to identify the potential TOP2A inhibitors based on the gene signature of TOP2A knockdown (Supplementary Figure 2a), and ZhangScore could identify more known TOP2A inhibitors than these five methods (Supplementary Figure 2b). In summary, ZhangScore achieved a higher level of accuracy for identifying known TOP2A inhibitors than other methods and was able to find new effective compounds for gene signatures derived from gene knockdown data.
Statistical results for Figure 3. AUC0.01 (partial ROC curve at the FPR = 0.01) and random permutation P value were measured. The statistical significance comparing ZhangScore and five other methods were also measured. The results of ZhangScore are shown in bold
| A375 | HA1E | HT29 | |||||||||
|---|---|---|---|---|---|---|---|---|---|---|---|
| Scoring method | Fold enrichment | AUC0.01 (P valuea) | P valueb | Fold enrichment | AUC0.01 (P value) | P value | Fold enrichment | AUC0.01 (P value) | P value | ||
| GSEAweight0 | 5.73 | 4.23e-4 (P < 0.0001) | 1.16e-5 | 5.32 | 3.98e-4 (P < 0.0001) | 2.40e-5 | 5.59 | 4.14e-4 (P < 0.0001) | 6.27e-4 | ||
| GSEAweight1 | 6.69 | 4.45e-4 (P < 0.0001) | 1.53e-4 | 6.25 | 4.46e-4 (P < 0.0001) | 4.03e-4 | 6.23 | 4.62e-4 (P < 0.0001) | 5.21e-3 | ||
| GSEAweight2 | 7.17 | 4.40e-4 (P < 0.0001) | 1.65e-4 | 7.02 | 4.76e-4 (P < 0.0001) | 0.0555 | 6.15 | 4.54e-4 (P < 0.0001) | 0.0102 | ||
| KS | 5.71 | 4.23e-4 (P < 0.0001) | 2.01e-5 | 5.30 | 3.98e-4 (P < 0.0001) | 5.40e-5 | 5.56 | 4.14e-4 (P < 0.0001) | 6.50e-4 | ||
| XSum | 6.31 | 4.27e-4 (P < 0.0001) | 1.77e-3 | 4.62 | 3.35e-4 (P < 0.0001) | 1.30e-5 | 3.91 | 2.96e-4 (P < 0.0001) | 4.90e-7 | ||
| ZhangScore | 7.96 | 5.72e-4 (P < 0.0001) | \ | 7.61 | 5.33e-4 (P < 0.0001) | \ | 6.72 | 5.37e-4 (P < 0.0001) | \ | ||
| VCAP | HEPG2 | MCF7 | |||||||||
| Scoring method | Fold enrichment | AUC0.01 (P value) | P value | Fold enrichment | AUC0.01 (P value) | P value | Fold enrichment | AUC0.01 (P value) | P value | ||
| GSEAweight0 | 5.06 | 3.41e-4 (P < 0.0001) | 9.01e-3 | 6.07 | 4.25e-4 (P < 0.0001) | 0.0148 | 5.51 | 4.04e-4 (P < 0.0001) | 0.0437 | ||
| GSEAweight1 | 6.27 | 4.01e-4 (P < 0.0001) | 0.0258 | 6.87 | 5.13e-4 (P < 0.0001) | 0.876 | 5.83 | 4.30e-4 (P < 0.0001) | 0.320 | ||
| GSEAweight2 | 6.27 | 3.54e-4 (P < 0.0001) | 1.22e-3 | 7.00 | 4.67e-4 (P < 0.0001) | 0.336 | 6.20 | 4.18e-4 (P < 0.0001) | 0.357 | ||
| KS | 5.08 | 3.40e-4 (P < 0.0001) | 9.82e-3 | 5.96 | 4.26e-4 (P < 0.0001) | 0.0200 | 5.53 | 4.05e-4 (P < 0.0001) | 0.0486 | ||
| XSum | 3.95 | 2.69e-4 (P < 0.0001) | 2.82e-5 | 5.15 | 3.69e-4 (P < 0.0001) | 9.70e-3 | 5.09 | 3.68e-4 (P < 0.0001) | 0.0207 | ||
| ZhangScore | 6.77 | 4.61e-4 (P < 0.0001) | \ | 7.67 | 5.18e-4 (P < 0.0001) | \ | 5.83 | 4.54e-4 (P < 0.0001) | \ | ||
| A549 | HCC515 | PC3 | |||||||||
| Scoring method | Fold enrichment | AUC0.01 (P value) | P value | Fold enrichment | AUC0.01 (P value) | P value | Fold enrichment | AUC0.01 (P value) | P value | ||
| GSEAweight0 | 10.3 | 7.41e-4 (P < 0.0001) | 8.13e-4 | 9.03 | 5.29e-4 (P < 0.0001) | 4.24e-11 | 6.30 | 4.89e-4 (P < 0.0001) | 0.0902 | ||
| GSEAweight1 | 11.9 | 9.11e-4 (P < 0.0001) | 0.578 | 12.2 | 8.15e-4 (P < 0.0001) | 2.99e-4 | 6.55 | 5.18e-4 (P < 0.0001) | 0.705 | ||
| GSEAweight2 | 12.2 | 9.67e-4 (P < 0.0001) | 0.0564 | 13.4 | 9.97e-4 (P < 0.0001) | 0.473 | 6.43 | 4.40e-4 (P < 0.0001) | 8.01e-3 | ||
| KS | 10.4 | 7.40e-4 (P < 0.0001) | 7.83e-4 | 8.99 | 5.29e-4 (P < 0.0001) | 5.72e-11 | 6.28 | 4.89e-4 (P < 0.0001) | 0.0991 | ||
| XSum | 10.7 | 7.22e-4 (P < 0.0001) | 2.16e-5 | 7.74 | 3.72e-4 (P < 0.0001) | 6.32e-13 | 6.22 | 4.20e-4 (P < 0.0001) | 1.21e-3 | ||
| ZhangScore | 12.1 | 8.93e-4 (P < 0.0001) | \ | 13.0 | 9.66e-4 (P < 0.0001) | \ | 6.53 | 5.25e-4 (P < 0.0001) | \ |
Fold enrichment is calculated as the ratio between true positive rate and false positive rate at FPR = 0.01.
aRandom permutation P value for AUC0.01.
bThe statistical significance between ZhangScore and five other methods.
Top 10 compounds matched to a gene signature of TOP2A knockdown in the HEPG2 cell line identified by ZhangScore
| Top 10 ranked compounds based on ZhangScore | Whether TOP2A inhibitor |
|---|---|
| Formoterol | U |
| Doxorubicin | Y |
| Methylergometrine | U |
| Daunorubicin | Y |
| Diflunisal | U |
| NSC-95397 | U |
| SIB-1893 | U |
| Thiethylperazine | U |
| Irinotecan | Y |
| L-655240 | U |
| Top 10 ranked compounds based on ZhangScore | Whether TOP2A inhibitor |
|---|---|
| Formoterol | U |
| Doxorubicin | Y |
| Methylergometrine | U |
| Daunorubicin | Y |
| Diflunisal | U |
| NSC-95397 | U |
| SIB-1893 | U |
| Thiethylperazine | U |
| Irinotecan | Y |
| L-655240 | U |
Y: well-known TOP2A inhibitor; U: unknown
Discussion and conclusion
In this study, we systematically evaluated six CMap methodologies by assessing their performance using L1000-based next-generation Connectivity Map data. Our results suggested that ZhangScore was generally superior to other methods and exhibited the highest accuracy for gene signature sizes ranging from 10 to 200. To our knowledge, ours is the first report to evaluate the early retrieval performance of connectivity methods based on L1000 data. Furthermore, we have developed a user-friendly R package RCSM to easily implement the six connectivity methods.
The number of genes to be included in the gene signatures has always been a question. The gene signatures with lengths greater than 500 are generally not suggested for use in analysis [7, 20]. The decision on the use of the gene signature size may also depend on the specific biological condition being investigated. Six different gene signature sizes covering the common range of length were tested in our study. We chose the gene signature size of 200 to perform the comparison for the consideration that too many or too few genes might be overly biased for representing a biological state. It was a compromise to choose the size of 200 in this comparison, and more evaluations and experiments should be carried out to provide a more detailed guide for choosing the length of a gene signature.
In previous studies [8, 20], the XCos and XSum method performed best on predicting drug–drug relationships and drug-indication pairs from the CMap pilot dataset, respectively. However, the preferred method changed when the comparison was extended to the much larger dataset. There are at least three possible reasons to account for this change. First, the benchmark set in this study was different from that of previous studies. Second, the methods used for comparison were different from these of previous studies. Third, the L1000 assay differed from the previously used microarray technology in both the experimental processes and the data pre-processing pipelines. These differences affect the distributions of gene expression fold changes for all genes, which may influence the performance of these methods. There are various data pre-processing pipelines for the L1000 data. Duan et al. [29] proposed a geometrical multivariate approach (the CD method) to identify differentially expressed genes from the L1000 data. Iorio et al. [4] provided a method (the MANTRA method) to deal with different ranking of genes in replicates by merging each replicate profile using a heuristic-based algorithm. Future work should include a comparison of different data pre-processing pipelines for L1000 data.
Besides these six methods we mentioned above, the performance of other similar methods, such as the XCos [20], TES [4, 30] and DIPS [19] methods, were also evaluated (Supplementary Table 1). The XCos method had an extremely worse performance than other methods. We did not evaluate this method in-depth because the input of the XCos method is different from that of other methods (KS, XSum, GSEAweight0, GSEAweight1, GSEAweight2 and ZhangScore) and it requires that the genes in one gene signature are ordered and given weights (Supplementary Figure 3). The TES method had the same performance with the GSEAweight1 method (Supplementary Table 1). The principles of the TES method and GSEAweight1 method are very similar to each other. The only difference is that the TES method does not require the up and down signature to have consistent direction of scores. The DIPS method was based on the TES method, and the principles of these two methods are almost the same.
The weight for the gene expression fold changes of each gene was a strong factor in characterizing one perturbagen. The core algorithm of ZhangScore measures the ranks for each gene according to the absolute value of the fold change. This rank-based weight of ZhangScore may be more appropriate for measuring the similarities between gene expression profiles of different perturbagens from the level 5 data of L1000. Since the gene signature sizes ranging from 10 to 200 are commonly utilized, ZhangScore might be the appropriate choice for measuring the similarities based on the L1000 data. If one has a gene signature with more than 500 genes, GSEAweight2 is also worth testing.
How to assign weights to the gene expression fold changes by the connectivity methods has a significant influence on the performance of these methods. The AUC0.001, AUC0.005 and AUC0.01 values of the KS method and GESAweight0 method are very close to each other because both these two methods have weakened weights for fold changes. In addition, they are both Kolmogorov–Smirnov-derived methods.
Taken together, evaluation of CMap methodologies has been extended to multiple cell types and more types of perturbagens. The conclusions from this study provide potential guidelines for researchers to choose the suitable method for drug repurposing based on L1000 data. Moreover, in addition to L1000 technology, there are other high-throughput technologies, such as HTS2 (high-throughput sequencing-based high-throughput screening) [31, 32], which can also generate large-scale gene profiling datasets, for which ZhangScore might also be appropriate.
We utilized the partial area under the ROC curve (AUC0.001, AUC0.005 and AUC0.01) at false positive rates of 0.001, 0.005 and 0.01 (FPR = 0.001, FPR = 0.005 and FPR = 0.01) to evaluate the performance of six connectivity methods.
Systematic evaluations of CMap methodologies have been extended to the L1000 data that contain the expression profiles of multiple human cell lines and various types of perturbagens.
ZhangScore is generally superior to other methods and exhibits the highest accuracy with the gene signature sizes ranging from 10 to 200.
Six methods used in this study have been implemented in R package and is freely available at https://github.com/Jasonlinchina/RCSM.
Funding
National Natural Science Foundation of China (81673460); Key Projects of Science and Technology Plan of Inner Mongolia Autonomous Region (201802115); Tsinghua-Peking Joint Center of Life Sciences.
Kequan Lin is a PhD candidate in School of Life Sciences, Tsinghua University. His research focuses on developing bioinformatics pipelines for cancer research and drug discovery.
Lu Li is a PhD candidate in School of Life Sciences, Tsinghua University. Her research focuses on drug discovery.
Yifei Dai is a PhD candidate at the Department of Basic Medical Sciences, School of Medicine, Tsinghua University. His research focuses on Traditional Chinese Medicine.
Huili Wang is a PhD candidate at the Department of Basic Medical Sciences, School of Medicine, Tsinghua University. Her research focuses on long non-coding RNA (lncRNA) and cancer.
Shuaishuai Teng is a PhD candidate at the Department of Basic Medical Sciences, School of Medicine, Tsinghua University. Her research focuses on epigenetics and cancer.
Xilinqiqige Bao is a chief pharmacist in Innovative Mongolian Pharmaceutical Preparations Laboratory, Inner Mongolia International Mongolian Hospital, whose research focuses on pharmacological research of Mongolian herbs.
Zhi John Lu is a professor in School of Life Sciences, Tsinghua University, whose lab is interested in bioinformatics studies for lncRNA and cancer.
Dong Wang is a professor in School of Basic Medical Sciences, Chengdu University of Traditional Chinese Medicine, whose lab is interested in cancer epigenetics and drug discovery.
References
Author notes
Kequan Lin and Lu Li contributed equally to this work.
