


Abstract
Genetic associations between mitochondrial DNA (mtDNA) and economic traits have been widely reported for pigs, which indicate the importance of mtDNA. However, studies on mtDNA heteroplasmy in pigs are rare. Next generation sequencing (NGS) methodologies have emerged as a promising genomic approach for detection of mitochondrial heteroplasmy. Due to the short reads, flexible bioinformatic analyses and the contamination of nuclear mitochondrial sequences (NUMTs), NGS was expected to increase false-positive detection of heteroplasmy. In this study, Sanger sequencing was performed as a gold standard to detect heteroplasmy with a detection sensitivity of 5% in pigs and then one whole-genome sequencing method (WGS) and two mtDNA enrichment sequencing methods (Capture and LongPCR) were carried out. The aim of this study was to determine whether mitochondrial heteroplasmy identification from NGS data was affected by NUMTs. We find that WGS generated more false intra-individual polymorphisms and less mapping specificity than the two enrichment sequencing methods, suggesting NUMTs indeed led to false-positive mitochondrial heteroplasmies from NGS data. In addition, to accurately detect mitochondrial diversity, three commonly used tools—SAMtools, VarScan and GATK—with different parameter values were compared. VarScan achieved the best specificity and sensitivity when considering the base alignment quality re-computation and the minimum variant frequency of 0.25. It also suggested bioinformatic workflow interfere in the identification of mtDNA SNPs. In conclusion, intra-individual polymorphism in pig mitochondria from NGS data was confused with NUMTs, and mtDNA-specific enrichment is essential before high-throughput sequencing in the detection of mitochondrial genome sequences.
Introduction
Mitochondrial DNA (mtDNA) has been widely reported on genetic association with complex traits in pigs, including muscle composition [1] and reproductive capacity [2–5], which indicates the importance of mtDNA. There are hundreds of copies of mtDNA in a cell. Mutations occurred in a part of mtDNA molecules usually results in the presence of more than one type of mitochondrial genomes within a cell or an individual, which is called heteroplasmy of a mitochondrial genome [6]. Heteroplasmy is an important factor in considering the severity of mitochondrial diseases in human [7]. Since the first report that the A8344G heteroplasmic mutation in tRNA-Lys caused myoclonic epilepsy and ragged red fiber disease [8, 9], heteroplasmy has been reported in various studies, including cancer cells [10, 11], blood and muscle biopsies from identical twins [12] and cells from the 1000 genomes project [13, 14]. The research on heteroplasmy in human mitochondria is broad and deep, however, it is rare in pigs.
Sanger sequencing can provide a detection of mtDNA heteroplasmy. Though it only has a detection sensitivity of 5% [15], it is sensitive enough for analyzing the influence of mutations on economic traits in pigs. Thus, Sanger sequencing can be seen as a gold standard for detection of heteroplasmy. Recently, next generation sequencing (NGS) methods have emerged as a promising approach for detection of mitochondrial heteroplasmy [16, 17], since it is technically possible to obtain enormous amounts of sequence data in short time at low cost [18, 19]. However, in addition to real heteroplasmic sites, there may be two other sources of mitochondrial intra-individual polymorphisms linked to the use of NGS short-read technology: (1) technical errors including sequencing errors and bioinformatic slips, and (2) DNA contaminations, which mainly refer to nuclear mitochondrial sequences (NUMTs) [20–23].
MtDNA is part of genetic materials in a cell, which can transfer to the nucleus and integrate into the nuclear genome, resulting in NUMTs [24–26]. Nearly all mitochondrial genome fragments can be integrated into the nuclear genome [27]. NUMTs root in the mitogenome, but are polymorphic [28, 29], which might disturb the detection of mitochondrial heteroplasmy [30].
In order to obtain heteroplasmic information of mitochondrial genome via NGS technology, there are two typical ways, direct and indirect sequencing [31]. The direct method is that mtDNA sequences were directly obtained after mtDNA enriched from total DNAs, including hybridization-based and polymerase chain reaction (PCR)-based enrichments [31, 32]. Indirect sequencing describes methods to obtain mtDNA sequences as byproducts of other types of high-throughput sequencing (HTS), such as whole-genome sequencing (WGS) [31]. The direct and indirect sequencings may detect different levels of mtDNA intra-individual polymorphism. If a true heteroplasmy or a technological error occurs, all sequencing methods will show the same level of the associated intra-individual polymorphism. However, if the intra-individual polymorphism results from NUMTs, the ratio will differ depending on the quantity of nuclear and mitochondrial genomes sequenced. Using indirect methods, both the nuclear and mitochondrial genomes are sequenced, giving rise to a high level of intra-individual polymorphic positions. While using direct methods, mitochondrial sequences are enriched, therefore, a lower level of intra-individual polymorphism can be expected [20].
In this study, we compared different methods to detect intra-polymorphisms using same samples, including Sanger sequencing, WGS, and two mtDNA enrichment sequencing (Capture and LongPCR). The aim was to determine whether mitochondrial heteroplasmy from NGS data was contaminated by NUMTs.
Methods
Animal collection and DNA extraction
Four samples representing three pig breeds, including a Tibetan pig (Z1), two unrelated Diannan small-ear pigs (DN1, DN2) and one Asian wild pig (A1), were collected for this study. All of them were females except DN1. They were from different geographical distributions, and they had different physiological characteristics. Total DNA was isolated from ear tissue using the QIAamp DNA Investigator kit (QIAGEN, Hilden, Germany) and following the manufacturer’s instruction. DNA quality was evaluated by spectrophotometry and agarose gel electrophoresis.
The guidelines of experimental animal management of China Agricultural University (CAU) were followed throughout the study, and the experimental protocols were approved by the Experimental Animal Care and Use Committee of CAU.
DNA sequencing
Sanger sequencing
The mitochondrial genome was PCR-amplified using 16 primer pairs described in Supplementary Table S1. Amplicons were bi-directionally sequenced using BigDye Terminator version 3.1 technology on an ABI 3730 system (Applied Biosystems, Foster City, CA, USA). Mitochondrial sequence analyses were performed using MEGA6 [33] and DnaSP v5 [34].
Hybridization capture-based enrichment (Capture)
DNA templates were ultrasonically sheared using a Covaris E220 (Covaris, Woburn, MA, USA) to yield ~150 bp fragments and then prepared for sequencing libraries following the workflow of the NEBNext Ultra DNA Library Preparation Protocol. Multiple Ampure Bead XP cleanups (Beckman Coulter, Brea, CA) were conducted to remove any adapter dimer that might have developed. The quality and concentration of libraries were determined on an Agilent 2100 Bioanalyzer (Agilent Technologies, Santa Clara, CA). Subsequently, target enrichment of the mitochondrial genome was performed on the amplified library using the MyGenostics Pig Mitochondria Capture Kit (MyGenostics Inc., Beijing, China). The capture kit was designed based on a pig mitochondrial genome sequence published on NCBI (NC_000845.1). The capture experiment was conducted with the Target Enrichment System (MyGenostics Inc., Beijing, China) according to the manufacturer’s protocol. A final post-enrichment amplification was performed for 15 cycles, whose product was quantified using quantitative PCR, and then paired-end sequenced (PE150) using the Illumina NextSeq 500 platform at MyGenostics Inc.
Summary of the different tools used with associated options to call SNPs
| Name | Software | Command | Option |
|---|---|---|---|
| BCF | SAMtools; BCFtools | mpileup; call | Default; -c |
| BCF_B | SAMtools; BCFtools | mpileup; call | -B; -c |
| BCF_E | SAMtools; BCFtools | mpileup; call | -E; -c |
| HAP | GATK | HaplotypeCaller | Default |
| UNI | GATK | UnifiedGenotyper | Default |
| UNI1 | GATK | UnifiedGenotyper | -ploidy 1 |
| VAR_B01 | SAMtools; VarScan | mpileup; mpileup2snp | -B; --min-var-freq 0.01 |
| VAR_B10 | SAMtools; VarScan | mpileup; mpileup2snp | -B; --min-var-freq 0.10 |
| VAR_B25 | SAMtools; VarScan | mpileup; mpileup2snp | -B; --min-var-freq 0.25 |
| VAR_E0 | SAMtools; VarScan | mpileup; mpileup2snp | -E; --min-var-freq 0 |
| VAR_E01 | SAMtools; VarScan | mpileup; mpileup2snp | -E; --min-var-freq 0.01 |
| VAR_E05 | SAMtools; VarScan | mpileup; mpileup2snp | -E; --min-var-freq 0.05 |
| VAR_E10 | SAMtools; VarScan | mpileup; mpileup2snp | -E; --min-var-freq 0.10 |
| VAR_E15 | SAMtools; VarScan | mpileup; mpileup2snp | -E; --min-var-freq 0.15 |
| VAR_E25 | SAMtools; VarScan | mpileup; mpileup2snp | -E; --min-var-freq 0.25 |
| VAR_E50 | SAMtools; VarScan | mpileup; mpileup2snp | -E; --min-var-freq 0.50 |
| VAR0 | SAMtools; VarScan | mpileup; mpileup2snp | Default; --min-var-freq 0 |
| VAR01 | SAMtools; VarScan | mpileup; mpileup2snp | Default; --min-var-freq 0.01 |
| VAR05 | SAMtools; VarScan | mpileup; mpileup2snp | Default; --min-var-freq 0.05 |
| VAR10 | SAMtools; VarScan | mpileup; mpileup2snp | Default; --min-var-freq 0.10 |
| VAR15 | SAMtools; VarScan | mpileup; mpileup2snp | Default; --min-var-freq 0.15 |
| VAR25 | SAMtools; VarScan | mpileup; mpileup2snp | Default; --min-var-freq 0.25 |
| VAR50 | SAMtools; VarScan | mpileup; mpileup2snp | Default; --min-var-freq 0.50 |
Long PCR-based enrichment (LongPCR)
The entire mtDNA was amplified by long-range PCR using two overlapping primer combinations (Supplementary Table S2). Each primer combination consisted of two overlapping primer pairs. The 50 μL PCR reaction system contained 8 μL dNTPs (10 mM each dNTP), 5 μL forward primer (10 mM), 5 μL backward primer (10 mM), 10 μL 5× KAPA Long Range Buffer (with Mg2+), 2.5 U KAPA Long Range DNA Polymerase (KAPA Biosystems, Wobum, MA) and 1 μL genomic DNA (approx. 20 ng/μL). Long PCR profiles were as follows: initial denaturation at 95°C for 3 min followed by 30 cycles of denaturation at 95°C for 15 s, annealing at 62/65°C (depending on the primer pair) for 30 s and extension at 72°C for 8 min and a final extension at 72°C for 10 min. The final reactions were examined by electrophoresis on a 1% agarose gel to assess the amplification efficiency. Then the PCR products were purified using the QIAquick PCR purification kit (QIAGEN, Hilden, Germany). Subsequently, they were ultrasonically sheared and then were submitted to library preparation following the workflow of the NEBNext Ultra DNA Library Preparation Protocol. Finally, the Illumina NextSeq 500 platform was used to perform HTS (PE150).
Whole-genome sequencing
DNA samples were ultrasonically sheared and prepared for sequencing libraries following the workflow of the NEBNext Ultra DNA Library Preparation Protocol. Library quality and concentration were determined on an Agilent 2100 Bioanalyzer. The quality-controlled genomic library for each sample was PE100 sequenced using the Illumina HiSeq 2000 sequencing system.
Bioinformatics analyses
Data quality filtering and mapping
Read quality was assessed using the FastQC software with a focus on base quality scores and guanine-cytosine content (GC content), N content and sequence duplication levels. Adapters and low-quality bases were removed using the Clip&Merge software [35]. Raw reads were filtered to exclude those of a nucleotide length of shorter than 35 bp and a Phred quality score of lower than 20. Forward and reverse reads were merged into single sequences if they overlapped by at least 8 bp.
Mapping was performed using BWA [36] with the default ‘aln’ and ‘samse’ parameters, except considering the overall number of mismatches tolerated in the alignment by setting the expected fraction of misalignments to 0.04 (−n). Reads were mapped against the NCBI mtDNA reference sequence NC_000845.1 (Sus scrofa). The produced BAM files were filtered for sequences with a mapping quality of at least 30. Duplicate removal was carried out on those reads that showed identical start and end coordinates only by the DeDup software. These tools were integrated into the EAGER-pipeline [35].
SNP calling strategies
The following variant callers were applied to each bam file from WGS data: SAMtools 1.3.1 [37] (including SAMtools and BCFtools), VarScan 2.3.9 [38] and GATK 3.7 [39], respectively. SAMtools [37] was used to generate a pileup file of read bases using the alignments to a reference sequence, with or without ‘-B’/‘-E’ options, and then BCFtools compiled single nucleotide polymorphisms (SNPs) into a variant call format (VCF) file. Base alignment quality (BAQ) computation is turned on by default and the ‘-B’ option disables it, while the ‘-E’ option ignores existing base quality and performs a more sensitive BAQ calculation. VarScan [38] was also used via the pipeline from samtools mpileup, with minimum variant frequencies of 0.01, 0.10 and 0.25, respectively. HaplotypeCaller and UnifiedGenotyper (with or without -ploidy 1 option) within GATK [39] were adopted to call SNPs. In total, three softwares with these different parameter options gave rise to 15 different SNP calling strategies (Table 1). Parameters were selected to ensure comparability among different callers. The minimum base quality required to consider a base for calling was set to be 30. Custom Perl scripts were developed to filter out the variants that the Sanger sequence was not available from VCF files. The related code lines can be accessed in the attachment (Supplementary code lines.docx).
mtDNA diversity assessment
The performance of each strategy was evaluated on the basis of sensitivity, specificity and overall genotype concordance by comparing the NGS results with the Sanger data, with the assumption that the Sanger sequencing gave the correct calling [20, 40, 41]. Only the positions where a Sanger sequence was available were kept. Concordant SNPs between Sanger and NGS data for each individual were considered as true SNPs, while the discrepancies were considered as errors. When NGS data did not see an alternate homozygote (i.e. an alternative sequence in a ratio of 100%) found with Sanger sequence, it was considered as a false negative. Accordingly, when NGS data identified an alternate homozygote not observed by Sanger sequence, it was considered as a false positive. The percentages were calculated as follows: the percentage of true SNPs as the number of true SNPs divided by the total number of genotypes over all SNPs positions from NGS data; the percentage of false positives, false negatives and errors as the number of false positives, false negatives and errors divided by the total number of genotypes over all SNPs positions (including the false-negative positions), respectively. In addition, a position with more than one nucleotide types was regarded as an intra-individual polymorphism of mtDNA, while an intra-individual polymorphic genotype from NGS data instead of a homozygote alternate or reference nucleotide type from Sanger sequencing was regarded as a false intra-individual polymorphism. Sanger sequencing provides a gold standard for detection of mtDNA heteroplasmy with 5% sensitivity [15], which restricted the sensitive threshold for detection of the false intra-individual polymorphism. The detection of the total intra-individual polymorphism from NGS data was not limited by the sensitivity due to the high sequencing depth (~200×).
To assess the robustness of the experiment consequence, both the individual results for each sample and the combined results for the four samples were analyzed and summarized.
Quality control on mtDNA diversity assessment
Quality control (QC) might impact the genetic diversity assessment of mitochondrial genomes, which mainly involved the quality criteria of mapping and SNP filtering. Mapping quality is the probability that reads are correctly placed during the alignment process [40], i.e. the mapping quality threshold for read trimming (the ‘-q’ option) in the BWA aligner [36]. SNP filtering quality is the quality of individual bases assessed during the variation filtering process, i.e. the minimum base quality required to consider a base for calling (‘-Q’ for SAMtools, ‘--min-avg-qual’ for VarScan and ‘-mbq’ for GATK). It was reported that a quality of at least 20 was required to obtain genome sequences by Illumina sequencing [40]. The mapping and SNP filtering qualities were controlled at 30 in the above analyses. Therefore, the lower quality was set to 20 or 0 in this study.
Influence of NGS methods on intra-individual polymorphism of mitogenome
To avoid biases in sequencing depth, the number of reads was normalized to get a similar average coverage for the Capture, LongPCR and WGS approaches. SAMtools with the ‘-E’ option was used to generate an mpileup file, which was used by VarScan with the minimum variant allele frequency threshold set to 0.25. Then, the number of the observed intra-individual polymorphisms (intra-polymorphisms) and of the false intra-polymorphisms were analyzed for the Capture, LongPCR and WGS data.
Furthermore, only reads mapped to the mitochondrial genome were kept and mapped to the nuclear genome (S. scrofa11.1, GCA_000003025.6) by BWA with the above-mentioned parameters. The number of reads mapping on both the mitochondrial and the nuclear genome was tallied up, and a mapping specificity was calculated as the number of reads uniquely mapping on the mitochondrial genome divided by all the reads that could map to the mitochondrial genome.
Results
Sanger sequencing results
Whole mitochondrial genomes except the repetitive region were obtained by Sanger sequencing for the four samples (Supplementary Table S3). All the alternates were detected to be homozygous by bi-directionally sequencing. By comparing to the reference sequence (NC_000845.1), a total of 213, 211, 213 and 212 SNPs were found in the mitochondrial genomes of A1, DN1, DN2 and Z1, respectively. In addition, there were 31 diversities among the four samples, representing a comprehensive spectrum of mtDNA polymorphism. The SNP information is listed in Supplementary Table S4.
VarScan is most effective for mitochondrial SNP calling
The three widely used variant callers, SAMtools 1.3.1 [37], VarScan 2.3.9 [38] and GATK 3.7 [39], with different options led to 15 SNP calling pipelines, which were used to detect mtDNA polymorphisms of the four samples. The VarScan methods performing the default BAQ computation or a more sensitive BAQ calculation with ‘-E’ found almost all the SNPs (only one was missed) (Figure 1A) and achieved the maximum percentage of true SNPs (Figure 1B). Moreover, these methods create very few false positives, false negatives and errors (Figure 1C–E). When choosing the ‘-B’ option, though all the true SNPs were retrieved (Figure 1A) and false negatives were controlled (Figure 1D), too many false positives were found (Figure 1C) resulting in a high percentage of errors (Figure 1E) and a large number of false intra-individual polymorphisms (Figure 1F). Furthermore, the effectiveness of VarScan was conditioned on a minimum variant allele frequency to tune the divergent frequency. Its performances were better when the frequency was set to 0.10 or 0.25 rather than 1%, especially with regard to the true rate and the number of false intra-polymorphic positions (Figure 1B and F).
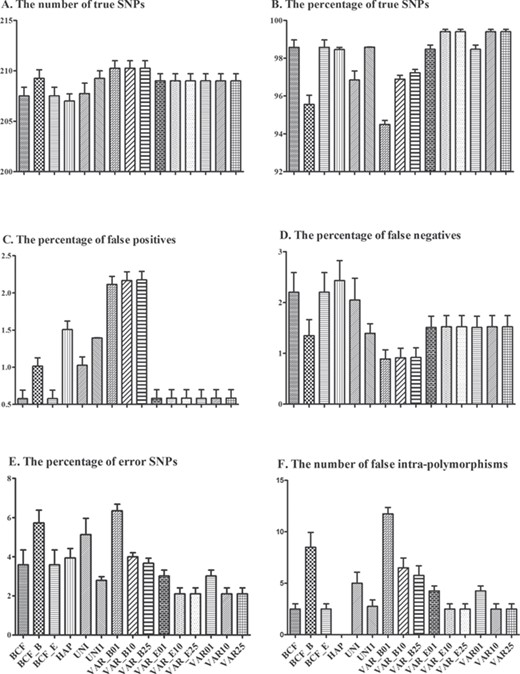
Comparison of the different SNP calling strategies on the four samples for the number of true SNPs (A), the percentage of true SNPs (B), false positives (C), false negatives (D) and error SNPs (E) and the number of false intra-individual polymorphisms (F). More detailed information can be found in Supplementary Table S6.
The combined strategies of SAMtools and BCFtools found most of the true SNPs (Figure 1A), but they also generated many false negative positions (Figure 1D) coupled with an increased proportion of error SNPs (Figure 1E). Similar to the results of the VarScan methods, when the ‘-B’ option was selected, though more true SNPs were retrieved (Figure 1A) and false negatives were lower (Figure 1D), many more false positives were found (Figure 1C) resulting in a higher percentage of errors (Figure 1E) and a larger number of false intra-individual polymorphisms (Figure 1F). The GATK strategies missed a lot of correct SNPs (Figure 1A), while generating many false positives and false negatives (Figure 1C and D) coupled with a high proportion of errors (Figure 1E). GATK HaplotypeCaller removed all intra-individual polymorphic positions (Figure 1F), but led to an increase of false positives compared to the Sanger reference (Figure 1C). Detailed SNP calling results are listed in Supplementary Table S5.
Furthermore, these SNP calling strategies were carried out on each of the four samples and resulted in the individual results, respectively (Supplementary Figures S1–S4), which obtained similar results to the combined results (Figure 1). Alternatively, for DN1, the combined strategies of SAMtools and BCFtools showed the same performances as the VarScan methods when performing the default BAQ computation or a more sensitive BAQ calculation.
To assess the effect of the minimum variant allele frequency (the option ‘--min-var-freq’), it was serially set to 0, 0.01, 0.05, 0.10, 0.15, 0.25 and 0.50, respectively. Consistent results were obtained with a default BAQ computation and with a more sensitive BAQ calculation with ‘-E’. It was observed to decrease as the frequency value increased. When the frequency set to 0–0.05, the number of false intra-polymorphism remained the high level. Following that, when the frequency increased to 0.10, it steeply declined to the lowest level, which then remained stable (Figure 2).
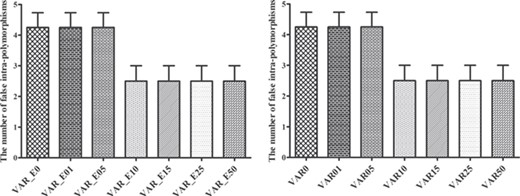
Effects of the VarScan methods when performing the default BAQ computation (VAR) or a more sensitive BAQ calculation with ‘-E’ (VAR_E) considering different options of minimum variant allele frequency (0, 0.01, 0.05, 0.10, 0.15, 0.25 and 0.50) on the false intra-individual polymorphisms.

Effects of the NGS approaches on the false (A) and the total (B) intra-individual polymorphisms.
Similar patterns of MtDNA diversity by different QC criteria
The QC of 20 or 0 provided similar outcomes in the aspects of true SNPs, false positives, false negatives, errors and intra-individual polymorphism among the different SNP calling strategies, and resulted in the same most effective strategies, the VarScan software with ‘-E’ or by the default parameter (Supplementary Figures S5 and S6), as with the above QC of 30. Furthermore, to assess the impact of the option ‘--min-var-freq’ under the QC of 20 or 0, it was set to 0, 0.01, 0.05, 0.10, 0.15, 0.25 and 0.50. In result, the number of false intra-polymorphisms was observed to decrease as the frequency value increased. When the frequency set to 0–0.05, the number of false intra-polymorphism remained the high level. Following that, when the frequency increased to 0.10, it steeply declined. Subsequently, when the frequency increased to 0.25, it declined to the lowest level, which then remained stable (Supplementary Figures S5F and S6F).
NGS methods affect observed mitochondrial heteroplasmy
To avoid biases in sequencing depth, the number of reads was normalized to get a similar average coverage (~200×) for the Capture, LongPCR and WGS approaches (Supplementary Table S7). The impact of NGS methods on mitochondrial heteroplasmy was evaluated by the number of false intra-polymorphism. The result showed that the WGS method generated the highest false intra-polymorphism, followed by LongPCR and then Capture (Figure 3A). The number of total intra-individual polymorphisms was also analyzed and yielded similar results (Figure 3B). The ratio of the NUMT reads was narrowly estimated based on the intra-individual polymorphism and detailed information is listed in Supplementary Table S8.
In order to assess whether this result could be explained by differential mapping depending on the methodology, we mapped the reads that mapped to the mitochondrial genome against the nuclear genome as well. The percentage of reads mapping simultaneously on the mitochondrial and the nuclear genome was high for WGS, intermediate for Capture and low for LongPCR sequencing approaches. Thus, the mapping specificity increased in the order WGS, Capture and LongPCR (Figure 4). Detailed information is listed in Supplementary Table S8.
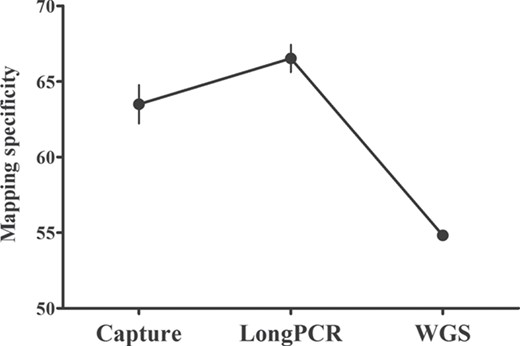
Effects of the NGS approaches on the mapping specificity. The mapping specificity referred to the percentage of reads uniquely mapped to the mitochondrial genome, the number of reads uniquely mapping on the mitochondrial genome divided by all the reads that could map to the mitochondrial genome.
Discussion
NGS can yield sequencing throughput on the gigabase (Gb) scale, which enhances the ability to detect polymorphisms [18, 19]. However, there are homologous DNA sequences between nuclear and mitochondrial genomes. Due to their short read length, NGS data are prone to affects the alignment of mitochondrial genomes by mapping nuclear sequences to the mitogenome. From NGS data, in addition to truly existing heteroplasmies, intra-individual polymorphisms of mitochondrial genomes can also come from technical errors or NUMTs in a cell [20–23]. Previous studies showed that the transfer of genetic materials from mitochondria to the nucleus and their integration into the nuclear genome occurred at a frequency of 10−3 to 10−4 per cell per generation [42], suggesting that the formation of NUMTs is an important mechanism of eukaryotic genome evolution [43–45]. Even though they have initially identical sequences to their homologous mtDNA fragments, NUMTs evolve more slowly than mtDNA [46], and may become highly polymorphic at a specific site [28, 29], resulting in strong interference with studies of mitogenome analyses and heteroplasmy detections [30]. NUMTs have been mistaken as heteroplasmic sites, as in the previous case of an association of mutations in COX1 and COX2 genes with Alzheimer’s disease [47], which later turned out to be an artefact due to an accidental amplification of NUMTs using ρ0 cells (depleted of mtDNA) [48, 49]. The paralogous fragments turned out to be a barrier to the accurate detection of mitochondrial heteroplasmy, which should be properly dealt with [5]. On the other hand, Sanger sequencing is a robust testing method able to detect DNA polymorphism and has been widely used as the standard sequencing technology in defining the polymorphic spectrum of mtDNA [50].
MtDNA has genetic effects on complex traits in pigs [2–5], and its heteroplasmy might play a role, according to its importance in mitochondrial diseases in human [7]. However, studies on heteroplasmy in pigs are rare, although they are common for humans [10–14]. In this study, one WGS method and two mtDNA enrichment sequencing (Capture and LongPCR) methods were carried out and compared with Sanger sequencing, to explore whether NUMTs led to false-positive heteroplasmies in pig mitochondrial genome sequencing. Using Sanger sequencing with a detection sensitivity of 5%, our results detected zero intra-individual polymorphism in the pigs investigated. Different intra-individual polymorphism levels were observed using different NGS methods, with whole-genome sequencing resulting in more false-positive heteroplasmies than enrichment sequencing methods (Figure 3). More specifically, our results suggest that the WGS approach resulted in a higher level of observed intra-individual polymorphic positions because of the tendency of sequencing nuclear DNA, while enrichment sequencing methods resulted in a lower level of intra-individual polymorphisms because of the enrichment of mtDNA-specific sequences. The level of intra-individual polymorphisms depends on the quantity of nuclear and mitochondrial genomes sequenced [20], which is not true anymore when a true heteroplasmy or a technical error occurs. Moreover, the total number of intra-individual polymorphic sites and the mapping specificity to mitogenome were analyzed and got similar results to the false-positive heteroplasmies (Figures 3 and 4). Thus, it is reasonable to deduce that intra-individual polymorphisms in mitochondrial genomes resulted from several DNA sequences homologous to mtDNA, i.e. mitochondrial heteroplasmies from NGS data were confused with NUMTs in pigs. Therefore, enriching mitochondrial genomes should be regarded as an essential step before HTS for heteroplasmy calling.
Coverage is a key factor in variant calling and might impact its performance. Here, NGS sequences were all normalized to a uniform coverage of 200× for the Capture, LongPCR and WGS approaches. It was reported that above 100× coverage was sufficient for SNP calling [51]. Thus, the results were reliable enough in terms of coverage. PE100 and PE150 reads are different read length for genome assembly, which have been widely used for NGS analyses. Palmieri et al. [52] compared the mapping efficiency of reads of different length, and the result showed that for smaller genomes, such as yeast and Drosophila, even the shortest 35 bp reads performed well and did not result in a major bias. Pig mitogenome is merely 16 kb in length; therefore, read length can barely affect the mapping specificity of the mitochondrial genome by PE100 or PE150.
The lower mapping specificity of Capture than that of LongPCR (Figure 4) indicated that the percentage of reads mapping simultaneously on the mitochondrial and the nuclear genome was higher for Capture than LongPCR (Supplementary Table S8). Indeed, the Capture method might enrich a quantity of off-target sequences due to partial similarity between baits and other genomic loci and random nonspecific entrapment [53], which could account for its low mapping specificity.
LongPCR was assumed to exclude NUMTs due to long-range amplicons (>8000 bp). However, we failed remarkably avoiding NUMTs in current experiment. Similarity searches were performed by two BLAST searches of the reference pig mitochondrial genome sequence NC_000845.1 and the LongPCR primers against the latest pig genome sequence (S. scrofa11.1), respectively. In result, NUMT sequences covered whole mitochondrial genome, 312 hits with 46–100% query cover and 68.07–100% identity were obtained (Supplementary Table S9) in our experiment, actually it is very hard to avoid NUMTs completely. In this study, in order to achieve mitogenomes of three pig breeds, the LongPCR primers were designed relatively universal, which probably increased the possibility of NUMT amplifications. As the overall result, LongPCR method still acted in our experiments, which partly reduced false intra-individual polymorphisms (1.5 for LongPCR, 2.5 for WGS on average).
Improper treatments of NGS data can influence the apparent observation of intra-individual polymorphisms. However, if an error from the bioinformatic analysis occurs, the above-mentioned sequencing methods will show the same level of the observed intra-individual polymorphisms, which means the error is impossibly conjectured by comparison of different sequencing methods. Thus, considerations of appropriate analytic strategies are important for the detection of mtDNA polymorphisms. Our data revealed that VarScan [38] optimized specificity and sensitivity on the detection of mtDNA polymorphism and heteroplasmy. Since it does not rely on any assumptions, VarScan was recommended for universal ploidy level analyses [20], especially for the haploid mitochondrial genome. In contrast, GATK [39] and the combination of BCFtools with SAMtools [37] are based on a Bayesian model where the prior used is the diploid genotype probabilities.
Our results unveiled that performing the default BAQ computation or a more sensitive calculation with ‘-E’ was better than turning off the calculation with ‘-B’ in the generation of mpileup files. BAQ is a phred-like score representing the probability that a read base is misaligned and lowers the base quality score of mismatches near small insertions or deletions. In addition to base quality and mapping quality, BAQ is another useful statistic towards accurate SNP calling [54]. BAQ can successfully resolve false-positive SNP calls due to alignment artifacts, though it maybe causes real SNPs to be missed, leading to a slightly higher false-negative rate. BAQ computation is turned on by default in SAMtools mpileup and can be disabled with ‘-B’. Furthermore, with ‘-E’, a more sensitive BAQ can be recalculated by making a new alignment [37]. In this study, when using ‘-E’ or by default, SAMtools mpileup provided a more accurate result than that of using ‘-B’. It resulted in higher frequency of true SNPs, lower frequency of false positives and errors, lower number of false intra-individual polymorphic positions, however, a slightly higher frequency of false negatives (Figure 1 and Supplementary Figures S1–S6). Thus, recalibration of base quality scores is crucial for accurate variant calling [55–57]. In addition, the same results were obtained when using the default parameter as when using ‘-E’, possibly due to the proper base quality and mapping QCs in the preceding flow, which made the extended recalculation of BAQ provide little gains [57].
The VarScan software can tune the minimum variant allele frequency threshold [38] to allow or disallow polymorphism according to specific goals. This study aims to analyze the source of mitochondrial heteroplasmy, so it is proper to set the frequency lower than 0.50, which allows the observation of intra-individual polymorphism. In result, the number of observed false intra-individual polymorphisms decreased as the frequency increased, reached the lowest value with the frequency set to 0.10 under the QC value of 30 (Figure 1F, Supplementary Figures S1F, S2F, S3F and S4F). When the quality criteria were lowered to 20 or even 0, the number of false intra-individual polymorphisms was at an intermediate level with the frequency of 0.10 and was well held back with the frequency of 0.25 (Supplementary Figures S5F and S6F). Conclusively, the minimum variant frequency was set to 0.25 to ensure the effectiveness of different HTS methods.
Authors’ contributions
X.Z. designed the study. J.L. collected the samples and provided WGS data. H.X. sequenced the samples using mtDNA enrichment methods and Sanger method. D.W. analyzed data, and X.Z., D.W., H.X., C.N., H.L. and J.L. wrote the manuscript.
NUMTs result in false-positive mitochondrial heteroplasmies in pigs using NGS data.
Mitochondrial DNA-specific enrichment is essential before high-throughput sequencing in the detection of the mitochondrial genome.
VarScan was able to achieve the best specificity and sensitivity by considering the base alignment quality re-computation and the minimum variant frequency of 0.25.
Acknowledgements
We thank Prof. Mingkun Li (Beijing Institute of Genomics, Chinese Academy of Sciences) for discussing data analyses, and Prof. Dr Michael Hofreiter (University of Potsdam) for proofreading all grammar and sentence usages.
Funding
National Natural Science Foundations of China (31672379 and 31661143013), the National Key Basic Research Program of China (2014CB138500), Guangdong Provincial Key Laboratory of Animal Molecular Design and Precise Breeding (163-2018-XMZC-0001-04-1554) and the Scientific Research Start-up Fund for High-level Talents of Foshan University (099/CGZ07265).
Dan Wang is a PhD student on animal breeding and genetics at China Agricultural University. She has worked in quantitative genetics and statistical genomics and evolution and domestication of native animals.
Hai Xiang is a professor at Foshan University. He is interested in mtDNA effects on animal economic traits and livestock origin and domestication.
Chao Ning is a software developer at China Agricultural University. He has worked in computational biology and bioinformatics, including genome-wide association study and omics analysis.
Hao Liu is a PhD student on animal breeding and genetics at China Agricultural University. He is good at biogenetics and molecular genetics.
Jian-Feng Liu is a professor at China Agricultural University. He has worked in a variety of fields in bioinformatics and computational biology, including genome analysis and NGS analysis.
Xingbo Zhao is a professor on animal breeding and genetics at China Agricultural University. He is interested in mtDNA effects on animal economic traits and livestock origin and domestication.
References
Author notes
These authors contributed equally to this work.
